Tlalixtac de Cabrera Airbnb Market Analysis 2026: Short Term Rental Data & Vacation Rental Statistics in Oaxaca, Mexico
Is Airbnb profitable in Tlalixtac de Cabrera in 2026? Explore comprehensive Airbnb analytics for Tlalixtac de Cabrera, Oaxaca, Mexico to uncover income potential. This 2026 STR market report for Tlalixtac de Cabrera, based on AirROI data from February 2025 to January 2026, reveals key trends in the niche market of 37 active listings.
Whether you're considering an Airbnb investment in Tlalixtac de Cabrera, optimizing your existing vacation rental, or exploring rental arbitrage opportunities, understanding the Tlalixtac de Cabrera Airbnb data is crucial. Leveraging the low regulation environment is key to maximizing your short term rental income potential. Let's dive into the specifics.
Key Tlalixtac de Cabrera Airbnb Performance Metrics Overview
Monthly Airbnb Revenue Variations & Income Potential in Tlalixtac de Cabrera (2026)
Understanding the monthly revenue variations for Airbnb listings in Tlalixtac de Cabrera is key to maximizing your short term rental income potential. Seasonality significantly impacts earnings. Our analysis, based on data from the past 12 months, shows that the peak revenue month for STRs in Tlalixtac de Cabrera is typically March, while May often presents the lowest earnings, highlighting opportunities for strategic pricing adjustments during shoulder and low seasons. Explore the typical Airbnb income in Tlalixtac de Cabrera across different performance tiers:
- Best-in-class properties (Top 10%) achieve $3,784+ monthly, often utilizing dynamic pricing and superior guest experiences.
- Strong performing properties (Top 25%) earn $1,373 or more, indicating effective management and desirable locations/amenities.
- Typical properties (Median) generate around $499 per month, representing the average market performance.
- Entry-level properties (Bottom 25%) see earnings around $203, often with potential for optimization.
Average Monthly Airbnb Earnings Trend in Tlalixtac de Cabrera
Tlalixtac de Cabrera Airbnb Occupancy Rate Trends (2026)
Maximize your bookings by understanding the Tlalixtac de Cabrera STR occupancy trends. Seasonal demand shifts significantly influence how often properties are booked. Typically, Augustsees the highest demand (peak season occupancy), while May experiences the lowest (low season). Effective strategies, like adjusting minimum stays or offering promotions, can boost occupancy during slower periods. Here's how different property tiers perform in Tlalixtac de Cabrera:
- Best-in-class properties (Top 10%) achieve 60%+ occupancy, indicating high desirability and potentially optimized availability.
- Strong performing properties (Top 25%) maintain 38% or higher occupancy, suggesting good market fit and guest satisfaction.
- Typical properties (Median) have an occupancy rate around 20%.
- Entry-level properties (Bottom 25%) average 8% occupancy, potentially facing higher vacancy.
Average Monthly Occupancy Rate Trend in Tlalixtac de Cabrera
Average Daily Rate (ADR) Airbnb Trends in Tlalixtac de Cabrera (2026)
Effective short term rental pricing strategy in Tlalixtac de Cabrera involves understanding monthly ADR fluctuations. The Average Daily Rate (ADR) for Airbnb in Tlalixtac de Cabrera typically peaks in December and dips lowest during February. Leveraging Airbnb dynamic pricing tools or strategies based on this seasonality can significantly boost revenue. Here's a look at the typical nightly rates achieved:
- Best-in-class properties (Top 10%) command rates of $302+ per night, often due to premium features or locations.
- Strong performing properties (Top 25%) achieve nightly rates of $117 or more.
- Typical properties (Median) charge around $65 per night.
- Entry-level properties (Bottom 25%) earn around $43 per night.
Average Daily Rate (ADR) Trend by Month in Tlalixtac de Cabrera
Get Live Tlalixtac de Cabrera Market Intelligence 👇

Explore Real-time Analytics
Airbnb Seasonality Analysis & Trends in Tlalixtac de Cabrera (2026)
Peak Season (March, August, February)
- Revenue averages $1,955 per month
- Occupancy rates average 34.4%
- Daily rates average $111
Shoulder Season
- Revenue averages $1,197 per month
- Occupancy maintains around 26.5%
- Daily rates hold near $118
Low Season (January, May, June)
- Revenue drops to average $725 per month
- Occupancy decreases to average 18.0%
- Daily rates adjust to average $116
Seasonality Insights for Tlalixtac de Cabrera
- The Airbnb seasonality in Tlalixtac de Cabrera shows highly seasonal trends requiring careful strategy. While the sections above show seasonal averages, it's also insightful to look at the extremes:
- During the high season, the absolute peak month showcases Tlalixtac de Cabrera's highest earning potential, with monthly revenues capable of climbing to $1,981, occupancy reaching a high of 41.9%, and ADRs peaking at $123.
- Conversely, the slowest single month of the year, typically falling within the low season, marks the market's lowest point. In this month, revenue might dip to $492, occupancy could drop to 12.9%, and ADRs may adjust down to $109.
- Understanding both the seasonal averages and these monthly peaks and troughs in revenue, occupancy, and ADR is crucial for maximizing your Airbnb profit potential in Tlalixtac de Cabrera.
Seasonal Strategies for Maximizing Profit
- Peak Season: Maximize revenue through premium pricing and potentially longer minimum stays. Ensure high availability.
- Low Season: Offer competitive pricing, special promotions (e.g., extended stay discounts), and flexible cancellation policies. Target off-season travelers like remote workers or budget-conscious guests.
- Shoulder Seasons: Implement dynamic pricing that balances peak and low rates. Target weekend travelers or specific events. Offer slightly more flexible terms than peak season.
- Regularly analyze your own performance against these Tlalixtac de Cabrera seasonality benchmarks and adjust your pricing and availability strategy accordingly.
Best Areas for Airbnb Investment in Tlalixtac de Cabrera (2026)
Exploring the top neighborhoods for short-term rentals in Tlalixtac de Cabrera? This section highlights key areas, outlining why they are attractive for hosts and guests, along with notable local attractions. Consider these locations based on your target guest profile and investment strategy.
| Neighborhood / Area | Why Host Here? (Target Guests & Appeal) | Key Attractions & Landmarks |
|---|---|---|
| Centro Histórico | The historic center of Tlalixtac de Cabrera offers a rich cultural experience with traditional architecture and local markets. It is attractive to tourists interested in exploring the local history and vibrant community life. | Church of San Juan Bautista, Oaxaca Ethnobotanical Garden, Andador Turístico, Museum of Contemporary Art, Local food markets |
| Monte Albán | A UNESCO World Heritage site located nearby, Monte Albán is an ancient Zapotec city that draws many visitors for its archaeological significance and stunning views. | Monte Albán archaeological site, Museo de las Culturas de Oaxaca, Cliffside views, Historical ruins, Cultural festivals |
| Zócalo | The main square of Oaxaca is a bustling hub of activity with restaurants, shops, and frequent cultural events. Ideal for tourists looking to experience the vibrant atmosphere of Oaxaca. | Oaxaca Cathedral, Government Palace, Many cafes and restaurants, Street performers, Local artisans market |
| San Agustín Etla | A picturesque town near Tlalixtac, known for its artisan workshops and the beautiful Etla Valley. Appeals to visitors interested in crafts and rural tourism. | Artisan workshops, Nature trails, Local gastronomy, Art spaces like Centro de las Artes de San Agustín |
| Ocotlán de Morelos | This town is known for its crafts and markets, especially for Oaxacan textiles and pottery. It attracts visitors interested in authentic shopping experiences. | Traditional artisan markets, Beautiful colonial architecture, Local food specialties, Ceramic workshops |
| Teotitlán del Valle | Famous for its rug weaving, this village offers visitors insights into local culture and craftsmanship, ideal for those seeking unique souvenirs. | Rug weaving demonstrations, Cultural workshops, Local cuisine, Nature walks |
| Tlacolula de Matamoros | Known for its Sunday market, one of the largest in the region, where visitors can find traditional foods, crafts, and a variety of local products. | Sunday market, Dozens of local food stalls, Traditional crafts, Historic church, Local music performances |
| Hierve el Agua | This natural wonder features stunning mineral springs and natural rock formations. It is a popular destination for day trips and nature enthusiasts. | Mineral springs, Natural infinity pools, Scenic hiking trails, Breathtaking views, Cultural significance |
Understanding Airbnb License Requirements & STR Laws in Tlalixtac de Cabrera (2026)
While Tlalixtac de Cabrera, Oaxaca, Mexico currently shows low STR regulations, specific Airbnb license requirements might still exist or change. Always verify the latest short term rental regulations and Airbnb license requirements directly with local government authorities for Tlalixtac de Cabrera to ensure full compliance before hosting.
(Source: AirROI data, 2026, finding no licensed listings among those analyzed)
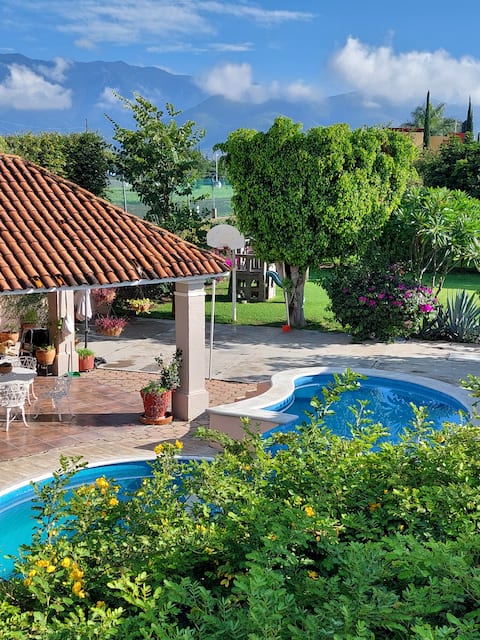
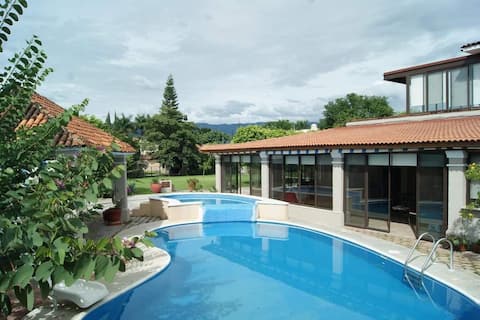
Top Performing Airbnb Properties in Tlalixtac de Cabrera (2026)
Benchmark your potential! Explore examples of top-performing Airbnb properties in Tlalixtac de Cabrerabased on Trailing Twelve Month (TTM) revenue. Analyze their characteristics, revenue, occupancy rate, and ADR to understand what drives success in this market.
Casa Quinta Mar +LOFT, Country House, Tule, Oaxaca
Entire Place • 6 bedrooms
Casa Quinta Mar Ground Floor, Country House Oaxaca
Entire Place • 5 bedrooms

Minimalist architectual jewel near Oaxaca City
Entire Place • 2 bedrooms
Casa Eunoia Oaxaca 5B 4BR (14 people)
Entire Place • 5 bedrooms

Altar of the Mountains
Entire Place • 3 bedrooms

Modern house with pool for relaxation
Entire Place • 3 bedrooms
Note: Performance varies based on location, size, amenities, seasonality, and management quality. Data reflects the past 12 months.
Top Performing Airbnb Hosts in Tlalixtac de Cabrera (2026)
Learn from the best! This table showcases top-performing Airbnb hosts in Tlalixtac de Cabrera based on the number of properties managed and estimated total revenue over the past year. Analyze their scale and performance metrics.
| Host Name | Properties | Grossing Revenue | Stay Reviews | Avg Rating |
|---|---|---|---|---|
| Adela | 2 | $142,318 | 60 | 4.96/5.0 |
| Alicia | 2 | $44,589 | 209 | 5.00/5.0 |
| Eber | 1 | $26,527 | 15 | 4.67/5.0 |
| Marcela | 3 | $17,335 | 8 | 5.00/5.0 |
| Cesar | 1 | $14,272 | 1 | Not Rated |
| Anel | 1 | $10,762 | 45 | 4.82/5.0 |
| Helena | 1 | $9,954 | 19 | 4.79/5.0 |
| Irvin | 1 | $9,681 | 26 | 5.00/5.0 |
| Rigoberto | 3 | $9,257 | 258 | 4.95/5.0 |
| Gerardo | 1 | $9,128 | 38 | 4.82/5.0 |
Analyzing the strategies of top hosts, such as their property selection, pricing, and guest communication, can offer valuable lessons for optimizing your own Airbnb operations in Tlalixtac de Cabrera.
Dive Deeper: Advanced Tlalixtac de Cabrera STR Market Data (2026)
Ready to unlock more insights? AirROI provides access to advanced metrics and comprehensive Airbnb data for Tlalixtac de Cabrera. Explore detailed analytics beyond this report to refine your investment strategy, optimize pricing, and maximize your vacation rental profits.
Explore Advanced MetricsTlalixtac de Cabrera Short-Term Rental Market Composition (2026): Property & Room Types
Room Type Distribution
Property Type Distribution
Market Composition Insights for Tlalixtac de Cabrera
- The Tlalixtac de Cabrera Airbnb market composition is heavily skewed towards Entire Home/Apt listings, which make up 89.2% of the 37 active rentals. This indicates strong guest preference for privacy and space.
- Looking at the property type distribution in Tlalixtac de Cabrera, House properties are the most common (51.4%), reflecting the local real estate landscape.
- Houses represent a significant 51.4% portion, catering likely to families or larger groups.
- The presence of 8.1% Hotel/Boutique listings indicates integration with traditional hospitality.
- Smaller segments like outdoor/unique (combined 2.7%) offer potential for unique stay experiences.
Tlalixtac de Cabrera Airbnb Room Capacity Analysis (2026): Bedroom Distribution
Distribution of Listings by Number of Bedrooms
Room Capacity Insights for Tlalixtac de Cabrera
- The dominant room capacity in Tlalixtac de Cabrera is 1 bedroom listings, making up 35.1% of the market. This suggests a strong demand for properties suitable for couples or solo travelers.
- Together, 1 bedroom and 2 bedrooms properties represent 64.8% of the active Airbnb listings in Tlalixtac de Cabrera, indicating a high concentration in these sizes.
- A significant 29.7% of listings offer 3+ bedrooms, catering to larger groups and families seeking more space in Tlalixtac de Cabrera.
Tlalixtac de Cabrera Vacation Rental Guest Capacity Trends (2026)
Distribution of Listings by Guest Capacity
Guest Capacity Insights for Tlalixtac de Cabrera
- The most common guest capacity trend in Tlalixtac de Cabrera vacation rentals is listings accommodating 2 guests (32.4%). This suggests the primary traveler segment is likely couples or solo travelers.
- Properties designed for 2 guests and 4 guests dominate the Tlalixtac de Cabrera STR market, accounting for 51.3% of listings.
- 37.8% of properties accommodate 6+ guests, serving the market segment for larger families or group travel in Tlalixtac de Cabrera.
- On average, properties in Tlalixtac de Cabrera are equipped to host 4.4 guests.
Tlalixtac de Cabrera Airbnb Booking Patterns (2026): Available vs. Booked Days
Available Days Distribution
Booked Days Distribution
Booking Pattern Insights for Tlalixtac de Cabrera
- The most common availability pattern in Tlalixtac de Cabrera falls within the 271-366 days range, representing 78.4% of listings. This suggests many properties have significant open periods on their calendars.
- Approximately 97.3% of listings show high availability (181+ days open annually), indicating potential for increased bookings or specific owner usage patterns.
- For booked days, the 31-90 days range is most frequent in Tlalixtac de Cabrera (43.2%), reflecting common guest stay durations or potential owner blocking patterns.
- A notable 5.4% of properties secure long booking periods (181+ days booked per year), highlighting successful long-term rental strategies or significant owner usage.
Tlalixtac de Cabrera Airbnb Minimum Stay Requirements Analysis
Distribution of Listings by Minimum Night Requirement
1 Night
12 listings
32.4% of total
2 Nights
14 listings
37.8% of total
3 Nights
1 listings
2.7% of total
4-6 Nights
1 listings
2.7% of total
30+ Nights
9 listings
24.3% of total
Key Insights
- The most prevalent minimum stay requirement in Tlalixtac de Cabrera is 2 Nights, adopted by 37.8% of listings. This highlights the market's preference for shorter, flexible bookings.
- A strong majority (70.2%) of the Tlalixtac de Cabrera Airbnb data shows acceptance of very short stays (1-2 nights), indicating a dynamic, high-turnover market.
- A significant segment (24.3%) caters to monthly stays (30+ nights) in Tlalixtac de Cabrera, pointing to opportunities in the extended-stay market.
Recommendations
- Align with the market by considering a 2 Nights minimum stay, as 37.8% of Tlalixtac de Cabrera hosts use this setting.
- Explore offering discounts for stays of 30+ nights to attract the 24.3% of the market seeking extended stays.
- Adjust minimum nights based on seasonality – potentially shorter during low season and longer during peak demand periods in Tlalixtac de Cabrera.
Tlalixtac de Cabrera Airbnb Cancellation Policy Trends Analysis (2026)
Flexible
18 listings
48.6% of total
Moderate
14 listings
37.8% of total
Firm
5 listings
13.5% of total
Cancellation Policy Insights for Tlalixtac de Cabrera
- The prevailing Airbnb cancellation policy trend in Tlalixtac de Cabrera is Flexible, used by 48.6% of listings.
- The market strongly favors guest-friendly terms, with 86.4% of listings offering Flexible or Moderate policies. This suggests guests in Tlalixtac de Cabrera may expect booking flexibility.
Recommendations for Hosts
- Consider adopting a Flexible policy to align with the 48.6% market standard in Tlalixtac de Cabrera.
- Regularly review your cancellation policy against competitors and market demand shifts in Tlalixtac de Cabrera.
Tlalixtac de Cabrera STR Booking Lead Time Analysis (2026)
Average Booking Lead Time by Month
Booking Lead Time Insights for Tlalixtac de Cabrera
- The overall average booking lead time for vacation rentals in Tlalixtac de Cabrera is 35 days.
- Guests book furthest in advance for stays during October (average 74 days), likely coinciding with peak travel demand or local events.
- The shortest booking windows occur for stays in June (average 15 days), indicating more last-minute travel plans during this time.
- Seasonally, Fall (54 days avg.) sees the longest lead times, while Spring (22 days avg.) has the shortest, reflecting typical travel planning cycles.
Recommendations for Hosts
- Use the overall average lead time (35 days) as a baseline for your pricing and availability strategy in Tlalixtac de Cabrera.
- For October stays, consider implementing length-of-stay discounts or slightly higher rates for bookings made less than 74 days out to capitalize on advance planning.
- Target marketing efforts for the Fall season well in advance (at least 54 days) to capture early planners.
- Monitor your own booking lead times against these Tlalixtac de Cabrera averages to identify opportunities for dynamic pricing adjustments.
Popular & Essential Airbnb Amenities in Tlalixtac de Cabrera (2026)
Amenity Prevalence
Amenity Insights for Tlalixtac de Cabrera
- Essential amenities in Tlalixtac de Cabrera that guests expect include: Wifi, Free parking on premises. Lacking these (any) could significantly impact bookings.
- Popular amenities like Kitchen, Dishes and silverware, Coffee maker are common but not universal. Offering these can provide a competitive edge.
Recommendations for Hosts
- Ensure your listing includes all essential amenities for Tlalixtac de Cabrera: Wifi, Free parking on premises.
- Consider adding popular differentiators like Kitchen or Dishes and silverware to increase appeal.
- Highlight unique or less common amenities you offer (e.g., hot tub, dedicated workspace, EV charger) in your listing description and photos.
- Regularly check competitor amenities in Tlalixtac de Cabrera to stay competitive.
Tlalixtac de Cabrera Airbnb Guest Demographics & Profile Analysis (2026)
Guest Profile Summary for Tlalixtac de Cabrera
- The typical guest profile for Airbnb in Tlalixtac de Cabrera consists of a mix of domestic (48%) and international guests, with top international origins including United States, typically belonging to the Post-2000s (Gen Z/Alpha) group (50%), primarily speaking English or Spanish.
- Domestic travelers account for 48.2% of guests.
- Key international markets include Mexico (48.2%) and United States (28.9%).
- Top languages spoken are English (36%) followed by Spanish (35.3%).
- A significant demographic segment is the Post-2000s (Gen Z/Alpha) group, representing 50% of guests.
Recommendations for Hosts
- Balance marketing efforts between domestic and international channels based on the guest mix.
- Tailor amenities and listing descriptions to appeal to the dominant Post-2000s (Gen Z/Alpha) demographic (e.g., highlight fast WiFi, smart home features, local guides).
- Highlight unique local experiences or amenities relevant to the primary guest profile.
- Consider seasonal promotions aligned with peak travel times for key origin markets.
Nearby Short-Term Rental Market Comparison
How does the Tlalixtac de Cabrera Airbnb market stack up against its neighbors? Compare key performance metrics like average monthly revenue, ADR, and occupancy rates in surrounding areas to understand the broader regional STR landscape.
| Market | Active Properties | Monthly Revenue | Daily Rate | Avg. Occupancy |
|---|---|---|---|---|
| Oaxaca City | 3,294 | $889 | $99.01 | 34% |
| Oaxaca | 409 | $862 | $118.03 | 32% |
| San Agustín Yatareni | 13 | $707 | $165.56 | 25% |
| San Francisco Tutla | 19 | $697 | $97.65 | 22% |
| San José del Pacífico | 80 | $627 | $100.69 | 25% |
| San Andrés Huayapam | 25 | $516 | $89.10 | 27% |
| San Sebastián Tutla | 17 | $465 | $127.37 | 21% |
| Santa Cruz Etla | 28 | $459 | $116.67 | 20% |
| San Francisco Lachigoló | 18 | $458 | $93.09 | 21% |
| San Lorenzo Cacaotepec | 10 | $455 | $180.25 | 17% |