San Pablo Villa de Mitla Airbnb Market Analysis 2026: Short Term Rental Data & Vacation Rental Statistics in Oaxaca, Mexico
Is Airbnb profitable in San Pablo Villa de Mitla in 2026? Explore comprehensive Airbnb analytics for San Pablo Villa de Mitla, Oaxaca, Mexico to uncover income potential. This 2026 STR market report for San Pablo Villa de Mitla, based on AirROI data from February 2025 to January 2026, reveals key trends in the niche market of 23 active listings.
Whether you're considering an Airbnb investment in San Pablo Villa de Mitla, optimizing your existing vacation rental, or exploring rental arbitrage opportunities, understanding the San Pablo Villa de Mitla Airbnb data is crucial. Leveraging the low regulation environment is key to maximizing your short term rental income potential. Let's dive into the specifics.
Key San Pablo Villa de Mitla Airbnb Performance Metrics Overview
Monthly Airbnb Revenue Variations & Income Potential in San Pablo Villa de Mitla (2026)
Understanding the monthly revenue variations for Airbnb listings in San Pablo Villa de Mitla is key to maximizing your short term rental income potential. Seasonality significantly impacts earnings. Our analysis, based on data from the past 12 months, shows that the peak revenue month for STRs in San Pablo Villa de Mitla is typically November, while August often presents the lowest earnings, highlighting opportunities for strategic pricing adjustments during shoulder and low seasons. Explore the typical Airbnb income in San Pablo Villa de Mitla across different performance tiers:
- Best-in-class properties (Top 10%) achieve $505+ monthly, often utilizing dynamic pricing and superior guest experiences.
- Strong performing properties (Top 25%) earn $307 or more, indicating effective management and desirable locations/amenities.
- Typical properties (Median) generate around $166 per month, representing the average market performance.
- Entry-level properties (Bottom 25%) see earnings around $86, often with potential for optimization.
Average Monthly Airbnb Earnings Trend in San Pablo Villa de Mitla
San Pablo Villa de Mitla Airbnb Occupancy Rate Trends (2026)
Maximize your bookings by understanding the San Pablo Villa de Mitla STR occupancy trends. Seasonal demand shifts significantly influence how often properties are booked. Typically, Maysees the highest demand (peak season occupancy), while June experiences the lowest (low season). Effective strategies, like adjusting minimum stays or offering promotions, can boost occupancy during slower periods. Here's how different property tiers perform in San Pablo Villa de Mitla:
- Best-in-class properties (Top 10%) achieve 22%+ occupancy, indicating high desirability and potentially optimized availability.
- Strong performing properties (Top 25%) maintain 15% or higher occupancy, suggesting good market fit and guest satisfaction.
- Typical properties (Median) have an occupancy rate around 8%.
- Entry-level properties (Bottom 25%) average 4% occupancy, potentially facing higher vacancy.
Average Monthly Occupancy Rate Trend in San Pablo Villa de Mitla
Average Daily Rate (ADR) Airbnb Trends in San Pablo Villa de Mitla (2026)
Effective short term rental pricing strategy in San Pablo Villa de Mitla involves understanding monthly ADR fluctuations. The Average Daily Rate (ADR) for Airbnb in San Pablo Villa de Mitla typically peaks in November and dips lowest during April. Leveraging Airbnb dynamic pricing tools or strategies based on this seasonality can significantly boost revenue. Here's a look at the typical nightly rates achieved:
- Best-in-class properties (Top 10%) command rates of $186+ per night, often due to premium features or locations.
- Strong performing properties (Top 25%) achieve nightly rates of $166 or more.
- Typical properties (Median) charge around $47 per night.
- Entry-level properties (Bottom 25%) earn around $31 per night.
Average Daily Rate (ADR) Trend by Month in San Pablo Villa de Mitla
Get Live San Pablo Villa de Mitla Market Intelligence 👇

Explore Real-time Analytics
Airbnb Seasonality Analysis & Trends in San Pablo Villa de Mitla (2026)
Peak Season (November, October, February)
- Revenue averages $324 per month
- Occupancy rates average 11.9%
- Daily rates average $92
Shoulder Season
- Revenue averages $231 per month
- Occupancy maintains around 10.5%
- Daily rates hold near $88
Low Season (January, May, August)
- Revenue drops to average $147 per month
- Occupancy decreases to average 13.1%
- Daily rates adjust to average $89
Seasonality Insights for San Pablo Villa de Mitla
- The Airbnb seasonality in San Pablo Villa de Mitla shows highly seasonal trends requiring careful strategy. While the sections above show seasonal averages, it's also insightful to look at the extremes:
- During the high season, the absolute peak month showcases San Pablo Villa de Mitla's highest earning potential, with monthly revenues capable of climbing to $344, occupancy reaching a high of 19.4%, and ADRs peaking at $96.
- Conversely, the slowest single month of the year, typically falling within the low season, marks the market's lowest point. In this month, revenue might dip to $134, occupancy could drop to 7.7%, and ADRs may adjust down to $83.
- Understanding both the seasonal averages and these monthly peaks and troughs in revenue, occupancy, and ADR is crucial for maximizing your Airbnb profit potential in San Pablo Villa de Mitla.
Seasonal Strategies for Maximizing Profit
- Peak Season: Maximize revenue through premium pricing and potentially longer minimum stays. Ensure high availability.
- Low Season: Offer competitive pricing, special promotions (e.g., extended stay discounts), and flexible cancellation policies. Target off-season travelers like remote workers or budget-conscious guests.
- Shoulder Seasons: Implement dynamic pricing that balances peak and low rates. Target weekend travelers or specific events. Offer slightly more flexible terms than peak season.
- Regularly analyze your own performance against these San Pablo Villa de Mitla seasonality benchmarks and adjust your pricing and availability strategy accordingly.
Best Areas for Airbnb Investment in San Pablo Villa de Mitla (2026)
Exploring the top neighborhoods for short-term rentals in San Pablo Villa de Mitla? This section highlights key areas, outlining why they are attractive for hosts and guests, along with notable local attractions. Consider these locations based on your target guest profile and investment strategy.
| Neighborhood / Area | Why Host Here? (Target Guests & Appeal) | Key Attractions & Landmarks |
|---|---|---|
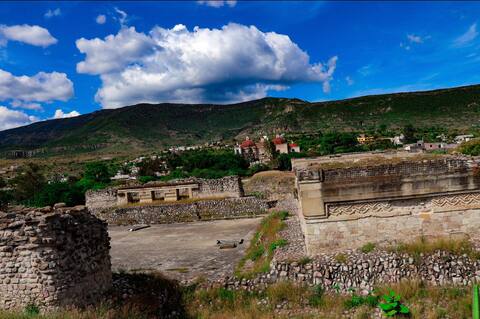
| Mitla Archaeological Zone | A UNESCO World Heritage Site showcasing stunning Zapotec ruins and architecture, attracting history enthusiasts and cultural tourists. | Mitla Ruins, Archaeological Museum, Church of San Pablo, Traditional Weaving Workshops |
| Local Markets | Vibrant markets offering local crafts, foods, and cultural experiences, appealing to travelers wanting to immerse themselves in local culture. | Mitla Market, Crafts Market, Food Stalls |
| Nature Trails and Surroundings | Beautiful natural landscapes surrounding Mitla ideal for hiking and nature exploration, great for eco-tourism. | Cerro Verde, Natural Parks, Hiking Trails |
| Nearby Villages | Charming nearby villages with local traditions and artisan crafts, perfect for tourists wanting to explore authentic Oaxaca culture. | Teotitlán del Valle, San Bartolomé Quialana, Local Artisan Workshops |
| Culinary Experiences | A food lover's paradise, known for traditional Oaxacan cuisine, cooking classes, and local tastings, attracting culinary tourists. | Traditional Mezcal Tastings, Oaxacan Cooking Classes, Local Restaurants |
| Festivals and Events | Known for vibrant festivals such as the Guelaguetza, which brings in many tourists each year, creating demand for short-term rentals. | Guelaguetza Festival, Day of the Dead Celebrations, Local Cultural Events |
| Cultural Tours | Tours available for visitors interested in exploring the rich culture, traditions, and history of the region, appealing to educational tourists. | Guided Cultural Tours, Historical Sites |
| Artisan Communities | Famous for its artisan crafts, particularly textiles and pottery, attracting tourists who appreciate handmade goods and art. | Textile Workshops, Pottery Studios, Artisan Markets |
Understanding Airbnb License Requirements & STR Laws in San Pablo Villa de Mitla (2026)
While San Pablo Villa de Mitla, Oaxaca, Mexico currently shows low STR regulations, specific Airbnb license requirements might still exist or change. Always verify the latest short term rental regulations and Airbnb license requirements directly with local government authorities for San Pablo Villa de Mitla to ensure full compliance before hosting.
(Source: AirROI data, 2026, finding no licensed listings among those analyzed)
Top Performing Airbnb Properties in San Pablo Villa de Mitla (2026)
Benchmark your potential! Explore examples of top-performing Airbnb properties in San Pablo Villa de Mitlabased on Trailing Twelve Month (TTM) revenue. Analyze their characteristics, revenue, occupancy rate, and ADR to understand what drives success in this market.
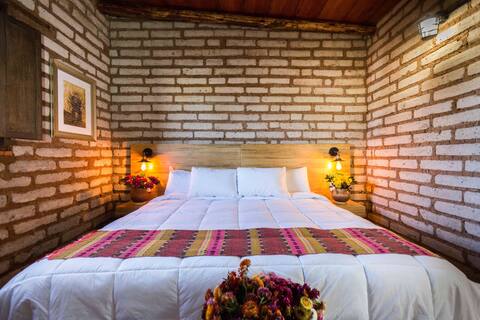
Discover the magic at Casa AIDA.
Entire Place • 4 bedrooms
Casa Aida
Entire Place • 3 bedrooms
Arroqueño Suite/Hotel Casa Regina
Private Room • 1 bedroom
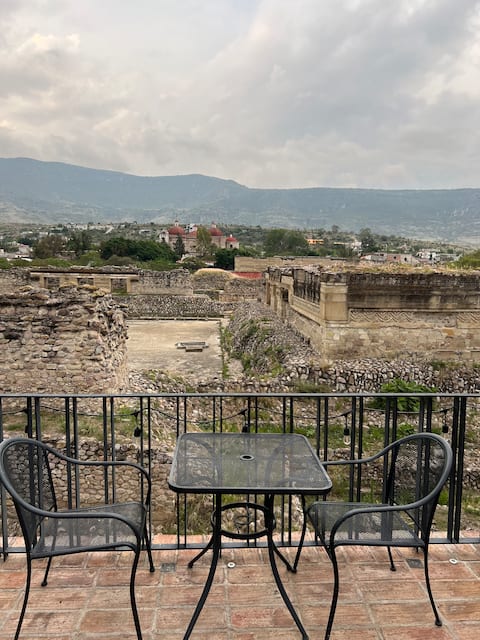
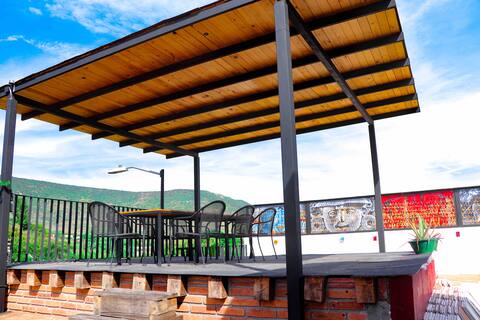
The best view in Mitla
Entire Place • 3 bedrooms
Espadín Suite/Hotel Casa Regina
Private Room • 8 bedrooms

Master Suite Tobalá/ Hotel Casa Regina
Private Room • N/A
Note: Performance varies based on location, size, amenities, seasonality, and management quality. Data reflects the past 12 months.
Top Performing Airbnb Hosts in San Pablo Villa de Mitla (2026)
Learn from the best! This table showcases top-performing Airbnb hosts in San Pablo Villa de Mitla based on the number of properties managed and estimated total revenue over the past year. Analyze their scale and performance metrics.
| Host Name | Properties | Grossing Revenue | Stay Reviews | Avg Rating |
|---|---|---|---|---|
| Monserrat Alejandra | 8 | $12,420 | 109 | 4.73/5.0 |
| Fernando | 2 | $7,928 | 23 | 4.83/5.0 |
| Angela Paola | 4 | $4,433 | 29 | 4.75/5.0 |
| Jaciel | 1 | $3,171 | 9 | 4.56/5.0 |
| Sel Ramirez | 2 | $2,914 | 64 | 4.64/5.0 |
| Doña Mimí | 2 | $1,775 | 348 | 4.67/5.0 |
| Brooke | 2 | $1,125 | 7 | 4.80/5.0 |
| Carmen | 1 | $308 | 26 | 4.69/5.0 |
| Lilybeth | 1 | $111 | 8 | 4.75/5.0 |
Analyzing the strategies of top hosts, such as their property selection, pricing, and guest communication, can offer valuable lessons for optimizing your own Airbnb operations in San Pablo Villa de Mitla.
Dive Deeper: Advanced San Pablo Villa de Mitla STR Market Data (2026)
Ready to unlock more insights? AirROI provides access to advanced metrics and comprehensive Airbnb data for San Pablo Villa de Mitla. Explore detailed analytics beyond this report to refine your investment strategy, optimize pricing, and maximize your vacation rental profits.
Explore Advanced MetricsSan Pablo Villa de Mitla Short-Term Rental Market Composition (2026): Property & Room Types
Room Type Distribution
Property Type Distribution
Market Composition Insights for San Pablo Villa de Mitla
- The San Pablo Villa de Mitla Airbnb market composition is heavily skewed towards Private Room listings, which make up 73.9% of the 23 active rentals. This indicates strong guest preference for privacy and space.
- Looking at the property type distribution in San Pablo Villa de Mitla, House properties are the most common (60.9%), reflecting the local real estate landscape.
- Houses represent a significant 60.9% portion, catering likely to families or larger groups.
- The presence of 34.8% Hotel/Boutique listings indicates integration with traditional hospitality.
- Smaller segments like apartment/condo (combined 4.3%) offer potential for unique stay experiences.
San Pablo Villa de Mitla Airbnb Room Capacity Analysis (2026): Bedroom Distribution
Distribution of Listings by Number of Bedrooms
Room Capacity Insights for San Pablo Villa de Mitla
- The dominant room capacity in San Pablo Villa de Mitla is 1 bedroom listings, making up 34.8% of the market. This suggests a strong demand for properties suitable for couples or solo travelers.
- Together, 1 bedroom and 3 bedrooms properties represent 43.5% of the active Airbnb listings in San Pablo Villa de Mitla, indicating a high concentration in these sizes.
San Pablo Villa de Mitla Vacation Rental Guest Capacity Trends (2026)
Distribution of Listings by Guest Capacity
Guest Capacity Insights for San Pablo Villa de Mitla
- The most common guest capacity trend in San Pablo Villa de Mitla vacation rentals is listings accommodating 4 guests (17.4%). This suggests the primary traveler segment is likely small families or groups.
- Properties designed for 4 guests and 2 guests dominate the San Pablo Villa de Mitla STR market, accounting for 34.8% of listings.
- Listings for large groups (6+ guests) are relatively rare (4.3%), potentially indicating an opportunity for hosts targeting this segment in San Pablo Villa de Mitla.
- On average, properties in San Pablo Villa de Mitla are equipped to host 2.0 guests.
San Pablo Villa de Mitla Airbnb Booking Patterns (2026): Available vs. Booked Days
Available Days Distribution
Booked Days Distribution
Booking Pattern Insights for San Pablo Villa de Mitla
- The most common availability pattern in San Pablo Villa de Mitla falls within the 271-366 days range, representing 100% of listings. This suggests many properties have significant open periods on their calendars.
- Approximately 100.0% of listings show high availability (181+ days open annually), indicating potential for increased bookings or specific owner usage patterns.
- For booked days, the 1-30 days range is most frequent in San Pablo Villa de Mitla (82.6%), reflecting common guest stay durations or potential owner blocking patterns.
San Pablo Villa de Mitla Airbnb Minimum Stay Requirements Analysis
Distribution of Listings by Minimum Night Requirement
1 Night
23 listings
100% of total
Key Insights
- The most prevalent minimum stay requirement in San Pablo Villa de Mitla is 1 Night, adopted by 100% of listings. This highlights the market's preference for shorter, flexible bookings.
- A strong majority (100.0%) of the San Pablo Villa de Mitla Airbnb data shows acceptance of very short stays (1-2 nights), indicating a dynamic, high-turnover market.
Recommendations
- Align with the market by considering a 1 Night minimum stay, as 100% of San Pablo Villa de Mitla hosts use this setting.
- Adjust minimum nights based on seasonality – potentially shorter during low season and longer during peak demand periods in San Pablo Villa de Mitla.
San Pablo Villa de Mitla Airbnb Cancellation Policy Trends Analysis (2026)
Flexible
17 listings
73.9% of total
Moderate
3 listings
13% of total
Strict
3 listings
13% of total
Cancellation Policy Insights for San Pablo Villa de Mitla
- The prevailing Airbnb cancellation policy trend in San Pablo Villa de Mitla is Flexible, used by 73.9% of listings.
- The market strongly favors guest-friendly terms, with 86.9% of listings offering Flexible or Moderate policies. This suggests guests in San Pablo Villa de Mitla may expect booking flexibility.
Recommendations for Hosts
- Consider adopting a Flexible policy to align with the 73.9% market standard in San Pablo Villa de Mitla.
- Given the high prevalence of Flexible policies (73.9%), offering this can enhance booking appeal, especially during shoulder seasons.
- Using a Strict policy might deter some guests, as only 13% of listings use it. Evaluate if potential revenue protection outweighs possible lower booking rates.
- Regularly review your cancellation policy against competitors and market demand shifts in San Pablo Villa de Mitla.
San Pablo Villa de Mitla STR Booking Lead Time Analysis (2026)
Average Booking Lead Time by Month
Booking Lead Time Insights for San Pablo Villa de Mitla
- The overall average booking lead time for vacation rentals in San Pablo Villa de Mitla is 61 days.
- Guests book furthest in advance for stays during November (average 140 days), likely coinciding with peak travel demand or local events.
- The shortest booking windows occur for stays in May (average 13 days), indicating more last-minute travel plans during this time.
- Seasonally, Fall (84 days avg.) sees the longest lead times, while Winter (21 days avg.) has the shortest, reflecting typical travel planning cycles.
Recommendations for Hosts
- Use the overall average lead time (61 days) as a baseline for your pricing and availability strategy in San Pablo Villa de Mitla.
- For November stays, consider implementing length-of-stay discounts or slightly higher rates for bookings made less than 140 days out to capitalize on advance planning.
- During May, focus on last-minute booking availability and promotions, as guests book with very short notice (13 days avg.).
- Target marketing efforts for the Fall season well in advance (at least 84 days) to capture early planners.
- Monitor your own booking lead times against these San Pablo Villa de Mitla averages to identify opportunities for dynamic pricing adjustments.
Popular & Essential Airbnb Amenities in San Pablo Villa de Mitla (2026)
Amenity Prevalence
Amenity Insights for San Pablo Villa de Mitla
- Essential amenities in San Pablo Villa de Mitla that guests expect include: Wifi. Lacking these (this) could significantly impact bookings.
- Popular amenities like Hot water, First aid kit, TV are common but not universal. Offering these can provide a competitive edge.
Recommendations for Hosts
- Ensure your listing includes all essential amenities for San Pablo Villa de Mitla: Wifi.
- Consider adding popular differentiators like Hot water or First aid kit to increase appeal.
- Highlight unique or less common amenities you offer (e.g., hot tub, dedicated workspace, EV charger) in your listing description and photos.
- Regularly check competitor amenities in San Pablo Villa de Mitla to stay competitive.
San Pablo Villa de Mitla Airbnb Guest Demographics & Profile Analysis (2026)
Guest Profile Summary for San Pablo Villa de Mitla
- The typical guest profile for Airbnb in San Pablo Villa de Mitla consists of a mix of domestic (59%) and international guests, often arriving from nearby Mexico City, typically belonging to the Post-2000s (Gen Z/Alpha) group (50%), primarily speaking Spanish or English.
- Domestic travelers account for 59.0% of guests.
- Key international markets include Mexico (59%) and United States (12.8%).
- Top languages spoken are Spanish (37.8%) followed by English (35.1%).
- A significant demographic segment is the Post-2000s (Gen Z/Alpha) group, representing 50% of guests.
Recommendations for Hosts
- Balance marketing efforts between domestic and international channels based on the guest mix.
- Tailor amenities and listing descriptions to appeal to the dominant Post-2000s (Gen Z/Alpha) demographic (e.g., highlight fast WiFi, smart home features, local guides).
- Highlight unique local experiences or amenities relevant to the primary guest profile.
- Consider seasonal promotions aligned with peak travel times for key origin markets.
Nearby Short-Term Rental Market Comparison
How does the San Pablo Villa de Mitla Airbnb market stack up against its neighbors? Compare key performance metrics like average monthly revenue, ADR, and occupancy rates in surrounding areas to understand the broader regional STR landscape.
| Market | Active Properties | Monthly Revenue | Daily Rate | Avg. Occupancy |
|---|---|---|---|---|
| Huatulco | 10 | $2,925 | $306.55 | 41% |
| Bahía de Conejos | 53 | $2,343 | $360.20 | 33% |
| El Puertecito | 10 | $1,781 | $310.46 | 26% |
| Salchi | 28 | $1,752 | $223.03 | 31% |
| Crucecita | 37 | $1,740 | $240.44 | 34% |
| Bahías de Huatulco | 49 | $1,644 | $211.88 | 40% |
| Brisas de Zicatela | 1,652 | $1,462 | $139.14 | 40% |
| Santa María Colotepec | 40 | $1,413 | $235.74 | 24% |
| Bajos de Chila | 32 | $1,370 | $232.84 | 23% |
| Puerto Escondido | 1,061 | $1,292 | $146.13 | 37% |