Puerto Ángel Airbnb Market Analysis 2026: Short Term Rental Data & Vacation Rental Statistics in Oaxaca, Mexico
Is Airbnb profitable in Puerto Ángel in 2026? Explore comprehensive Airbnb analytics for Puerto Ángel, Oaxaca, Mexico to uncover income potential. This 2026 STR market report for Puerto Ángel, based on AirROI data from February 2025 to January 2026, reveals key trends in the niche market of 162 active listings.
Whether you're considering an Airbnb investment in Puerto Ángel, optimizing your existing vacation rental, or exploring rental arbitrage opportunities, understanding the Puerto Ángel Airbnb data is crucial. Leveraging the low regulation environment is key to maximizing your short term rental income potential. Let's dive into the specifics.
Key Puerto Ángel Airbnb Performance Metrics Overview
Monthly Airbnb Revenue Variations & Income Potential in Puerto Ángel (2026)
Understanding the monthly revenue variations for Airbnb listings in Puerto Ángel is key to maximizing your short term rental income potential. Seasonality significantly impacts earnings. Our analysis, based on data from the past 12 months, shows that the peak revenue month for STRs in Puerto Ángel is typically March, while September often presents the lowest earnings, highlighting opportunities for strategic pricing adjustments during shoulder and low seasons. Explore the typical Airbnb income in Puerto Ángel across different performance tiers:
- Best-in-class properties (Top 10%) achieve $3,574+ monthly, often utilizing dynamic pricing and superior guest experiences.
- Strong performing properties (Top 25%) earn $1,787 or more, indicating effective management and desirable locations/amenities.
- Typical properties (Median) generate around $812 per month, representing the average market performance.
- Entry-level properties (Bottom 25%) see earnings around $346, often with potential for optimization.
Average Monthly Airbnb Earnings Trend in Puerto Ángel
Puerto Ángel Airbnb Occupancy Rate Trends (2026)
Maximize your bookings by understanding the Puerto Ángel STR occupancy trends. Seasonal demand shifts significantly influence how often properties are booked. Typically, Februarysees the highest demand (peak season occupancy), while September experiences the lowest (low season). Effective strategies, like adjusting minimum stays or offering promotions, can boost occupancy during slower periods. Here's how different property tiers perform in Puerto Ángel:
- Best-in-class properties (Top 10%) achieve 66%+ occupancy, indicating high desirability and potentially optimized availability.
- Strong performing properties (Top 25%) maintain 46% or higher occupancy, suggesting good market fit and guest satisfaction.
- Typical properties (Median) have an occupancy rate around 26%.
- Entry-level properties (Bottom 25%) average 13% occupancy, potentially facing higher vacancy.
Average Monthly Occupancy Rate Trend in Puerto Ángel
Average Daily Rate (ADR) Airbnb Trends in Puerto Ángel (2026)
Effective short term rental pricing strategy in Puerto Ángel involves understanding monthly ADR fluctuations. The Average Daily Rate (ADR) for Airbnb in Puerto Ángel typically peaks in January and dips lowest during August. Leveraging Airbnb dynamic pricing tools or strategies based on this seasonality can significantly boost revenue. Here's a look at the typical nightly rates achieved:
- Best-in-class properties (Top 10%) command rates of $259+ per night, often due to premium features or locations.
- Strong performing properties (Top 25%) achieve nightly rates of $149 or more.
- Typical properties (Median) charge around $96 per night.
- Entry-level properties (Bottom 25%) earn around $66 per night.
Average Daily Rate (ADR) Trend by Month in Puerto Ángel
Get Live Puerto Ángel Market Intelligence 👇

Explore Real-time Analytics
Airbnb Seasonality Analysis & Trends in Puerto Ángel (2026)
Peak Season (March, February, July)
- Revenue averages $1,953 per month
- Occupancy rates average 39.0%
- Daily rates average $132
Shoulder Season
- Revenue averages $1,576 per month
- Occupancy maintains around 32.3%
- Daily rates hold near $137
Low Season (June, September, October)
- Revenue drops to average $996 per month
- Occupancy decreases to average 21.3%
- Daily rates adjust to average $132
Seasonality Insights for Puerto Ángel
- The Airbnb seasonality in Puerto Ángel shows highly seasonal trends requiring careful strategy. While the sections above show seasonal averages, it's also insightful to look at the extremes:
- During the high season, the absolute peak month showcases Puerto Ángel's highest earning potential, with monthly revenues capable of climbing to $2,123, occupancy reaching a high of 45.5%, and ADRs peaking at $147.
- Conversely, the slowest single month of the year, typically falling within the low season, marks the market's lowest point. In this month, revenue might dip to $770, occupancy could drop to 19.0%, and ADRs may adjust down to $128.
- Understanding both the seasonal averages and these monthly peaks and troughs in revenue, occupancy, and ADR is crucial for maximizing your Airbnb profit potential in Puerto Ángel.
Seasonal Strategies for Maximizing Profit
- Peak Season: Maximize revenue through premium pricing and potentially longer minimum stays. Ensure high availability.
- Low Season: Offer competitive pricing, special promotions (e.g., extended stay discounts), and flexible cancellation policies. Target off-season travelers like remote workers or budget-conscious guests.
- Shoulder Seasons: Implement dynamic pricing that balances peak and low rates. Target weekend travelers or specific events. Offer slightly more flexible terms than peak season.
- Regularly analyze your own performance against these Puerto Ángel seasonality benchmarks and adjust your pricing and availability strategy accordingly.
Best Areas for Airbnb Investment in Puerto Ángel (2026)
Exploring the top neighborhoods for short-term rentals in Puerto Ángel? This section highlights key areas, outlining why they are attractive for hosts and guests, along with notable local attractions. Consider these locations based on your target guest profile and investment strategy.
| Neighborhood / Area | Why Host Here? (Target Guests & Appeal) | Key Attractions & Landmarks |
|---|---|---|
| Puerto Ángel Beach | A stunning beach known for its clear waters and beautiful scenery, making it perfect for tourists looking for relaxation and water activities. | Puerto Ángel Beach, Snorkeling and diving areas, Fresh seafood restaurants, Local artisan shops, Fishing tours |
| Zipolite | Famous for its bohemian vibe and clothing-optional beach, Zipolite attracts a diverse crowd including backpackers and alternative travelers. | Zipolite Beach, La Finca, Yoga retreats, Cultural festivals, Local markets |
| Mazunte | Known for its laid-back atmosphere and eco-tourism, Mazunte is ideal for travelers interested in nature and sustainability. | National Mexican Sea Turtle Center, Mazunte Beach, Vendors and artisanal shops, Nature trails, Yoga and wellness centers |
| San Agustinillo | A serene beach destination that caters to families and couples looking for tranquility away from large crowds. | San Agustinillo Beach, Restaurants with ocean views, Coastal hikes, Kayaking opportunities, Local craft shops |
| Pochutla | A small town that serves as a gateway to the Oaxacan coast, it's convenient for travelers looking to explore the surrounding areas. | Local markets, Cultural events, Nearby beaches, Transportation hubs, Oaxacan cuisine |
| San Pedro Huamelula | Rich in culture and tradition, this area offers visitors a glimpse into local life and various cultural festivities. | Cultural festivals, Traditional cuisine, Local handcrafts, Nearby natural attractions, Community events |
| La Ventanilla | A unique ecological location known for its mangroves and wildlife, perfect for eco-tourism and nature lovers. | Ecological reserve, Bird watching, Kayaking in mangroves, Wildlife tours, Cultural interactions with locals |
| Chacahua | Famous for its lagoon and surfing opportunities, Chacahua attracts adventure seekers and nature lovers alike. | Chacahua National Park, Surfing spots, Lagoon tours, Wildlife observation, Cultural experiences with local fishermen |
Understanding Airbnb License Requirements & STR Laws in Puerto Ángel (2026)
While Puerto Ángel, Oaxaca, Mexico currently shows low STR regulations, specific Airbnb license requirements might still exist or change. Always verify the latest short term rental regulations and Airbnb license requirements directly with local government authorities for Puerto Ángel to ensure full compliance before hosting.
(Source: AirROI data, 2026, finding no licensed listings among those analyzed)
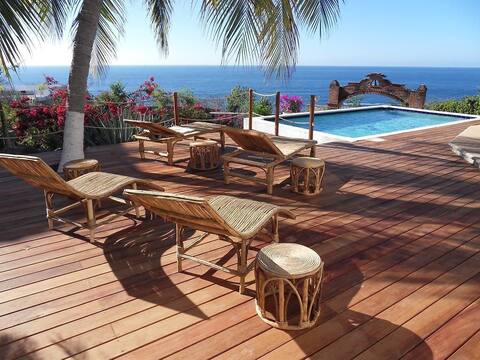
Top Performing Airbnb Properties in Puerto Ángel (2026)
Benchmark your potential! Explore examples of top-performing Airbnb properties in Puerto Ángelbased on Trailing Twelve Month (TTM) revenue. Analyze their characteristics, revenue, occupancy rate, and ADR to understand what drives success in this market.

Coyote | 6BR Ocean View Villa | Love Beach
Entire Place • 6 bedrooms

Exclusive Oceanfront Casa Di Luca, a Luxury Retreat
Entire Place • 2 bedrooms

Palapa Villa - Ocean view house with private pool
Entire Place • 5 bedrooms

LUXURY OCEANFRONT VILLA "LA VITA E' BELLA"
Entire Place • 2 bedrooms

Beautiful villa with infinity pool, Zipolite Beach
Entire Place • 4 bedrooms
Casa Blanca del Faro, incredible view of the Pacific
Entire Place • 4 bedrooms
Note: Performance varies based on location, size, amenities, seasonality, and management quality. Data reflects the past 12 months.
Top Performing Airbnb Hosts in Puerto Ángel (2026)
Learn from the best! This table showcases top-performing Airbnb hosts in Puerto Ángel based on the number of properties managed and estimated total revenue over the past year. Analyze their scale and performance metrics.
| Host Name | Properties | Grossing Revenue | Stay Reviews | Avg Rating |
|---|---|---|---|---|
| Sonia | 4 | $221,627 | 51 | 4.99/5.0 |
| Alejandro | 5 | $202,444 | 200 | 5.00/5.0 |
| Edgar | 5 | $158,264 | 819 | 4.93/5.0 |
| Marilú Sui | 2 | $137,262 | 137 | 4.96/5.0 |
| Erika | 1 | $60,858 | 38 | 4.71/5.0 |
| Ana Laura | 1 | $60,298 | 39 | 4.90/5.0 |
| Luis & Felicia | 7 | $58,180 | 397 | 4.86/5.0 |
| Alejandro | 3 | $55,943 | 29 | 4.77/5.0 |
| Vicente | 4 | $52,734 | 13 | 4.75/5.0 |
| Reto | 3 | $50,093 | 89 | 4.88/5.0 |
Analyzing the strategies of top hosts, such as their property selection, pricing, and guest communication, can offer valuable lessons for optimizing your own Airbnb operations in Puerto Ángel.
Dive Deeper: Advanced Puerto Ángel STR Market Data (2026)
Ready to unlock more insights? AirROI provides access to advanced metrics and comprehensive Airbnb data for Puerto Ángel. Explore detailed analytics beyond this report to refine your investment strategy, optimize pricing, and maximize your vacation rental profits.
Explore Advanced MetricsPuerto Ángel Short-Term Rental Market Composition (2026): Property & Room Types
Room Type Distribution
Property Type Distribution
Market Composition Insights for Puerto Ángel
- The Puerto Ángel Airbnb market composition is heavily skewed towards Entire Home/Apt listings, which make up 58.6% of the 162 active rentals. This indicates strong guest preference for privacy and space.
- However, a notable 40.7% share for Private Rooms suggests opportunities for budget-conscious travelers or hosts renting out spare rooms.
- Looking at the property type distribution in Puerto Ángel, House properties are the most common (45.1%), reflecting the local real estate landscape.
- Houses represent a significant 45.1% portion, catering likely to families or larger groups.
- The presence of 19.1% Hotel/Boutique listings indicates integration with traditional hospitality.
- Smaller segments like outdoor/unique, others (combined 8.0%) offer potential for unique stay experiences.
Puerto Ángel Airbnb Room Capacity Analysis (2026): Bedroom Distribution
Distribution of Listings by Number of Bedrooms
Room Capacity Insights for Puerto Ángel
- The dominant room capacity in Puerto Ángel is 1 bedroom listings, making up 40.7% of the market. This suggests a strong demand for properties suitable for couples or solo travelers.
- Together, 1 bedroom and 2 bedrooms properties represent 62.3% of the active Airbnb listings in Puerto Ángel, indicating a high concentration in these sizes.
Puerto Ángel Vacation Rental Guest Capacity Trends (2026)
Distribution of Listings by Guest Capacity
Guest Capacity Insights for Puerto Ángel
- The most common guest capacity trend in Puerto Ángel vacation rentals is listings accommodating 2 guests (27.8%). This suggests the primary traveler segment is likely couples or solo travelers.
- Properties designed for 2 guests and 4 guests dominate the Puerto Ángel STR market, accounting for 50.6% of listings.
- 17.9% of properties accommodate 6+ guests, serving the market segment for larger families or group travel in Puerto Ángel.
- On average, properties in Puerto Ángel are equipped to host 3.1 guests.
Puerto Ángel Airbnb Booking Patterns (2026): Available vs. Booked Days
Available Days Distribution
Booked Days Distribution
Booking Pattern Insights for Puerto Ángel
- The most common availability pattern in Puerto Ángel falls within the 271-366 days range, representing 71% of listings. This suggests many properties have significant open periods on their calendars.
- Approximately 91.4% of listings show high availability (181+ days open annually), indicating potential for increased bookings or specific owner usage patterns.
- For booked days, the 31-90 days range is most frequent in Puerto Ángel (40.1%), reflecting common guest stay durations or potential owner blocking patterns.
- A notable 9.2% of properties secure long booking periods (181+ days booked per year), highlighting successful long-term rental strategies or significant owner usage.
Puerto Ángel Airbnb Minimum Stay Requirements Analysis
Distribution of Listings by Minimum Night Requirement
1 Night
56 listings
34.6% of total
2 Nights
53 listings
32.7% of total
3 Nights
17 listings
10.5% of total
4-6 Nights
5 listings
3.1% of total
7-29 Nights
2 listings
1.2% of total
30+ Nights
29 listings
17.9% of total
Key Insights
- The most prevalent minimum stay requirement in Puerto Ángel is 1 Night, adopted by 34.6% of listings. This highlights the market's preference for shorter, flexible bookings.
- A strong majority (67.3%) of the Puerto Ángel Airbnb data shows acceptance of very short stays (1-2 nights), indicating a dynamic, high-turnover market.
- A significant segment (17.9%) caters to monthly stays (30+ nights) in Puerto Ángel, pointing to opportunities in the extended-stay market.
Recommendations
- Align with the market by considering a 1 Night minimum stay, as 34.6% of Puerto Ángel hosts use this setting.
- Explore offering discounts for stays of 30+ nights to attract the 17.9% of the market seeking extended stays.
- Adjust minimum nights based on seasonality – potentially shorter during low season and longer during peak demand periods in Puerto Ángel.
Puerto Ángel Airbnb Cancellation Policy Trends Analysis (2026)
Limited
1 listings
0.6% of total
Flexible
42 listings
26.1% of total
Moderate
31 listings
19.3% of total
Firm
64 listings
39.8% of total
Strict
23 listings
14.3% of total
Cancellation Policy Insights for Puerto Ángel
- The prevailing Airbnb cancellation policy trend in Puerto Ángel is Firm, used by 39.8% of listings.
- A majority (54.1%) of hosts in Puerto Ángel utilize Firm or Strict policies, indicating a market where hosts prioritize booking security.
Recommendations for Hosts
- Consider adopting a Firm policy to align with the 39.8% market standard in Puerto Ángel.
- Using a Strict policy might deter some guests, as only 14.3% of listings use it. Evaluate if potential revenue protection outweighs possible lower booking rates.
- Regularly review your cancellation policy against competitors and market demand shifts in Puerto Ángel.
Puerto Ángel STR Booking Lead Time Analysis (2026)
Average Booking Lead Time by Month
Booking Lead Time Insights for Puerto Ángel
- The overall average booking lead time for vacation rentals in Puerto Ángel is 46 days.
- Guests book furthest in advance for stays during December (average 84 days), likely coinciding with peak travel demand or local events.
- The shortest booking windows occur for stays in September (average 25 days), indicating more last-minute travel plans during this time.
- Seasonally, Winter (69 days avg.) sees the longest lead times, while Summer (32 days avg.) has the shortest, reflecting typical travel planning cycles.
Recommendations for Hosts
- Use the overall average lead time (46 days) as a baseline for your pricing and availability strategy in Puerto Ángel.
- For December stays, consider implementing length-of-stay discounts or slightly higher rates for bookings made less than 84 days out to capitalize on advance planning.
- Target marketing efforts for the Winter season well in advance (at least 69 days) to capture early planners.
- Monitor your own booking lead times against these Puerto Ángel averages to identify opportunities for dynamic pricing adjustments.
Popular & Essential Airbnb Amenities in Puerto Ángel (2026)
Amenity Prevalence
Amenity Insights for Puerto Ángel
- Essential amenities in Puerto Ángel that guests expect include: Wifi. Lacking these (this) could significantly impact bookings.
- Popular amenities like Free parking on premises, Essentials, Kitchen are common but not universal. Offering these can provide a competitive edge.
Recommendations for Hosts
- Ensure your listing includes all essential amenities for Puerto Ángel: Wifi.
- Prioritize adding missing essentials: Wifi.
- Consider adding popular differentiators like Free parking on premises or Essentials to increase appeal.
- Highlight unique or less common amenities you offer (e.g., hot tub, dedicated workspace, EV charger) in your listing description and photos.
- Regularly check competitor amenities in Puerto Ángel to stay competitive.
Puerto Ángel Airbnb Guest Demographics & Profile Analysis (2026)
Guest Profile Summary for Puerto Ángel
- The typical guest profile for Airbnb in Puerto Ángel consists of a mix of domestic (42%) and international guests, with top international origins including United States, typically belonging to the Post-2000s (Gen Z/Alpha) group (50%), primarily speaking English or Spanish.
- Domestic travelers account for 42.4% of guests.
- Key international markets include Mexico (42.4%) and United States (25.6%).
- Top languages spoken are English (43.6%) followed by Spanish (36.2%).
- A significant demographic segment is the Post-2000s (Gen Z/Alpha) group, representing 50% of guests.
Recommendations for Hosts
- Balance marketing efforts between domestic and international channels based on the guest mix.
- Tailor amenities and listing descriptions to appeal to the dominant Post-2000s (Gen Z/Alpha) demographic (e.g., highlight fast WiFi, smart home features, local guides).
- Highlight unique local experiences or amenities relevant to the primary guest profile.
- Consider seasonal promotions aligned with peak travel times for key origin markets.
Nearby Short-Term Rental Market Comparison
How does the Puerto Ángel Airbnb market stack up against its neighbors? Compare key performance metrics like average monthly revenue, ADR, and occupancy rates in surrounding areas to understand the broader regional STR landscape.
| Market | Active Properties | Monthly Revenue | Daily Rate | Avg. Occupancy |
|---|---|---|---|---|
| Huatulco | 10 | $2,925 | $306.55 | 41% |
| Bahía de Conejos | 53 | $2,343 | $360.20 | 33% |
| El Puertecito | 10 | $1,781 | $310.46 | 26% |
| Salchi | 28 | $1,752 | $223.03 | 31% |
| Crucecita | 37 | $1,740 | $240.44 | 34% |
| Bahías de Huatulco | 49 | $1,644 | $211.88 | 40% |
| Brisas de Zicatela | 1,652 | $1,462 | $139.14 | 40% |
| Santa María Colotepec | 40 | $1,413 | $235.74 | 24% |
| Bajos de Chila | 32 | $1,370 | $232.84 | 23% |
| Puerto Escondido | 1,061 | $1,292 | $146.13 | 37% |