La Crucecita Airbnb Market Analysis 2026: Short Term Rental Data & Vacation Rental Statistics in Oaxaca, Mexico
Is Airbnb profitable in La Crucecita in 2026? Explore comprehensive Airbnb analytics for La Crucecita, Oaxaca, Mexico to uncover income potential. This 2026 STR market report for La Crucecita, based on AirROI data from February 2025 to January 2026, reveals key trends in the market of 852 active listings.
Whether you're considering an Airbnb investment in La Crucecita, optimizing your existing vacation rental, or exploring rental arbitrage opportunities, understanding the La Crucecita Airbnb data is crucial. Leveraging the low regulation environment is key to maximizing your short term rental income potential. Let's dive into the specifics.
Key La Crucecita Airbnb Performance Metrics Overview
Monthly Airbnb Revenue Variations & Income Potential in La Crucecita (2026)
Understanding the monthly revenue variations for Airbnb listings in La Crucecita is key to maximizing your short term rental income potential. Seasonality significantly impacts earnings. Our analysis, based on data from the past 12 months, shows that the peak revenue month for STRs in La Crucecita is typically December, while September often presents the lowest earnings, highlighting opportunities for strategic pricing adjustments during shoulder and low seasons. Explore the typical Airbnb income in La Crucecita across different performance tiers:
- Best-in-class properties (Top 10%) achieve $2,941+ monthly, often utilizing dynamic pricing and superior guest experiences.
- Strong performing properties (Top 25%) earn $1,654 or more, indicating effective management and desirable locations/amenities.
- Typical properties (Median) generate around $778 per month, representing the average market performance.
- Entry-level properties (Bottom 25%) see earnings around $341, often with potential for optimization.
Average Monthly Airbnb Earnings Trend in La Crucecita
La Crucecita Airbnb Occupancy Rate Trends (2026)
Maximize your bookings by understanding the La Crucecita STR occupancy trends. Seasonal demand shifts significantly influence how often properties are booked. Typically, Februarysees the highest demand (peak season occupancy), while September experiences the lowest (low season). Effective strategies, like adjusting minimum stays or offering promotions, can boost occupancy during slower periods. Here's how different property tiers perform in La Crucecita:
- Best-in-class properties (Top 10%) achieve 77%+ occupancy, indicating high desirability and potentially optimized availability.
- Strong performing properties (Top 25%) maintain 55% or higher occupancy, suggesting good market fit and guest satisfaction.
- Typical properties (Median) have an occupancy rate around 31%.
- Entry-level properties (Bottom 25%) average 15% occupancy, potentially facing higher vacancy.
Average Monthly Occupancy Rate Trend in La Crucecita
Average Daily Rate (ADR) Airbnb Trends in La Crucecita (2026)
Effective short term rental pricing strategy in La Crucecita involves understanding monthly ADR fluctuations. The Average Daily Rate (ADR) for Airbnb in La Crucecita typically peaks in December and dips lowest during May. Leveraging Airbnb dynamic pricing tools or strategies based on this seasonality can significantly boost revenue. Here's a look at the typical nightly rates achieved:
- Best-in-class properties (Top 10%) command rates of $223+ per night, often due to premium features or locations.
- Strong performing properties (Top 25%) achieve nightly rates of $143 or more.
- Typical properties (Median) charge around $88 per night.
- Entry-level properties (Bottom 25%) earn around $55 per night.
Average Daily Rate (ADR) Trend by Month in La Crucecita
Get Live La Crucecita Market Intelligence 👇

Explore Real-time Analytics
Airbnb Seasonality Analysis & Trends in La Crucecita (2026)
Peak Season (December, January, February)
- Revenue averages $1,620 per month
- Occupancy rates average 41.0%
- Daily rates average $127
Shoulder Season
- Revenue averages $1,283 per month
- Occupancy maintains around 38.0%
- Daily rates hold near $114
Low Season (June, September, October)
- Revenue drops to average $909 per month
- Occupancy decreases to average 29.4%
- Daily rates adjust to average $114
Seasonality Insights for La Crucecita
- The Airbnb seasonality in La Crucecita shows moderate seasonality with distinct peak and low periods. While the sections above show seasonal averages, it's also insightful to look at the extremes:
- During the high season, the absolute peak month showcases La Crucecita's highest earning potential, with monthly revenues capable of climbing to $1,698, occupancy reaching a high of 47.3%, and ADRs peaking at $135.
- Conversely, the slowest single month of the year, typically falling within the low season, marks the market's lowest point. In this month, revenue might dip to $823, occupancy could drop to 27.8%, and ADRs may adjust down to $109.
- Understanding both the seasonal averages and these monthly peaks and troughs in revenue, occupancy, and ADR is crucial for maximizing your Airbnb profit potential in La Crucecita.
Seasonal Strategies for Maximizing Profit
- Peak Season: Maximize revenue through premium pricing and potentially longer minimum stays. Ensure high availability.
- Low Season: Offer competitive pricing, special promotions (e.g., extended stay discounts), and flexible cancellation policies. Target off-season travelers like remote workers or budget-conscious guests.
- Shoulder Seasons: Implement dynamic pricing that balances peak and low rates. Target weekend travelers or specific events. Offer slightly more flexible terms than peak season.
- Regularly analyze your own performance against these La Crucecita seasonality benchmarks and adjust your pricing and availability strategy accordingly.
Best Areas for Airbnb Investment in La Crucecita (2026)
Exploring the top neighborhoods for short-term rentals in La Crucecita? This section highlights key areas, outlining why they are attractive for hosts and guests, along with notable local attractions. Consider these locations based on your target guest profile and investment strategy.
| Neighborhood / Area | Why Host Here? (Target Guests & Appeal) | Key Attractions & Landmarks |
|---|---|---|
| La Crucecita Centro | The vibrant center of La Crucecita, offering a charming town square and easy access to local shops, restaurants, and cultural attractions. It's attractive for those looking to experience authentic local culture and convenience. | Huatulco Bay, La Crucecita Church, local markets, restaurants and cafes |
| Santa Cruz Huatulco | A bustling area close to the beach and marina, popular among tourists for its stunning beaches and seaside activities. Ideal for guests looking for a beach vacation with plenty of water sports. | Santa Cruz Beach, Marina Chahue, Huatulco National Park, Beach clubs, Restaurants along the bay |
| Chahue Bay | A luxury area known for its upscale condos and proximity to the beach, appealing to those who desire a more tranquil and upscale vacation experience. | Chahue Beach, Huatulco Golf Club, Luxury resorts, Spa facilities, Water sports |
| Cacaluta Beach | An untouched and serene beach area favored by nature lovers and those seeking solitude, making it perfect for eco-tourism and relaxation. | Cacaluta Beach, Cacaluta Bay, Scenic hiking trails, Snorkeling spots |
| Stream of the Virgin Zone | A natural paradise known for its lush landscapes and streams, attracting those who want to enjoy nature and eco-tours. Great for outdoor activities and adventure seekers. | Cascadas de la Virgen, Trekking trails, Bird watching, Natural pools |
| Maguey Bay | A picturesque beach known for its beautiful sunsets and clear waters, popular for swimming and relaxation. | Maguey Beach, Restaurants by the beach, Snorkeling, Boat tours |
| Pochutla | A nearby town that offers a taste of local life and access to hidden beaches, perfect for travelers seeking authenticity and adventure. | Local markets, Traditional festivals, Nearby beaches, Cultural experiences |
| La Entrega Beach | A small, beautiful beach ideal for families and those looking for a tranquil spot. Great for snorkeling and beach activities. | La Entrega Beach, Coral reefs, Calm waters for swimming, Sunbathing spots |
Understanding Airbnb License Requirements & STR Laws in La Crucecita (2026)
While La Crucecita, Oaxaca, Mexico currently shows low STR regulations, specific Airbnb license requirements might still exist or change. Always verify the latest short term rental regulations and Airbnb license requirements directly with local government authorities for La Crucecita to ensure full compliance before hosting.
(Source: AirROI data, 2026, based on 0% licensed listings)
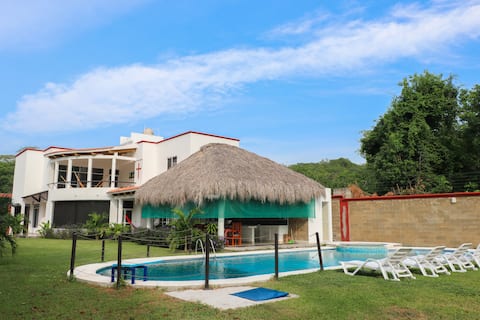
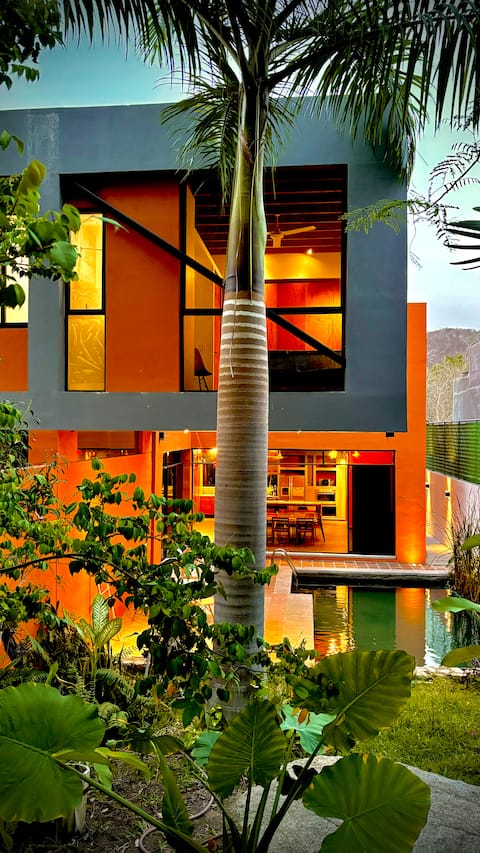
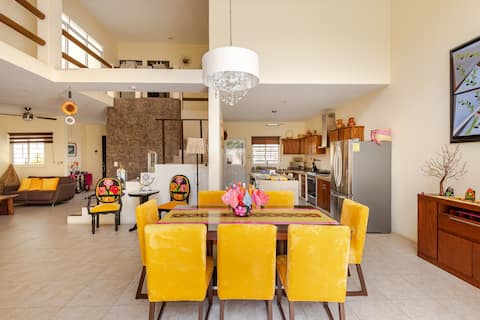
Top Performing Airbnb Properties in La Crucecita (2026)
Benchmark your potential! Explore examples of top-performing Airbnb properties in La Crucecitabased on Trailing Twelve Month (TTM) revenue. Analyze their characteristics, revenue, occupancy rate, and ADR to understand what drives success in this market.

Casa Maka - Frente al Mar
Entire Place • 5 bedrooms
Beautiful House in Huatulco
Entire Place • 6 bedrooms
Beautiful private villa with an ecological pool
Entire Place • 4 bedrooms

Casa Sá, 5 minutes from the beach by car
Entire Place • 4 bedrooms

Magnificent Villa in Marina Chahué, Marina Soul!
Entire Place • 6 bedrooms
Experience Huatulco at Casa Arena de Mar
Entire Place • 4 bedrooms
Note: Performance varies based on location, size, amenities, seasonality, and management quality. Data reflects the past 12 months.
Top Performing Airbnb Hosts in La Crucecita (2026)
Learn from the best! This table showcases top-performing Airbnb hosts in La Crucecita based on the number of properties managed and estimated total revenue over the past year. Analyze their scale and performance metrics.
| Host Name | Properties | Grossing Revenue | Stay Reviews | Avg Rating |
|---|---|---|---|---|
| Adan | 7 | $237,247 | 218 | 4.53/5.0 |
| Jorge | 15 | $174,411 | 2134 | 4.57/5.0 |
| Alejandro | 6 | $168,754 | 126 | 4.85/5.0 |
| Aviel | 7 | $162,281 | 262 | 4.90/5.0 |
| My Huatulco Vacation (MHV) | 12 | $157,440 | 53 | 4.80/5.0 |
| Mauricio | 16 | $150,269 | 878 | 4.75/5.0 |
| Maria De Jesus | 9 | $142,258 | 152 | 4.77/5.0 |
| Clara | 30 | $138,950 | 1091 | 4.52/5.0 |
| Jessica | 9 | $132,707 | 852 | 4.78/5.0 |
| Anajulia | 7 | $126,520 | 430 | 4.72/5.0 |
Analyzing the strategies of top hosts, such as their property selection, pricing, and guest communication, can offer valuable lessons for optimizing your own Airbnb operations in La Crucecita.
Dive Deeper: Advanced La Crucecita STR Market Data (2026)
Ready to unlock more insights? AirROI provides access to advanced metrics and comprehensive Airbnb data for La Crucecita. Explore detailed analytics beyond this report to refine your investment strategy, optimize pricing, and maximize your vacation rental profits.
Explore Advanced MetricsLa Crucecita Short-Term Rental Market Composition (2026): Property & Room Types
Room Type Distribution
Property Type Distribution
Market Composition Insights for La Crucecita
- The La Crucecita Airbnb market composition is heavily skewed towards Entire Home/Apt listings, which make up 73.4% of the 852 active rentals. This indicates strong guest preference for privacy and space.
- Looking at the property type distribution in La Crucecita, Apartment/Condo properties are the most common (60.7%), reflecting the local real estate landscape.
- Houses represent a significant 26.3% portion, catering likely to families or larger groups.
- The presence of 10.4% Hotel/Boutique listings indicates integration with traditional hospitality.
- Smaller segments like others, unique stays (combined 2.5%) offer potential for unique stay experiences.
La Crucecita Airbnb Room Capacity Analysis (2026): Bedroom Distribution
Distribution of Listings by Number of Bedrooms
Room Capacity Insights for La Crucecita
- The dominant room capacity in La Crucecita is 2 bedrooms listings, making up 39.8% of the market. This suggests a strong demand for properties suitable for couples or solo travelers.
- Together, 2 bedrooms and 1 bedroom properties represent 66.0% of the active Airbnb listings in La Crucecita, indicating a high concentration in these sizes.
La Crucecita Vacation Rental Guest Capacity Trends (2026)
Distribution of Listings by Guest Capacity
Guest Capacity Insights for La Crucecita
- The most common guest capacity trend in La Crucecita vacation rentals is listings accommodating 4 guests (26.1%). This suggests the primary traveler segment is likely small families or groups.
- Properties designed for 4 guests and 6 guests dominate the La Crucecita STR market, accounting for 45.3% of listings.
- 34.4% of properties accommodate 6+ guests, serving the market segment for larger families or group travel in La Crucecita.
- On average, properties in La Crucecita are equipped to host 4.2 guests.
La Crucecita Airbnb Booking Patterns (2026): Available vs. Booked Days
Available Days Distribution
Booked Days Distribution
Booking Pattern Insights for La Crucecita
- The most common availability pattern in La Crucecita falls within the 271-366 days range, representing 63.1% of listings. This suggests many properties have significant open periods on their calendars.
- Approximately 87.9% of listings show high availability (181+ days open annually), indicating potential for increased bookings or specific owner usage patterns.
- For booked days, the 31-90 days range is most frequent in La Crucecita (33.6%), reflecting common guest stay durations or potential owner blocking patterns.
- A notable 12.6% of properties secure long booking periods (181+ days booked per year), highlighting successful long-term rental strategies or significant owner usage.
La Crucecita Airbnb Minimum Stay Requirements Analysis
Distribution of Listings by Minimum Night Requirement
1 Night
271 listings
31.8% of total
2 Nights
237 listings
27.8% of total
3 Nights
85 listings
10% of total
4-6 Nights
33 listings
3.9% of total
7-29 Nights
13 listings
1.5% of total
30+ Nights
213 listings
25% of total
Key Insights
- The most prevalent minimum stay requirement in La Crucecita is 1 Night, adopted by 31.8% of listings. This highlights the market's preference for shorter, flexible bookings.
- A significant segment (25%) caters to monthly stays (30+ nights) in La Crucecita, pointing to opportunities in the extended-stay market.
Recommendations
- Align with the market by considering a 1 Night minimum stay, as 31.8% of La Crucecita hosts use this setting.
- Explore offering discounts for stays of 30+ nights to attract the 25% of the market seeking extended stays.
- Adjust minimum nights based on seasonality – potentially shorter during low season and longer during peak demand periods in La Crucecita.
La Crucecita Airbnb Cancellation Policy Trends Analysis (2026)
Super Strict 60 Days
14 listings
1.6% of total
Super Strict 30 Days
2 listings
0.2% of total
Limited
12 listings
1.4% of total
Flexible
260 listings
30.6% of total
Moderate
212 listings
24.9% of total
Firm
243 listings
28.6% of total
Strict
107 listings
12.6% of total
Cancellation Policy Insights for La Crucecita
- The prevailing Airbnb cancellation policy trend in La Crucecita is Flexible, used by 30.6% of listings.
- There's a relatively balanced mix between guest-friendly (55.5%) and stricter (41.2%) policies, offering choices for different guest needs.
Recommendations for Hosts
- Consider adopting a Flexible policy to align with the 30.6% market standard in La Crucecita.
- Using a Strict policy might deter some guests, as only 12.6% of listings use it. Evaluate if potential revenue protection outweighs possible lower booking rates.
- Regularly review your cancellation policy against competitors and market demand shifts in La Crucecita.
La Crucecita STR Booking Lead Time Analysis (2026)
Average Booking Lead Time by Month
Booking Lead Time Insights for La Crucecita
- The overall average booking lead time for vacation rentals in La Crucecita is 44 days.
- Guests book furthest in advance for stays during January (average 81 days), likely coinciding with peak travel demand or local events.
- The shortest booking windows occur for stays in August (average 26 days), indicating more last-minute travel plans during this time.
- Seasonally, Winter (69 days avg.) sees the longest lead times, while Summer (29 days avg.) has the shortest, reflecting typical travel planning cycles.
Recommendations for Hosts
- Use the overall average lead time (44 days) as a baseline for your pricing and availability strategy in La Crucecita.
- For January stays, consider implementing length-of-stay discounts or slightly higher rates for bookings made less than 81 days out to capitalize on advance planning.
- Target marketing efforts for the Winter season well in advance (at least 69 days) to capture early planners.
- Monitor your own booking lead times against these La Crucecita averages to identify opportunities for dynamic pricing adjustments.
Popular & Essential Airbnb Amenities in La Crucecita (2026)
Amenity Prevalence
Amenity Insights for La Crucecita
- Essential amenities in La Crucecita that guests expect include: Wifi, Air conditioning. Lacking these (any) could significantly impact bookings.
- Popular amenities like TV, Kitchen, Dishes and silverware are common but not universal. Offering these can provide a competitive edge.
Recommendations for Hosts
- Ensure your listing includes all essential amenities for La Crucecita: Wifi, Air conditioning.
- Prioritize adding missing essentials: Wifi, Air conditioning.
- Consider adding popular differentiators like TV or Kitchen to increase appeal.
- Highlight unique or less common amenities you offer (e.g., hot tub, dedicated workspace, EV charger) in your listing description and photos.
- Regularly check competitor amenities in La Crucecita to stay competitive.
La Crucecita Airbnb Guest Demographics & Profile Analysis (2026)
Guest Profile Summary for La Crucecita
- The typical guest profile for Airbnb in La Crucecita consists of primarily domestic travelers (70%), often arriving from nearby Mexico City, typically belonging to the Post-2000s (Gen Z/Alpha) group (50%), primarily speaking Spanish or English.
- Domestic travelers account for 70.3% of guests.
- Key international markets include Mexico (70.3%) and Canada (12.3%).
- Top languages spoken are Spanish (50.3%) followed by English (37.1%).
- A significant demographic segment is the Post-2000s (Gen Z/Alpha) group, representing 50% of guests.
Recommendations for Hosts
- Target domestic marketing efforts towards travelers from Mexico City and Oaxaca.
- Tailor amenities and listing descriptions to appeal to the dominant Post-2000s (Gen Z/Alpha) demographic (e.g., highlight fast WiFi, smart home features, local guides).
- Highlight unique local experiences or amenities relevant to the primary guest profile.
- Consider seasonal promotions aligned with peak travel times for key origin markets.
Nearby Short-Term Rental Market Comparison
How does the La Crucecita Airbnb market stack up against its neighbors? Compare key performance metrics like average monthly revenue, ADR, and occupancy rates in surrounding areas to understand the broader regional STR landscape.
| Market | Active Properties | Monthly Revenue | Daily Rate | Avg. Occupancy |
|---|---|---|---|---|
| Huatulco | 10 | $2,925 | $306.55 | 41% |
| Bahía de Conejos | 53 | $2,343 | $360.20 | 33% |
| El Puertecito | 10 | $1,781 | $310.46 | 26% |
| Salchi | 28 | $1,752 | $223.03 | 31% |
| Crucecita | 37 | $1,740 | $240.44 | 34% |
| Bahías de Huatulco | 49 | $1,644 | $211.88 | 40% |
| Brisas de Zicatela | 1,652 | $1,462 | $139.14 | 40% |
| Santa María Colotepec | 40 | $1,413 | $235.74 | 24% |
| Bajos de Chila | 32 | $1,370 | $232.84 | 23% |
| Puerto Escondido | 1,061 | $1,292 | $146.13 | 37% |