Tlaquepaque Airbnb Market Analysis 2026: Short Term Rental Data & Vacation Rental Statistics in Jalisco, Mexico
Is Airbnb profitable in Tlaquepaque in 2026? Explore comprehensive Airbnb analytics for Tlaquepaque, Jalisco, Mexico to uncover income potential. This 2026 STR market report for Tlaquepaque, based on AirROI data from February 2025 to January 2026, reveals key trends in the market of 557 active listings.
Whether you're considering an Airbnb investment in Tlaquepaque, optimizing your existing vacation rental, or exploring rental arbitrage opportunities, understanding the Tlaquepaque Airbnb data is crucial. Leveraging the low regulation environment is key to maximizing your short term rental income potential. Let's dive into the specifics.
Key Tlaquepaque Airbnb Performance Metrics Overview
Monthly Airbnb Revenue Variations & Income Potential in Tlaquepaque (2026)
Understanding the monthly revenue variations for Airbnb listings in Tlaquepaque is key to maximizing your short term rental income potential. Seasonality significantly impacts earnings. Our analysis, based on data from the past 12 months, shows that the peak revenue month for STRs in Tlaquepaque is typically December, while January often presents the lowest earnings, highlighting opportunities for strategic pricing adjustments during shoulder and low seasons. Explore the typical Airbnb income in Tlaquepaque across different performance tiers:
- Best-in-class properties (Top 10%) achieve $1,373+ monthly, often utilizing dynamic pricing and superior guest experiences.
- Strong performing properties (Top 25%) earn $901 or more, indicating effective management and desirable locations/amenities.
- Typical properties (Median) generate around $537 per month, representing the average market performance.
- Entry-level properties (Bottom 25%) see earnings around $262, often with potential for optimization.
Average Monthly Airbnb Earnings Trend in Tlaquepaque
Tlaquepaque Airbnb Occupancy Rate Trends (2026)
Maximize your bookings by understanding the Tlaquepaque STR occupancy trends. Seasonal demand shifts significantly influence how often properties are booked. Typically, Marchsees the highest demand (peak season occupancy), while January experiences the lowest (low season). Effective strategies, like adjusting minimum stays or offering promotions, can boost occupancy during slower periods. Here's how different property tiers perform in Tlaquepaque:
- Best-in-class properties (Top 10%) achieve 76%+ occupancy, indicating high desirability and potentially optimized availability.
- Strong performing properties (Top 25%) maintain 59% or higher occupancy, suggesting good market fit and guest satisfaction.
- Typical properties (Median) have an occupancy rate around 37%.
- Entry-level properties (Bottom 25%) average 18% occupancy, potentially facing higher vacancy.
Average Monthly Occupancy Rate Trend in Tlaquepaque
Average Daily Rate (ADR) Airbnb Trends in Tlaquepaque (2026)
Effective short term rental pricing strategy in Tlaquepaque involves understanding monthly ADR fluctuations. The Average Daily Rate (ADR) for Airbnb in Tlaquepaque typically peaks in May and dips lowest during March. Leveraging Airbnb dynamic pricing tools or strategies based on this seasonality can significantly boost revenue. Here's a look at the typical nightly rates achieved:
- Best-in-class properties (Top 10%) command rates of $88+ per night, often due to premium features or locations.
- Strong performing properties (Top 25%) achieve nightly rates of $59 or more.
- Typical properties (Median) charge around $45 per night.
- Entry-level properties (Bottom 25%) earn around $35 per night.
Average Daily Rate (ADR) Trend by Month in Tlaquepaque
Get Live Tlaquepaque Market Intelligence 👇

Explore Real-time Analytics
Airbnb Seasonality Analysis & Trends in Tlaquepaque (2026)
Peak Season (December, November, June)
- Revenue averages $844 per month
- Occupancy rates average 41.3%
- Daily rates average $67
Shoulder Season
- Revenue averages $733 per month
- Occupancy maintains around 42.4%
- Daily rates hold near $63
Low Season (January, May, September)
- Revenue drops to average $603 per month
- Occupancy decreases to average 34.0%
- Daily rates adjust to average $67
Seasonality Insights for Tlaquepaque
- The Airbnb seasonality in Tlaquepaque shows moderate seasonality with distinct peak and low periods. While the sections above show seasonal averages, it's also insightful to look at the extremes:
- During the high season, the absolute peak month showcases Tlaquepaque's highest earning potential, with monthly revenues capable of climbing to $870, occupancy reaching a high of 44.2%, and ADRs peaking at $72.
- Conversely, the slowest single month of the year, typically falling within the low season, marks the market's lowest point. In this month, revenue might dip to $545, occupancy could drop to 30.5%, and ADRs may adjust down to $60.
- Understanding both the seasonal averages and these monthly peaks and troughs in revenue, occupancy, and ADR is crucial for maximizing your Airbnb profit potential in Tlaquepaque.
Seasonal Strategies for Maximizing Profit
- Peak Season: Maximize revenue through premium pricing and potentially longer minimum stays. Ensure high availability.
- Low Season: Offer competitive pricing, special promotions (e.g., extended stay discounts), and flexible cancellation policies. Target off-season travelers like remote workers or budget-conscious guests.
- Shoulder Seasons: Implement dynamic pricing that balances peak and low rates. Target weekend travelers or specific events. Offer slightly more flexible terms than peak season.
- Regularly analyze your own performance against these Tlaquepaque seasonality benchmarks and adjust your pricing and availability strategy accordingly.
Best Areas for Airbnb Investment in Tlaquepaque (2026)
Exploring the top neighborhoods for short-term rentals in Tlaquepaque? This section highlights key areas, outlining why they are attractive for hosts and guests, along with notable local attractions. Consider these locations based on your target guest profile and investment strategy.
| Neighborhood / Area | Why Host Here? (Target Guests & Appeal) | Key Attractions & Landmarks |
|---|---|---|
| Centro Histórico | Cultural and historical heart of Tlaquepaque, known for its charming streets, artisan shops, and vibrant atmosphere. Ideal for tourists looking to experience local culture and crafts. | Parroquia de San Pedro, Centro Cultural El Refugio, Plaza de Tlaquepaque, Museo Regional de Cerámica, Tianguis de Artesanías |
| San Pedro Tlaquepaque | Sophisticated residential area with a mix of modern and traditional architecture. Offers a quieter experience while still being close to the vibrant artisan scene. | Jardín Hidalgo, Museo Pantaleon Panduro, Teatro Degollado, Casa Museo de Los Abuelos |
| Las Juntas | Growing neighborhood with a mix of local residents and tourists, known for its authentic dining options and local markets. Good spot for affordable accommodations. | Mercado de Abastos, Zona Río, Puente de Las Juntas |
| Lomas de Tlaquepaque | Upscale residential neighborhood with beautiful parks and green spaces. Attracts families and travelers looking for a peaceful environment. | Parque de la Revolución, Parque Arboledas, Centro Deportivo |
| El Carmen | Cultural zone known for its art galleries and artisanal shops. Attracts tourists who want to explore local art and crafts. | Galerías de Arte, Ex Convento del Carmen, Mercado de Artesanías |
| San Martín de las Flores | Lively local community with easy access to public transport. Great for travelers wanting to explore Tlaquepaque and nearby areas. | Jardín San Martín, Parroquia de San Martín, Plaza Principal |
| Santa Anita | Emerging neighborhood that is a blend of urban and suburban lifestyles. Ideal for budget-conscious travelers seeking nice accommodations. | Parque de Santa Anita, Centro Comercial Plaza San Isidro |
| La Duraznera | Residential area with a local vibe and close access to nature parks. Perfect for those looking for a retreat near the city. | Parque Ecológico, Cerro de la Duraznera |
Understanding Airbnb License Requirements & STR Laws in Tlaquepaque (2026)
While Tlaquepaque, Jalisco, Mexico currently shows low STR regulations, specific Airbnb license requirements might still exist or change. Always verify the latest short term rental regulations and Airbnb license requirements directly with local government authorities for Tlaquepaque to ensure full compliance before hosting.
(Source: AirROI data, 2026, finding no licensed listings among those analyzed)
Top Performing Airbnb Properties in Tlaquepaque (2026)
Benchmark your potential! Explore examples of top-performing Airbnb properties in Tlaquepaquebased on Trailing Twelve Month (TTM) revenue. Analyze their characteristics, revenue, occupancy rate, and ADR to understand what drives success in this market.
ITESO 5 ACCOMMODATION OPPORTUNITY full payment is invoiced
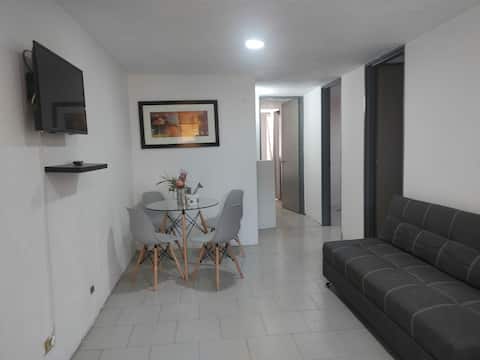
Entire Place • 3 bedrooms

Entire house. Mis Marías. Tlaquepaque downtown.
Entire Place • 9 bedrooms
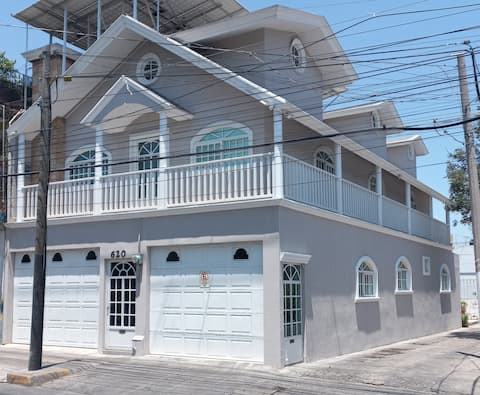
Special Groups 4 Beautiful Hotel Type Rooms
Private Room • 4 bedrooms
Beautiful house in Tlaquepaque
Entire Place • 7 bedrooms

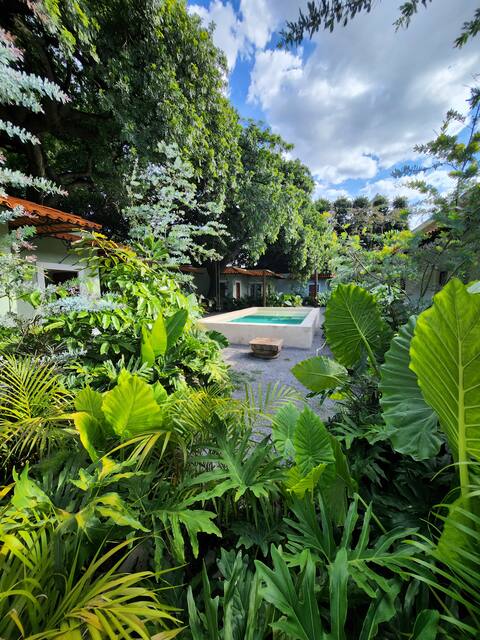
Urban Hacienda downtown, quiet, garden, jacuzzi
Entire Place • 5 bedrooms
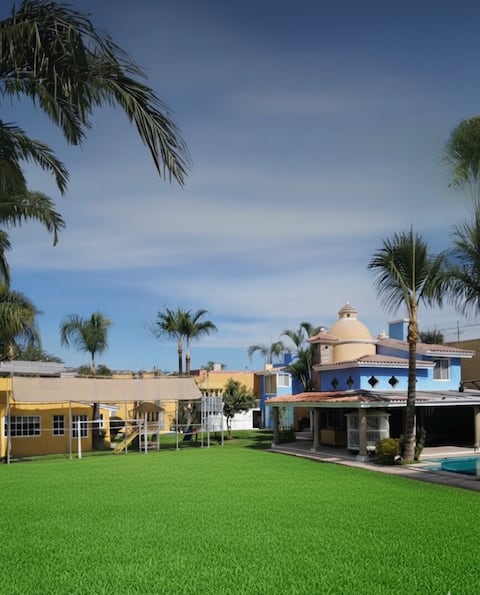
"Los Loros" Vacation Castle
Entire Place • 6 bedrooms
Note: Performance varies based on location, size, amenities, seasonality, and management quality. Data reflects the past 12 months.
Top Performing Airbnb Hosts in Tlaquepaque (2026)
Learn from the best! This table showcases top-performing Airbnb hosts in Tlaquepaque based on the number of properties managed and estimated total revenue over the past year. Analyze their scale and performance metrics.
| Host Name | Properties | Grossing Revenue | Stay Reviews | Avg Rating |
|---|---|---|---|---|
| Villa Escondida Tlaquepaque | 15 | $208,983 | 348 | 4.67/5.0 |
| Alonso | 3 | $90,623 | 197 | 4.91/5.0 |
| Rutilio | 8 | $90,029 | 535 | 4.88/5.0 |
| Rodolfo | 9 | $86,612 | 83 | 4.59/5.0 |
| Leirand | 9 | $80,917 | 904 | 4.88/5.0 |
| Tony | 17 | $65,944 | 547 | 4.92/5.0 |
| Adriana | 6 | $58,739 | 295 | 4.89/5.0 |
| Carlos | 10 | $58,130 | 390 | 4.97/5.0 |
| Rodolfo | 9 | $57,215 | 1867 | 4.92/5.0 |
| María De Jesús | 8 | $54,843 | 2216 | 4.88/5.0 |
Analyzing the strategies of top hosts, such as their property selection, pricing, and guest communication, can offer valuable lessons for optimizing your own Airbnb operations in Tlaquepaque.
Dive Deeper: Advanced Tlaquepaque STR Market Data (2026)
Ready to unlock more insights? AirROI provides access to advanced metrics and comprehensive Airbnb data for Tlaquepaque. Explore detailed analytics beyond this report to refine your investment strategy, optimize pricing, and maximize your vacation rental profits.
Explore Advanced MetricsTlaquepaque Short-Term Rental Market Composition (2026): Property & Room Types
Room Type Distribution
Property Type Distribution
Market Composition Insights for Tlaquepaque
- The Tlaquepaque Airbnb market composition is heavily skewed towards Entire Home/Apt listings, which make up 81.7% of the 557 active rentals. This indicates strong guest preference for privacy and space.
- Looking at the property type distribution in Tlaquepaque, Apartment/Condo properties are the most common (52.6%), reflecting the local real estate landscape.
- Houses represent a significant 33% portion, catering likely to families or larger groups.
- The presence of 11.8% Hotel/Boutique listings indicates integration with traditional hospitality.
- Smaller segments like others (combined 2.5%) offer potential for unique stay experiences.
Tlaquepaque Airbnb Room Capacity Analysis (2026): Bedroom Distribution
Distribution of Listings by Number of Bedrooms
Room Capacity Insights for Tlaquepaque
- The dominant room capacity in Tlaquepaque is 2 bedrooms listings, making up 44.2% of the market. This suggests a strong demand for properties suitable for couples or solo travelers.
- Together, 2 bedrooms and 1 bedroom properties represent 67.5% of the active Airbnb listings in Tlaquepaque, indicating a high concentration in these sizes.
- A significant 21.3% of listings offer 3+ bedrooms, catering to larger groups and families seeking more space in Tlaquepaque.
Tlaquepaque Vacation Rental Guest Capacity Trends (2026)
Distribution of Listings by Guest Capacity
Guest Capacity Insights for Tlaquepaque
- The most common guest capacity trend in Tlaquepaque vacation rentals is listings accommodating 4 guests (33.6%). This suggests the primary traveler segment is likely small families or groups.
- Properties designed for 4 guests and 2 guests dominate the Tlaquepaque STR market, accounting for 49.9% of listings.
- 26.6% of properties accommodate 6+ guests, serving the market segment for larger families or group travel in Tlaquepaque.
- On average, properties in Tlaquepaque are equipped to host 4.1 guests.
Tlaquepaque Airbnb Booking Patterns (2026): Available vs. Booked Days
Available Days Distribution
Booked Days Distribution
Booking Pattern Insights for Tlaquepaque
- The most common availability pattern in Tlaquepaque falls within the 271-366 days range, representing 49.2% of listings. This suggests many properties have significant open periods on their calendars.
- Approximately 82.6% of listings show high availability (181+ days open annually), indicating potential for increased bookings or specific owner usage patterns.
- For booked days, the 91-180 days range is most frequent in Tlaquepaque (34.3%), reflecting common guest stay durations or potential owner blocking patterns.
- A notable 18.5% of properties secure long booking periods (181+ days booked per year), highlighting successful long-term rental strategies or significant owner usage.
Tlaquepaque Airbnb Minimum Stay Requirements Analysis
Distribution of Listings by Minimum Night Requirement
1 Night
278 listings
49.9% of total
2 Nights
168 listings
30.2% of total
3 Nights
18 listings
3.2% of total
4-6 Nights
6 listings
1.1% of total
7-29 Nights
5 listings
0.9% of total
30+ Nights
82 listings
14.7% of total
Key Insights
- The most prevalent minimum stay requirement in Tlaquepaque is 1 Night, adopted by 49.9% of listings. This highlights the market's preference for shorter, flexible bookings.
- A strong majority (80.1%) of the Tlaquepaque Airbnb data shows acceptance of very short stays (1-2 nights), indicating a dynamic, high-turnover market.
- A significant segment (14.7%) caters to monthly stays (30+ nights) in Tlaquepaque, pointing to opportunities in the extended-stay market.
Recommendations
- Align with the market by considering a 1 Night minimum stay, as 49.9% of Tlaquepaque hosts use this setting.
- Explore offering discounts for stays of 30+ nights to attract the 14.7% of the market seeking extended stays.
- Adjust minimum nights based on seasonality – potentially shorter during low season and longer during peak demand periods in Tlaquepaque.
Tlaquepaque Airbnb Cancellation Policy Trends Analysis (2026)
Limited
2 listings
0.4% of total
Flexible
258 listings
46.4% of total
Moderate
155 listings
27.9% of total
Firm
104 listings
18.7% of total
Strict
37 listings
6.7% of total
Cancellation Policy Insights for Tlaquepaque
- The prevailing Airbnb cancellation policy trend in Tlaquepaque is Flexible, used by 46.4% of listings.
- The market strongly favors guest-friendly terms, with 74.3% of listings offering Flexible or Moderate policies. This suggests guests in Tlaquepaque may expect booking flexibility.
- Strict cancellation policies are quite rare (6.7%), potentially making listings with this policy less competitive unless justified by high demand or property type.
Recommendations for Hosts
- Consider adopting a Flexible policy to align with the 46.4% market standard in Tlaquepaque.
- Using a Strict policy might deter some guests, as only 6.7% of listings use it. Evaluate if potential revenue protection outweighs possible lower booking rates.
- Regularly review your cancellation policy against competitors and market demand shifts in Tlaquepaque.
Tlaquepaque STR Booking Lead Time Analysis (2026)
Average Booking Lead Time by Month
Booking Lead Time Insights for Tlaquepaque
- The overall average booking lead time for vacation rentals in Tlaquepaque is 21 days.
- Guests book furthest in advance for stays during October (average 27 days), likely coinciding with peak travel demand or local events.
- The shortest booking windows occur for stays in March (average 14 days), indicating more last-minute travel plans during this time.
- Seasonally, Fall (25 days avg.) sees the longest lead times, while Spring (16 days avg.) has the shortest, reflecting typical travel planning cycles.
Recommendations for Hosts
- Use the overall average lead time (21 days) as a baseline for your pricing and availability strategy in Tlaquepaque.
- Target marketing efforts for the Fall season well in advance (at least 25 days) to capture early planners.
- Monitor your own booking lead times against these Tlaquepaque averages to identify opportunities for dynamic pricing adjustments.
Popular & Essential Airbnb Amenities in Tlaquepaque (2026)
Amenity Prevalence
Amenity Insights for Tlaquepaque
- Essential amenities in Tlaquepaque that guests expect include: Wifi, TV. Lacking these (any) could significantly impact bookings.
- Popular amenities like Hot water, Kitchen, Iron are common but not universal. Offering these can provide a competitive edge.
Recommendations for Hosts
- Ensure your listing includes all essential amenities for Tlaquepaque: Wifi, TV.
- Prioritize adding missing essentials: Wifi, TV.
- Consider adding popular differentiators like Hot water or Kitchen to increase appeal.
- Highlight unique or less common amenities you offer (e.g., hot tub, dedicated workspace, EV charger) in your listing description and photos.
- Regularly check competitor amenities in Tlaquepaque to stay competitive.
Tlaquepaque Airbnb Guest Demographics & Profile Analysis (2026)
Guest Profile Summary for Tlaquepaque
- The typical guest profile for Airbnb in Tlaquepaque consists of primarily domestic travelers (67%), often arriving from nearby Mexico City, typically belonging to the Post-2000s (Gen Z/Alpha) group (50%), primarily speaking Spanish or English.
- Domestic travelers account for 66.9% of guests.
- Key international markets include Mexico (66.9%) and United States (27.5%).
- Top languages spoken are Spanish (54.2%) followed by English (38%).
- A significant demographic segment is the Post-2000s (Gen Z/Alpha) group, representing 50% of guests.
Recommendations for Hosts
- Target domestic marketing efforts towards travelers from Mexico City and Guadalajara.
- Tailor amenities and listing descriptions to appeal to the dominant Post-2000s (Gen Z/Alpha) demographic (e.g., highlight fast WiFi, smart home features, local guides).
- Highlight unique local experiences or amenities relevant to the primary guest profile.
- Consider seasonal promotions aligned with peak travel times for key origin markets.
Nearby Short-Term Rental Market Comparison
How does the Tlaquepaque Airbnb market stack up against its neighbors? Compare key performance metrics like average monthly revenue, ADR, and occupancy rates in surrounding areas to understand the broader regional STR landscape.
| Market | Active Properties | Monthly Revenue | Daily Rate | Avg. Occupancy |
|---|---|---|---|---|
| Tapalpa Country Club | 13 | $2,558 | $372.99 | 31% |
| San Juan Cosalá | 97 | $2,085 | $259.66 | 29% |
| La Calera | 25 | $1,725 | $227.68 | 29% |
| San Pedro Tesistán | 13 | $1,669 | $306.69 | 25% |
| Cajititlán | 27 | $1,663 | $216.62 | 26% |
| San Miguel | 36 | $1,487 | $280.59 | 20% |
| La Manzanilla | 30 | $1,460 | $192.53 | 34% |
| La Huerta | 247 | $1,347 | $299.79 | 28% |
| Río de los Chilares | 14 | $1,244 | $179.16 | 28% |
| La Laguna | 33 | $1,240 | $178.33 | 26% |