San Patricio Airbnb Market Analysis 2026: Short Term Rental Data & Vacation Rental Statistics in Jalisco, Mexico
Is Airbnb profitable in San Patricio in 2026? Explore comprehensive Airbnb analytics for San Patricio, Jalisco, Mexico to uncover income potential. This 2026 STR market report for San Patricio, based on AirROI data from February 2025 to January 2026, reveals key trends in the niche market of 80 active listings.
Whether you're considering an Airbnb investment in San Patricio, optimizing your existing vacation rental, or exploring rental arbitrage opportunities, understanding the San Patricio Airbnb data is crucial. Leveraging the low regulation environment is key to maximizing your short term rental income potential. Let's dive into the specifics.
Key San Patricio Airbnb Performance Metrics Overview
Monthly Airbnb Revenue Variations & Income Potential in San Patricio (2026)
Understanding the monthly revenue variations for Airbnb listings in San Patricio is key to maximizing your short term rental income potential. Seasonality significantly impacts earnings. Our analysis, based on data from the past 12 months, shows that the peak revenue month for STRs in San Patricio is typically March, while September often presents the lowest earnings, highlighting opportunities for strategic pricing adjustments during shoulder and low seasons. Explore the typical Airbnb income in San Patricio across different performance tiers:
- Best-in-class properties (Top 10%) achieve $2,874+ monthly, often utilizing dynamic pricing and superior guest experiences.
- Strong performing properties (Top 25%) earn $1,448 or more, indicating effective management and desirable locations/amenities.
- Typical properties (Median) generate around $709 per month, representing the average market performance.
- Entry-level properties (Bottom 25%) see earnings around $379, often with potential for optimization.
Average Monthly Airbnb Earnings Trend in San Patricio
San Patricio Airbnb Occupancy Rate Trends (2026)
Maximize your bookings by understanding the San Patricio STR occupancy trends. Seasonal demand shifts significantly influence how often properties are booked. Typically, Februarysees the highest demand (peak season occupancy), while September experiences the lowest (low season). Effective strategies, like adjusting minimum stays or offering promotions, can boost occupancy during slower periods. Here's how different property tiers perform in San Patricio:
- Best-in-class properties (Top 10%) achieve 69%+ occupancy, indicating high desirability and potentially optimized availability.
- Strong performing properties (Top 25%) maintain 49% or higher occupancy, suggesting good market fit and guest satisfaction.
- Typical properties (Median) have an occupancy rate around 28%.
- Entry-level properties (Bottom 25%) average 13% occupancy, potentially facing higher vacancy.
Average Monthly Occupancy Rate Trend in San Patricio
Average Daily Rate (ADR) Airbnb Trends in San Patricio (2026)
Effective short term rental pricing strategy in San Patricio involves understanding monthly ADR fluctuations. The Average Daily Rate (ADR) for Airbnb in San Patricio typically peaks in September and dips lowest during March. Leveraging Airbnb dynamic pricing tools or strategies based on this seasonality can significantly boost revenue. Here's a look at the typical nightly rates achieved:
- Best-in-class properties (Top 10%) command rates of $205+ per night, often due to premium features or locations.
- Strong performing properties (Top 25%) achieve nightly rates of $130 or more.
- Typical properties (Median) charge around $86 per night.
- Entry-level properties (Bottom 25%) earn around $60 per night.
Average Daily Rate (ADR) Trend by Month in San Patricio
Get Live San Patricio Market Intelligence 👇

Explore Real-time Analytics
Airbnb Seasonality Analysis & Trends in San Patricio (2026)
Peak Season (March, January, February)
- Revenue averages $1,681 per month
- Occupancy rates average 45.1%
- Daily rates average $114
Shoulder Season
- Revenue averages $1,238 per month
- Occupancy maintains around 31.6%
- Daily rates hold near $114
Low Season (June, August, September)
- Revenue drops to average $854 per month
- Occupancy decreases to average 24.4%
- Daily rates adjust to average $116
Seasonality Insights for San Patricio
- The Airbnb seasonality in San Patricio shows highly seasonal trends requiring careful strategy. While the sections above show seasonal averages, it's also insightful to look at the extremes:
- During the high season, the absolute peak month showcases San Patricio's highest earning potential, with monthly revenues capable of climbing to $1,865, occupancy reaching a high of 51.8%, and ADRs peaking at $121.
- Conversely, the slowest single month of the year, typically falling within the low season, marks the market's lowest point. In this month, revenue might dip to $721, occupancy could drop to 20.7%, and ADRs may adjust down to $110.
- Understanding both the seasonal averages and these monthly peaks and troughs in revenue, occupancy, and ADR is crucial for maximizing your Airbnb profit potential in San Patricio.
Seasonal Strategies for Maximizing Profit
- Peak Season: Maximize revenue through premium pricing and potentially longer minimum stays. Ensure high availability.
- Low Season: Offer competitive pricing, special promotions (e.g., extended stay discounts), and flexible cancellation policies. Target off-season travelers like remote workers or budget-conscious guests.
- Shoulder Seasons: Implement dynamic pricing that balances peak and low rates. Target weekend travelers or specific events. Offer slightly more flexible terms than peak season.
- Regularly analyze your own performance against these San Patricio seasonality benchmarks and adjust your pricing and availability strategy accordingly.
Best Areas for Airbnb Investment in San Patricio (2026)
Exploring the top neighborhoods for short-term rentals in San Patricio? This section highlights key areas, outlining why they are attractive for hosts and guests, along with notable local attractions. Consider these locations based on your target guest profile and investment strategy.
| Neighborhood / Area | Why Host Here? (Target Guests & Appeal) | Key Attractions & Landmarks |
|---|---|---|
| Melaque | A picturesque coastal town popular with tourists for its beautiful beaches, warm climate, and vibrant local culture. Great for vacation rentals due to its appeal among both national and international visitors. | Melaque Beach, La Manzanilla Coves, Ayuquila River, Local seafood restaurants, Fishing activities |
| Puerto Vallarta | A well-known tourist destination featuring stunning beaches, a lively arts scene, and a bustling nightlife. Ideal for Airbnb with a continuous flow of visitors year-round. | Malecón, Zona Romántica, Los Muertos Beach, Our Lady of Guadalupe Church, Art Walk |
| Barra de Navidad | Famous for its charming colonial architecture, beautiful lagoons, and excellent surfing spots. Popular among tourists looking for a laid-back beach experience. | Barra de Navidad Beach, Laguna de Navidad, El Faro Lighthouse, Local markets, Surf spots |
| Cihuatlán | Known for its natural beauty and traditional Mexican culture, offering a unique rural experience. Attracts visitors looking for authenticity and close-to-nature experiences. | Cihuatlán church, Local artisanal shops, Nearby beaches, Cultural festivals, Natural parks |
| San Patricio | A small yet inviting community known for its scenic views and relaxed ambiance. Perfect for travelers seeking peace and tranquility near the beach. | San Patricio Beach, Local artisan shops, Community festivals, Nearby natural reserves, Birdwatching |
| La Manzanilla | A coastal village recognized for its friendly atmosphere and eco-tourism opportunities. A hidden gem for tourists wanting a serene getaway. | La Manzanilla Beach, Crocodile Sanctuary, Natural hot springs, Local dining options, Fishing trips |
| Chamela | A tranquil beach town that offers stunning landscapes and a genuine Mexican village experience. Great for eco-conscious travelers and nature lovers. | Chamela Beach, Reserva de la Biosfera Chamela-Cuixmala, Local hiking trails, Fishing spots, Ecotourism experiences |
| Tenacatita | Famous for its beautiful beach and inlet, ideal for water sports and relaxation. Popular among families and beach lovers looking for a peaceful retreat. | Tenacatita Beach, Water sports activities, Snorkeling spots, Palapa restaurants, Beachfront lounging |
Understanding Airbnb License Requirements & STR Laws in San Patricio (2026)
While San Patricio, Jalisco, Mexico currently shows low STR regulations, specific Airbnb license requirements might still exist or change. Always verify the latest short term rental regulations and Airbnb license requirements directly with local government authorities for San Patricio to ensure full compliance before hosting.
(Source: AirROI data, 2026, finding no licensed listings among those analyzed)
Top Performing Airbnb Properties in San Patricio (2026)
Benchmark your potential! Explore examples of top-performing Airbnb properties in San Patriciobased on Trailing Twelve Month (TTM) revenue. Analyze their characteristics, revenue, occupancy rate, and ADR to understand what drives success in this market.
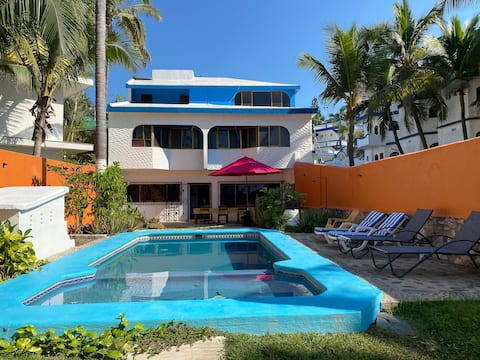
Beautiful large beach front home spectacular views
Entire Place • 5 bedrooms

La Mansion beach front Villa
Entire Place • 4 bedrooms
Melaque Beach House-Nido Contento!
Entire Place • 4 bedrooms

Casa los Almendros... Melaque!!
Entire Place • 3 bedrooms
Sueño Del Sol - House 69
Entire Place • 3 bedrooms

Casa Tamarindos with a pool and close to the beach
Entire Place • 2 bedrooms
Note: Performance varies based on location, size, amenities, seasonality, and management quality. Data reflects the past 12 months.
Top Performing Airbnb Hosts in San Patricio (2026)
Learn from the best! This table showcases top-performing Airbnb hosts in San Patricio based on the number of properties managed and estimated total revenue over the past year. Analyze their scale and performance metrics.
| Host Name | Properties | Grossing Revenue | Stay Reviews | Avg Rating |
|---|---|---|---|---|
| Carlos | 1 | $86,079 | 88 | 4.65/5.0 |
| Gord | 7 | $70,669 | 24 | 4.82/5.0 |
| Irma | 1 | $45,863 | 72 | 4.92/5.0 |
| Anne De Witt | 1 | $44,798 | 34 | 4.91/5.0 |
| Anabel | 4 | $31,663 | 273 | 4.87/5.0 |
| Melaque | 5 | $28,785 | 64 | 4.80/5.0 |
| Jorge Eduardo | 1 | $24,558 | 46 | 4.85/5.0 |
| Miguel | 2 | $22,387 | 264 | 4.76/5.0 |
| Gabriela | 1 | $21,122 | 22 | 4.55/5.0 |
| Fernanda | 3 | $19,581 | 32 | 4.90/5.0 |
Analyzing the strategies of top hosts, such as their property selection, pricing, and guest communication, can offer valuable lessons for optimizing your own Airbnb operations in San Patricio.
Dive Deeper: Advanced San Patricio STR Market Data (2026)
Ready to unlock more insights? AirROI provides access to advanced metrics and comprehensive Airbnb data for San Patricio. Explore detailed analytics beyond this report to refine your investment strategy, optimize pricing, and maximize your vacation rental profits.
Explore Advanced MetricsSan Patricio Short-Term Rental Market Composition (2026): Property & Room Types
Room Type Distribution
Property Type Distribution
Market Composition Insights for San Patricio
- The San Patricio Airbnb market composition is heavily skewed towards Entire Home/Apt listings, which make up 80% of the 80 active rentals. This indicates strong guest preference for privacy and space.
- Looking at the property type distribution in San Patricio, Apartment/Condo properties are the most common (51.2%), reflecting the local real estate landscape.
- Houses represent a significant 36.3% portion, catering likely to families or larger groups.
- The presence of 11.3% Hotel/Boutique listings indicates integration with traditional hospitality.
- Smaller segments like outdoor/unique (combined 1.3%) offer potential for unique stay experiences.
San Patricio Airbnb Room Capacity Analysis (2026): Bedroom Distribution
Distribution of Listings by Number of Bedrooms
Room Capacity Insights for San Patricio
- The dominant room capacity in San Patricio is 1 bedroom listings, making up 40% of the market. This suggests a strong demand for properties suitable for couples or solo travelers.
- Together, 1 bedroom and 2 bedrooms properties represent 72.5% of the active Airbnb listings in San Patricio, indicating a high concentration in these sizes.
San Patricio Vacation Rental Guest Capacity Trends (2026)
Distribution of Listings by Guest Capacity
Guest Capacity Insights for San Patricio
- The most common guest capacity trend in San Patricio vacation rentals is listings accommodating 4 guests (26.3%). This suggests the primary traveler segment is likely small families or groups.
- Properties designed for 4 guests and 2 guests dominate the San Patricio STR market, accounting for 51.3% of listings.
- 27.6% of properties accommodate 6+ guests, serving the market segment for larger families or group travel in San Patricio.
- On average, properties in San Patricio are equipped to host 3.9 guests.
San Patricio Airbnb Booking Patterns (2026): Available vs. Booked Days
Available Days Distribution
Booked Days Distribution
Booking Pattern Insights for San Patricio
- The most common availability pattern in San Patricio falls within the 271-366 days range, representing 78.8% of listings. This suggests many properties have significant open periods on their calendars.
- Approximately 92.6% of listings show high availability (181+ days open annually), indicating potential for increased bookings or specific owner usage patterns.
- For booked days, the 1-30 days range is most frequent in San Patricio (41.3%), reflecting common guest stay durations or potential owner blocking patterns.
- A notable 8.8% of properties secure long booking periods (181+ days booked per year), highlighting successful long-term rental strategies or significant owner usage.
San Patricio Airbnb Minimum Stay Requirements Analysis
Distribution of Listings by Minimum Night Requirement
1 Night
16 listings
20% of total
2 Nights
22 listings
27.5% of total
3 Nights
10 listings
12.5% of total
4-6 Nights
5 listings
6.3% of total
7-29 Nights
4 listings
5% of total
30+ Nights
23 listings
28.7% of total
Key Insights
- The most prevalent minimum stay requirement in San Patricio is 30+ Nights, adopted by 28.7% of listings. This highlights the market's preference for longer commitments.
- A significant segment (28.7%) caters to monthly stays (30+ nights) in San Patricio, pointing to opportunities in the extended-stay market.
Recommendations
- Align with the market by considering a 30+ Nights minimum stay, as 28.7% of San Patricio hosts use this setting.
- If feasible, allowing 1-night stays, especially midweek or during low season, could capture last-minute bookings, as only 20% currently do.
- Explore offering discounts for stays of 30+ nights to attract the 28.7% of the market seeking extended stays.
- Adjust minimum nights based on seasonality – potentially shorter during low season and longer during peak demand periods in San Patricio.
San Patricio Airbnb Cancellation Policy Trends Analysis (2026)
Flexible
25 listings
31.3% of total
Moderate
14 listings
17.5% of total
Firm
32 listings
40% of total
Strict
9 listings
11.3% of total
Cancellation Policy Insights for San Patricio
- The prevailing Airbnb cancellation policy trend in San Patricio is Firm, used by 40% of listings.
- A majority (51.3%) of hosts in San Patricio utilize Firm or Strict policies, indicating a market where hosts prioritize booking security.
Recommendations for Hosts
- Consider adopting a Firm policy to align with the 40% market standard in San Patricio.
- Using a Strict policy might deter some guests, as only 11.3% of listings use it. Evaluate if potential revenue protection outweighs possible lower booking rates.
- Regularly review your cancellation policy against competitors and market demand shifts in San Patricio.
San Patricio STR Booking Lead Time Analysis (2026)
Average Booking Lead Time by Month
Booking Lead Time Insights for San Patricio
- The overall average booking lead time for vacation rentals in San Patricio is 67 days.
- Guests book furthest in advance for stays during February (average 112 days), likely coinciding with peak travel demand or local events.
- The shortest booking windows occur for stays in June (average 12 days), indicating more last-minute travel plans during this time.
- Seasonally, Winter (94 days avg.) sees the longest lead times, while Summer (20 days avg.) has the shortest, reflecting typical travel planning cycles.
Recommendations for Hosts
- Use the overall average lead time (67 days) as a baseline for your pricing and availability strategy in San Patricio.
- For February stays, consider implementing length-of-stay discounts or slightly higher rates for bookings made less than 112 days out to capitalize on advance planning.
- During June, focus on last-minute booking availability and promotions, as guests book with very short notice (12 days avg.).
- Target marketing efforts for the Winter season well in advance (at least 94 days) to capture early planners.
- Monitor your own booking lead times against these San Patricio averages to identify opportunities for dynamic pricing adjustments.
Popular & Essential Airbnb Amenities in San Patricio (2026)
Amenity Prevalence
Amenity Insights for San Patricio
- Essential amenities in San Patricio that guests expect include: Kitchen, Wifi. Lacking these (any) could significantly impact bookings.
- Popular amenities like Refrigerator, Coffee maker, Dishes and silverware are common but not universal. Offering these can provide a competitive edge.
Recommendations for Hosts
- Ensure your listing includes all essential amenities for San Patricio: Kitchen, Wifi.
- Prioritize adding missing essentials: Kitchen, Wifi.
- Consider adding popular differentiators like Refrigerator or Coffee maker to increase appeal.
- Highlight unique or less common amenities you offer (e.g., hot tub, dedicated workspace, EV charger) in your listing description and photos.
- Regularly check competitor amenities in San Patricio to stay competitive.
San Patricio Airbnb Guest Demographics & Profile Analysis (2026)
Guest Profile Summary for San Patricio
- The typical guest profile for Airbnb in San Patricio consists of a mix of domestic (60%) and international guests, often arriving from nearby Guadalajara, typically belonging to the Post-2000s (Gen Z/Alpha) group (50%), primarily speaking Spanish or English.
- Domestic travelers account for 59.9% of guests.
- Key international markets include Mexico (59.9%) and Canada (26.1%).
- Top languages spoken are Spanish (46.6%) followed by English (44.7%).
- A significant demographic segment is the Post-2000s (Gen Z/Alpha) group, representing 50% of guests.
Recommendations for Hosts
- Balance marketing efforts between domestic and international channels based on the guest mix.
- Tailor amenities and listing descriptions to appeal to the dominant Post-2000s (Gen Z/Alpha) demographic (e.g., highlight fast WiFi, smart home features, local guides).
- Highlight unique local experiences or amenities relevant to the primary guest profile.
- Consider seasonal promotions aligned with peak travel times for key origin markets.
Nearby Short-Term Rental Market Comparison
How does the San Patricio Airbnb market stack up against its neighbors? Compare key performance metrics like average monthly revenue, ADR, and occupancy rates in surrounding areas to understand the broader regional STR landscape.
| Market | Active Properties | Monthly Revenue | Daily Rate | Avg. Occupancy |
|---|---|---|---|---|
| Punta de Mita | 85 | $5,500 | $907.19 | 33% |
| Punta Mita | 59 | $4,799 | $745.36 | 36% |
| Corral del Risco | 426 | $4,409 | $702.37 | 32% |
| Higuera Blanca | 33 | $4,340 | $603.84 | 29% |
| Tapalpa Country Club | 13 | $2,558 | $372.99 | 31% |
| Boca de Tomatlán | 276 | $2,486 | $344.01 | 36% |
| Litibu | 16 | $2,222 | $255.60 | 39% |
| Cruz de Huanacaxtle | 14 | $2,156 | $378.26 | 30% |
| San Juan Cosalá | 97 | $2,085 | $259.66 | 29% |
| Sayulita | 1,465 | $2,003 | $242.17 | 38% |