San Juan de los Lagos Airbnb Market Analysis 2026: Short Term Rental Data & Vacation Rental Statistics in Jalisco, Mexico
Is Airbnb profitable in San Juan de los Lagos in 2026? Explore comprehensive Airbnb analytics for San Juan de los Lagos, Jalisco, Mexico to uncover income potential. This 2026 STR market report for San Juan de los Lagos, based on AirROI data from February 2025 to January 2026, reveals key trends in the niche market of 102 active listings.
Whether you're considering an Airbnb investment in San Juan de los Lagos, optimizing your existing vacation rental, or exploring rental arbitrage opportunities, understanding the San Juan de los Lagos Airbnb data is crucial. Leveraging the low regulation environment is key to maximizing your short term rental income potential. Let's dive into the specifics.
Key San Juan de los Lagos Airbnb Performance Metrics Overview
Monthly Airbnb Revenue Variations & Income Potential in San Juan de los Lagos (2026)
Understanding the monthly revenue variations for Airbnb listings in San Juan de los Lagos is key to maximizing your short term rental income potential. Seasonality significantly impacts earnings. Our analysis, based on data from the past 12 months, shows that the peak revenue month for STRs in San Juan de los Lagos is typically December, while May often presents the lowest earnings, highlighting opportunities for strategic pricing adjustments during shoulder and low seasons. Explore the typical Airbnb income in San Juan de los Lagos across different performance tiers:
- Best-in-class properties (Top 10%) achieve $1,622+ monthly, often utilizing dynamic pricing and superior guest experiences.
- Strong performing properties (Top 25%) earn $929 or more, indicating effective management and desirable locations/amenities.
- Typical properties (Median) generate around $502 per month, representing the average market performance.
- Entry-level properties (Bottom 25%) see earnings around $282, often with potential for optimization.
Average Monthly Airbnb Earnings Trend in San Juan de los Lagos
San Juan de los Lagos Airbnb Occupancy Rate Trends (2026)
Maximize your bookings by understanding the San Juan de los Lagos STR occupancy trends. Seasonal demand shifts significantly influence how often properties are booked. Typically, Decembersees the highest demand (peak season occupancy), while January experiences the lowest (low season). Effective strategies, like adjusting minimum stays or offering promotions, can boost occupancy during slower periods. Here's how different property tiers perform in San Juan de los Lagos:
- Best-in-class properties (Top 10%) achieve 56%+ occupancy, indicating high desirability and potentially optimized availability.
- Strong performing properties (Top 25%) maintain 37% or higher occupancy, suggesting good market fit and guest satisfaction.
- Typical properties (Median) have an occupancy rate around 19%.
- Entry-level properties (Bottom 25%) average 11% occupancy, potentially facing higher vacancy.
Average Monthly Occupancy Rate Trend in San Juan de los Lagos
Average Daily Rate (ADR) Airbnb Trends in San Juan de los Lagos (2026)
Effective short term rental pricing strategy in San Juan de los Lagos involves understanding monthly ADR fluctuations. The Average Daily Rate (ADR) for Airbnb in San Juan de los Lagos typically peaks in December and dips lowest during April. Leveraging Airbnb dynamic pricing tools or strategies based on this seasonality can significantly boost revenue. Here's a look at the typical nightly rates achieved:
- Best-in-class properties (Top 10%) command rates of $155+ per night, often due to premium features or locations.
- Strong performing properties (Top 25%) achieve nightly rates of $120 or more.
- Typical properties (Median) charge around $82 per night.
- Entry-level properties (Bottom 25%) earn around $56 per night.
Average Daily Rate (ADR) Trend by Month in San Juan de los Lagos
Get Live San Juan de los Lagos Market Intelligence 👇

Explore Real-time Analytics
Airbnb Seasonality Analysis & Trends in San Juan de los Lagos (2026)
Peak Season (December, November, October)
- Revenue averages $971 per month
- Occupancy rates average 31.1%
- Daily rates average $101
Shoulder Season
- Revenue averages $700 per month
- Occupancy maintains around 24.9%
- Daily rates hold near $93
Low Season (April, May, September)
- Revenue drops to average $636 per month
- Occupancy decreases to average 24.9%
- Daily rates adjust to average $91
Seasonality Insights for San Juan de los Lagos
- The Airbnb seasonality in San Juan de los Lagos shows highly seasonal trends requiring careful strategy. While the sections above show seasonal averages, it's also insightful to look at the extremes:
- During the high season, the absolute peak month showcases San Juan de los Lagos's highest earning potential, with monthly revenues capable of climbing to $1,162, occupancy reaching a high of 35.7%, and ADRs peaking at $103.
- Conversely, the slowest single month of the year, typically falling within the low season, marks the market's lowest point. In this month, revenue might dip to $623, occupancy could drop to 20.7%, and ADRs may adjust down to $87.
- Understanding both the seasonal averages and these monthly peaks and troughs in revenue, occupancy, and ADR is crucial for maximizing your Airbnb profit potential in San Juan de los Lagos.
Seasonal Strategies for Maximizing Profit
- Peak Season: Maximize revenue through premium pricing and potentially longer minimum stays. Ensure high availability.
- Low Season: Offer competitive pricing, special promotions (e.g., extended stay discounts), and flexible cancellation policies. Target off-season travelers like remote workers or budget-conscious guests.
- Shoulder Seasons: Implement dynamic pricing that balances peak and low rates. Target weekend travelers or specific events. Offer slightly more flexible terms than peak season.
- Regularly analyze your own performance against these San Juan de los Lagos seasonality benchmarks and adjust your pricing and availability strategy accordingly.
Best Areas for Airbnb Investment in San Juan de los Lagos (2026)
Exploring the top neighborhoods for short-term rentals in San Juan de los Lagos? This section highlights key areas, outlining why they are attractive for hosts and guests, along with notable local attractions. Consider these locations based on your target guest profile and investment strategy.
| Neighborhood / Area | Why Host Here? (Target Guests & Appeal) | Key Attractions & Landmarks |
|---|---|---|
| Centro Histórico | The historical center of San Juan de los Lagos, offering rich cultural experiences and historical landmarks. Ideal for travelers interested in local history and traditional events. | Basilica de San Juan de los Lagos, Plaza de Armas, Museo del Venerable, Templo del Calvario, Local artisan shops |
| San Miguel | A vibrant neighborhood known for its cultural festivities and friendly atmosphere. Popular among families and tourists looking to enjoy local cuisine and arts. | Parque de la San Miguel, Cafés and restaurants, Cultural festivals, Local markets, Artisan workshops |
| Lagos de Moreno Road | Accessible road area offering scenic views and proximity to nature. Great for those seeking a quieter stay while still being close to town amenities. | Natural parks, Outdoor excursions, Scenic viewpoints, Peaceful environment, Local wildlife |
| Colonia Del Valle | A residential area known for its tranquility and family-friendly environment. Attractive to visitors seeking comfort and a local vibe. | Neighborhood parks, Family-owned eateries, Shops and local markets, Cultural events, Health and wellness centers |
| El Parque | A family-friendly area with lots of green spaces and parks. Perfect for travelers with children or those looking to relax outdoors. | Parque del Cielo, Children's playgrounds, Walking trails, Community events, Picnic areas |
| Avenida Juárez | A main road with vibrant commercial activity, popular with those seeking shopping and dining experiences. Close to landmarks and easy access to transportation. | Shopping centers, Local dining, Cultural sites nearby, Public transport access, Vibrant street life |
| Colonia La Luz | A neighborhood that offers a more local experience, allowing visitors to immerse themselves in the everyday life of San Juan de los Lagos. | Local cafés, Markets, Community events, Quiet streets, Artisans at work |
| Río Verde | A picturesque area known for its natural landscapes and outdoor activities. Great for nature lovers looking for adventure close to urban amenities. | Hiking trails, Riverside activities, Scenic views, Wildlife observation, Outdoor sports |
Understanding Airbnb License Requirements & STR Laws in San Juan de los Lagos (2026)
While San Juan de los Lagos, Jalisco, Mexico currently shows low STR regulations, specific Airbnb license requirements might still exist or change. Always verify the latest short term rental regulations and Airbnb license requirements directly with local government authorities for San Juan de los Lagos to ensure full compliance before hosting.
(Source: AirROI data, 2026, finding no licensed listings among those analyzed)
Top Performing Airbnb Properties in San Juan de los Lagos (2026)
Benchmark your potential! Explore examples of top-performing Airbnb properties in San Juan de los Lagosbased on Trailing Twelve Month (TTM) revenue. Analyze their characteristics, revenue, occupancy rate, and ADR to understand what drives success in this market.
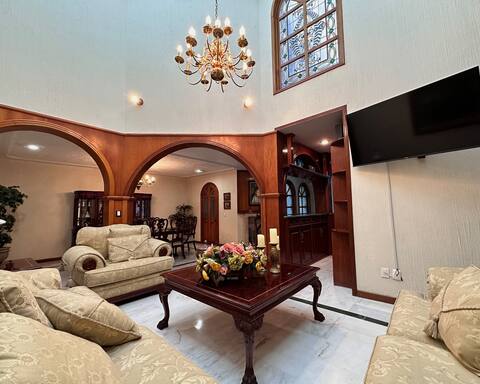
Your home in San Juan, near the Cathedral
Entire Place • 4 bedrooms

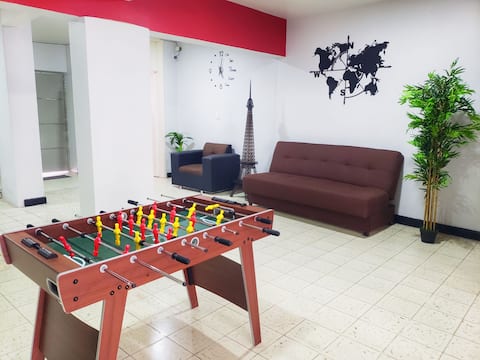
Beautiful apartment 10 steps away from the Cathedral
Entire Place • 4 bedrooms
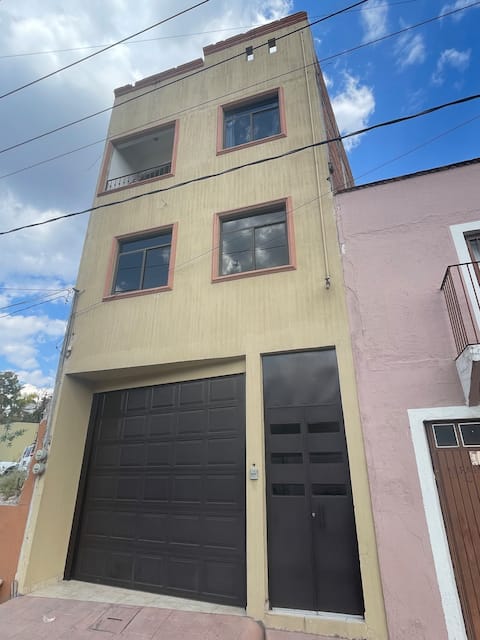
Casa Grande Completa, a few steps from the Cathedral.
Entire Place • 5 bedrooms

La Enramada (A)
Entire Place • 4 bedrooms

New, spacious apartment with an exclusive location
Entire Place • 4 bedrooms
Casa Solorza
Entire Place • 4 bedrooms
Note: Performance varies based on location, size, amenities, seasonality, and management quality. Data reflects the past 12 months.
Top Performing Airbnb Hosts in San Juan de los Lagos (2026)
Learn from the best! This table showcases top-performing Airbnb hosts in San Juan de los Lagos based on the number of properties managed and estimated total revenue over the past year. Analyze their scale and performance metrics.
| Host Name | Properties | Grossing Revenue | Stay Reviews | Avg Rating |
|---|---|---|---|---|
| Raul | 5 | $77,368 | 401 | 4.89/5.0 |
| David | 2 | $35,949 | 128 | 4.84/5.0 |
| Oscar | 1 | $34,277 | 77 | 4.99/5.0 |
| Yuliana | 5 | $34,221 | 448 | 4.87/5.0 |
| Leticia | 2 | $33,381 | 179 | 4.91/5.0 |
| Angela | 1 | $31,665 | 198 | 4.94/5.0 |
| Eduardo | 4 | $31,191 | 465 | 4.80/5.0 |
| Joanelly | 2 | $28,086 | 54 | 4.94/5.0 |
| Jessica | 4 | $27,334 | 93 | 4.34/5.0 |
| Dora Maria | 2 | $21,343 | 121 | 4.92/5.0 |
Analyzing the strategies of top hosts, such as their property selection, pricing, and guest communication, can offer valuable lessons for optimizing your own Airbnb operations in San Juan de los Lagos.
Dive Deeper: Advanced San Juan de los Lagos STR Market Data (2026)
Ready to unlock more insights? AirROI provides access to advanced metrics and comprehensive Airbnb data for San Juan de los Lagos. Explore detailed analytics beyond this report to refine your investment strategy, optimize pricing, and maximize your vacation rental profits.
Explore Advanced MetricsSan Juan de los Lagos Short-Term Rental Market Composition (2026): Property & Room Types
Room Type Distribution
Property Type Distribution
Market Composition Insights for San Juan de los Lagos
- The San Juan de los Lagos Airbnb market composition is heavily skewed towards Entire Home/Apt listings, which make up 91.2% of the 102 active rentals. This indicates strong guest preference for privacy and space.
- Looking at the property type distribution in San Juan de los Lagos, Apartment/Condo properties are the most common (54.9%), reflecting the local real estate landscape.
- Houses represent a significant 35.3% portion, catering likely to families or larger groups.
- The presence of 5.9% Hotel/Boutique listings indicates integration with traditional hospitality.
- Smaller segments like others, outdoor/unique (combined 3.9%) offer potential for unique stay experiences.
San Juan de los Lagos Airbnb Room Capacity Analysis (2026): Bedroom Distribution
Distribution of Listings by Number of Bedrooms
Room Capacity Insights for San Juan de los Lagos
- The dominant room capacity in San Juan de los Lagos is 2 bedrooms listings, making up 32.4% of the market. This suggests a strong demand for properties suitable for couples or solo travelers.
- Together, 2 bedrooms and 3 bedrooms properties represent 61.8% of the active Airbnb listings in San Juan de los Lagos, indicating a high concentration in these sizes.
- A significant 46.1% of listings offer 3+ bedrooms, catering to larger groups and families seeking more space in San Juan de los Lagos.
San Juan de los Lagos Vacation Rental Guest Capacity Trends (2026)
Distribution of Listings by Guest Capacity
Guest Capacity Insights for San Juan de los Lagos
- The most common guest capacity trend in San Juan de los Lagos vacation rentals is listings accommodating 8+ guests (36.3%). This suggests the primary traveler segment is likely larger groups.
- Properties designed for 8+ guests and 4 guests dominate the San Juan de los Lagos STR market, accounting for 59.8% of listings.
- 59.8% of properties accommodate 6+ guests, serving the market segment for larger families or group travel in San Juan de los Lagos.
- On average, properties in San Juan de los Lagos are equipped to host 5.7 guests.
San Juan de los Lagos Airbnb Booking Patterns (2026): Available vs. Booked Days
Available Days Distribution
Booked Days Distribution
Booking Pattern Insights for San Juan de los Lagos
- The most common availability pattern in San Juan de los Lagos falls within the 271-366 days range, representing 67.6% of listings. This suggests many properties have significant open periods on their calendars.
- Approximately 95.1% of listings show high availability (181+ days open annually), indicating potential for increased bookings or specific owner usage patterns.
- For booked days, the 31-90 days range is most frequent in San Juan de los Lagos (50%), reflecting common guest stay durations or potential owner blocking patterns.
- A notable 4.9% of properties secure long booking periods (181+ days booked per year), highlighting successful long-term rental strategies or significant owner usage.
San Juan de los Lagos Airbnb Minimum Stay Requirements Analysis
Distribution of Listings by Minimum Night Requirement
1 Night
94 listings
92.2% of total
2 Nights
5 listings
4.9% of total
30+ Nights
3 listings
2.9% of total
Key Insights
- The most prevalent minimum stay requirement in San Juan de los Lagos is 1 Night, adopted by 92.2% of listings. This highlights the market's preference for shorter, flexible bookings.
- A strong majority (97.1%) of the San Juan de los Lagos Airbnb data shows acceptance of very short stays (1-2 nights), indicating a dynamic, high-turnover market.
- Dedicated monthly rentals (30+ nights) represent a small niche (2.9%), possibly an untapped area for hosts.
Recommendations
- Align with the market by considering a 1 Night minimum stay, as 92.2% of San Juan de los Lagos hosts use this setting.
- Adjust minimum nights based on seasonality – potentially shorter during low season and longer during peak demand periods in San Juan de los Lagos.
San Juan de los Lagos Airbnb Cancellation Policy Trends Analysis (2026)
Limited
1 listings
1% of total
Flexible
48 listings
47.1% of total
Moderate
25 listings
24.5% of total
Firm
28 listings
27.5% of total
Cancellation Policy Insights for San Juan de los Lagos
- The prevailing Airbnb cancellation policy trend in San Juan de los Lagos is Flexible, used by 47.1% of listings.
- The market strongly favors guest-friendly terms, with 71.6% of listings offering Flexible or Moderate policies. This suggests guests in San Juan de los Lagos may expect booking flexibility.
Recommendations for Hosts
- Consider adopting a Flexible policy to align with the 47.1% market standard in San Juan de los Lagos.
- Regularly review your cancellation policy against competitors and market demand shifts in San Juan de los Lagos.
San Juan de los Lagos STR Booking Lead Time Analysis (2026)
Average Booking Lead Time by Month
Booking Lead Time Insights for San Juan de los Lagos
- The overall average booking lead time for vacation rentals in San Juan de los Lagos is 33 days.
- Guests book furthest in advance for stays during August (average 60 days), likely coinciding with peak travel demand or local events.
- The shortest booking windows occur for stays in March (average 16 days), indicating more last-minute travel plans during this time.
- Seasonally, Summer (35 days avg.) sees the longest lead times, while Spring (20 days avg.) has the shortest, reflecting typical travel planning cycles.
Recommendations for Hosts
- Use the overall average lead time (33 days) as a baseline for your pricing and availability strategy in San Juan de los Lagos.
- For August stays, consider implementing length-of-stay discounts or slightly higher rates for bookings made less than 60 days out to capitalize on advance planning.
- Target marketing efforts for the Summer season well in advance (at least 35 days) to capture early planners.
- Monitor your own booking lead times against these San Juan de los Lagos averages to identify opportunities for dynamic pricing adjustments.
Popular & Essential Airbnb Amenities in San Juan de los Lagos (2026)
Amenity Prevalence
Amenity Insights for San Juan de los Lagos
- Essential amenities in San Juan de los Lagos that guests expect include: Wifi, TV. Lacking these (any) could significantly impact bookings.
- Popular amenities like Hot water, Kitchen, Carbon monoxide alarm are common but not universal. Offering these can provide a competitive edge.
Recommendations for Hosts
- Ensure your listing includes all essential amenities for San Juan de los Lagos: Wifi, TV.
- Prioritize adding missing essentials: TV.
- Consider adding popular differentiators like Hot water or Kitchen to increase appeal.
- Highlight unique or less common amenities you offer (e.g., hot tub, dedicated workspace, EV charger) in your listing description and photos.
- Regularly check competitor amenities in San Juan de los Lagos to stay competitive.
San Juan de los Lagos Airbnb Guest Demographics & Profile Analysis (2026)
Guest Profile Summary for San Juan de los Lagos
- The typical guest profile for Airbnb in San Juan de los Lagos consists of primarily domestic travelers (88%), often arriving from nearby Mexico City, typically belonging to the Post-2000s (Gen Z/Alpha) group (50%), primarily speaking Spanish or English.
- Domestic travelers account for 88.0% of guests.
- Key international markets include Mexico (88%) and United States (11%).
- Top languages spoken are Spanish (65.7%) followed by English (30.8%).
- A significant demographic segment is the Post-2000s (Gen Z/Alpha) group, representing 50% of guests.
Recommendations for Hosts
- Target domestic marketing efforts towards travelers from Mexico City and Guadalajara.
- Tailor amenities and listing descriptions to appeal to the dominant Post-2000s (Gen Z/Alpha) demographic (e.g., highlight fast WiFi, smart home features, local guides).
- Highlight unique local experiences or amenities relevant to the primary guest profile.
- Consider seasonal promotions aligned with peak travel times for key origin markets.
Nearby Short-Term Rental Market Comparison
How does the San Juan de los Lagos Airbnb market stack up against its neighbors? Compare key performance metrics like average monthly revenue, ADR, and occupancy rates in surrounding areas to understand the broader regional STR landscape.
| Market | Active Properties | Monthly Revenue | Daily Rate | Avg. Occupancy |
|---|---|---|---|---|
| San Juan Cosalá | 97 | $2,085 | $259.66 | 29% |
| La Calera | 25 | $1,725 | $227.68 | 29% |
| San Pedro Tesistán | 13 | $1,669 | $306.69 | 25% |
| Cajititlán | 27 | $1,663 | $216.62 | 26% |
| San Miguel | 36 | $1,487 | $280.59 | 20% |
| Lomas de Comanjilla | 21 | $1,382 | $183.03 | 27% |
| San Luis Soyatlán | 21 | $1,120 | $184.09 | 22% |
| Ixtlahuacán de los Membrillos | 38 | $1,089 | $195.63 | 25% |
| San Nicolás de Ibarra | 11 | $1,062 | $188.84 | 29% |
| San Antonio Tlayacapan | 74 | $1,061 | $117.39 | 36% |