Lagos de Moreno Airbnb Market Analysis 2026: Short Term Rental Data & Vacation Rental Statistics in Jalisco, Mexico
Is Airbnb profitable in Lagos de Moreno in 2026? Explore comprehensive Airbnb analytics for Lagos de Moreno, Jalisco, Mexico to uncover income potential. This 2026 STR market report for Lagos de Moreno, based on AirROI data from February 2025 to January 2026, reveals key trends in the niche market of 134 active listings.
Whether you're considering an Airbnb investment in Lagos de Moreno, optimizing your existing vacation rental, or exploring rental arbitrage opportunities, understanding the Lagos de Moreno Airbnb data is crucial. Leveraging the low regulation environment is key to maximizing your short term rental income potential. Let's dive into the specifics.
Key Lagos de Moreno Airbnb Performance Metrics Overview
Monthly Airbnb Revenue Variations & Income Potential in Lagos de Moreno (2026)
Understanding the monthly revenue variations for Airbnb listings in Lagos de Moreno is key to maximizing your short term rental income potential. Seasonality significantly impacts earnings. Our analysis, based on data from the past 12 months, shows that the peak revenue month for STRs in Lagos de Moreno is typically July, while February often presents the lowest earnings, highlighting opportunities for strategic pricing adjustments during shoulder and low seasons. Explore the typical Airbnb income in Lagos de Moreno across different performance tiers:
- Best-in-class properties (Top 10%) achieve $1,162+ monthly, often utilizing dynamic pricing and superior guest experiences.
- Strong performing properties (Top 25%) earn $728 or more, indicating effective management and desirable locations/amenities.
- Typical properties (Median) generate around $407 per month, representing the average market performance.
- Entry-level properties (Bottom 25%) see earnings around $193, often with potential for optimization.
Average Monthly Airbnb Earnings Trend in Lagos de Moreno
Lagos de Moreno Airbnb Occupancy Rate Trends (2026)
Maximize your bookings by understanding the Lagos de Moreno STR occupancy trends. Seasonal demand shifts significantly influence how often properties are booked. Typically, Decembersees the highest demand (peak season occupancy), while May experiences the lowest (low season). Effective strategies, like adjusting minimum stays or offering promotions, can boost occupancy during slower periods. Here's how different property tiers perform in Lagos de Moreno:
- Best-in-class properties (Top 10%) achieve 65%+ occupancy, indicating high desirability and potentially optimized availability.
- Strong performing properties (Top 25%) maintain 46% or higher occupancy, suggesting good market fit and guest satisfaction.
- Typical properties (Median) have an occupancy rate around 26%.
- Entry-level properties (Bottom 25%) average 13% occupancy, potentially facing higher vacancy.
Average Monthly Occupancy Rate Trend in Lagos de Moreno
Average Daily Rate (ADR) Airbnb Trends in Lagos de Moreno (2026)
Effective short term rental pricing strategy in Lagos de Moreno involves understanding monthly ADR fluctuations. The Average Daily Rate (ADR) for Airbnb in Lagos de Moreno typically peaks in October and dips lowest during February. Leveraging Airbnb dynamic pricing tools or strategies based on this seasonality can significantly boost revenue. Here's a look at the typical nightly rates achieved:
- Best-in-class properties (Top 10%) command rates of $115+ per night, often due to premium features or locations.
- Strong performing properties (Top 25%) achieve nightly rates of $69 or more.
- Typical properties (Median) charge around $46 per night.
- Entry-level properties (Bottom 25%) earn around $34 per night.
Average Daily Rate (ADR) Trend by Month in Lagos de Moreno
Get Live Lagos de Moreno Market Intelligence 👇

Explore Real-time Analytics
Airbnb Seasonality Analysis & Trends in Lagos de Moreno (2026)
Peak Season (July, December, November)
- Revenue averages $760 per month
- Occupancy rates average 36.2%
- Daily rates average $70
Shoulder Season
- Revenue averages $552 per month
- Occupancy maintains around 29.9%
- Daily rates hold near $68
Low Season (February, March, May)
- Revenue drops to average $434 per month
- Occupancy decreases to average 29.7%
- Daily rates adjust to average $63
Seasonality Insights for Lagos de Moreno
- The Airbnb seasonality in Lagos de Moreno shows moderate seasonality with distinct peak and low periods. While the sections above show seasonal averages, it's also insightful to look at the extremes:
- During the high season, the absolute peak month showcases Lagos de Moreno's highest earning potential, with monthly revenues capable of climbing to $796, occupancy reaching a high of 37.8%, and ADRs peaking at $73.
- Conversely, the slowest single month of the year, typically falling within the low season, marks the market's lowest point. In this month, revenue might dip to $416, occupancy could drop to 25.3%, and ADRs may adjust down to $62.
- Understanding both the seasonal averages and these monthly peaks and troughs in revenue, occupancy, and ADR is crucial for maximizing your Airbnb profit potential in Lagos de Moreno.
Seasonal Strategies for Maximizing Profit
- Peak Season: Maximize revenue through premium pricing and potentially longer minimum stays. Ensure high availability.
- Low Season: Offer competitive pricing, special promotions (e.g., extended stay discounts), and flexible cancellation policies. Target off-season travelers like remote workers or budget-conscious guests.
- Shoulder Seasons: Implement dynamic pricing that balances peak and low rates. Target weekend travelers or specific events. Offer slightly more flexible terms than peak season.
- Regularly analyze your own performance against these Lagos de Moreno seasonality benchmarks and adjust your pricing and availability strategy accordingly.
Best Areas for Airbnb Investment in Lagos de Moreno (2026)
Exploring the top neighborhoods for short-term rentals in Lagos de Moreno? This section highlights key areas, outlining why they are attractive for hosts and guests, along with notable local attractions. Consider these locations based on your target guest profile and investment strategy.
| Neighborhood / Area | Why Host Here? (Target Guests & Appeal) | Key Attractions & Landmarks |
|---|---|---|
| Centro Histórico | The historic center of Lagos de Moreno is rich in colonial architecture, cultural heritage, and vibrant local markets. A popular destination for tourists seeking to explore the history and charm of the town. | Parroquia de la Asunción, Plaza de Armas, Casa de la Cultura, Museum of the City, Templo de la Merced, Callejón del Diablo |
| Las Cañadas | A residential area known for its beautiful natural surroundings, offering tranquility and stunning views. Ideal for travelers looking for a peaceful retreat close to nature. | Lago de los Patos, Cañadas de Lagos Park, Scenic hiking trails, Bird watching opportunities |
| El Salto | A picturesque area famous for its waterfalls and natural beauty, attracting nature lovers and adventure seekers. Offers a unique blend of relaxation and outdoor activities. | Salto del Nogal Waterfall, Hiking routes, Picnic areas, Nature photography spots |
| Jardin de los Héroes | A vibrant neighborhood with gardens and recreational areas, perfect for families and those seeking a place to enjoy outdoor activities. Close to local restaurants and shops. | Jardin de los Héroes Park, Local markets, Cafes, Restaurants |
| Lagos de Moreno Park | A family-friendly area with parks and recreational facilities. Great for hosting families looking for nearby activities and entertainment. | Lagos de Moreno Park, Children's playgrounds, Sports fields, Family-friendly restaurants |
| Colonia La Cruz | A growing neighborhood with modern amenities, close to major roads and convenient for visitors traveling to nearby attractions. Appeals to business travelers as well. | Shopping centers, Public transport access, Nearby restaurants, Gym facilities |
| Tierra Blanca | A serene locality known for its agricultural surroundings and rural charm, perfect for guests seeking an authentic local experience away from city life. | Organic farms, Local artisanal shops, Natural landscapes, Community events |
| Chalchihuitlán | A quieter neighborhood with beautiful natural views and opportunities for rural tourism. Appeals to visitors who enjoy peace and nature. | Scenic viewpoints, Local hiking trails, Cultural experiences with locals |
Understanding Airbnb License Requirements & STR Laws in Lagos de Moreno (2026)
While Lagos de Moreno, Jalisco, Mexico currently shows low STR regulations, specific Airbnb license requirements might still exist or change. Always verify the latest short term rental regulations and Airbnb license requirements directly with local government authorities for Lagos de Moreno to ensure full compliance before hosting.
(Source: AirROI data, 2026, finding no licensed listings among those analyzed)
Top Performing Airbnb Properties in Lagos de Moreno (2026)
Benchmark your potential! Explore examples of top-performing Airbnb properties in Lagos de Morenobased on Trailing Twelve Month (TTM) revenue. Analyze their characteristics, revenue, occupancy rate, and ADR to understand what drives success in this market.

Amazing house! Near the park
Entire Place • 4 bedrooms
DAMIANA: 10 PEOPLE W/ BREAKFAST À LA CARTE
Entire Place • 4 bedrooms
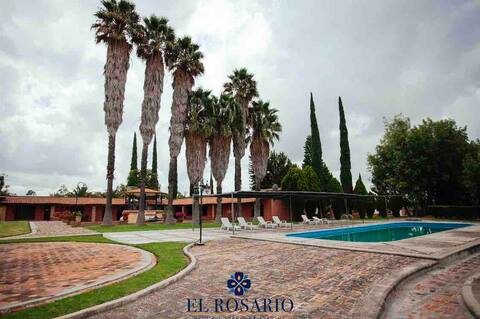
Quinta El Rosario, a wonderful place
Entire Place • 6 bedrooms

Milan Apartment!
Entire Place • 3 bedrooms

Depa Min, downtown area with parking
Entire Place • 2 bedrooms
Benji apartments downtown with parking
Entire Place • 4 bedrooms
Note: Performance varies based on location, size, amenities, seasonality, and management quality. Data reflects the past 12 months.
Top Performing Airbnb Hosts in Lagos de Moreno (2026)
Learn from the best! This table showcases top-performing Airbnb hosts in Lagos de Moreno based on the number of properties managed and estimated total revenue over the past year. Analyze their scale and performance metrics.
| Host Name | Properties | Grossing Revenue | Stay Reviews | Avg Rating |
|---|---|---|---|---|
| Equipo De Recepción | 9 | $55,228 | 212 | 4.73/5.0 |
| Patsi Dayana | 7 | $54,725 | 237 | 4.93/5.0 |
| Mariela | 6 | $48,902 | 549 | 4.94/5.0 |
| Carlos | 26 | $45,822 | 748 | 4.81/5.0 |
| Paulina | 4 | $32,689 | 269 | 4.93/5.0 |
| Dani Y Mau | 4 | $26,420 | 885 | 4.78/5.0 |
| Nidia | 1 | $25,234 | 22 | 4.82/5.0 |
| Ana Laura | 4 | $22,938 | 487 | 4.91/5.0 |
| Héctor | 1 | $19,950 | 22 | 4.86/5.0 |
| Martha | 6 | $18,595 | 329 | 4.70/5.0 |
Analyzing the strategies of top hosts, such as their property selection, pricing, and guest communication, can offer valuable lessons for optimizing your own Airbnb operations in Lagos de Moreno.
Dive Deeper: Advanced Lagos de Moreno STR Market Data (2026)
Ready to unlock more insights? AirROI provides access to advanced metrics and comprehensive Airbnb data for Lagos de Moreno. Explore detailed analytics beyond this report to refine your investment strategy, optimize pricing, and maximize your vacation rental profits.
Explore Advanced MetricsLagos de Moreno Short-Term Rental Market Composition (2026): Property & Room Types
Room Type Distribution
Property Type Distribution
Market Composition Insights for Lagos de Moreno
- The Lagos de Moreno Airbnb market composition is heavily skewed towards Entire Home/Apt listings, which make up 70.1% of the 134 active rentals. This indicates strong guest preference for privacy and space.
- Looking at the property type distribution in Lagos de Moreno, Apartment/Condo properties are the most common (44.8%), reflecting the local real estate landscape.
- Houses represent a significant 32.1% portion, catering likely to families or larger groups.
- The presence of 18.7% Hotel/Boutique listings indicates integration with traditional hospitality.
- Smaller segments like outdoor/unique, others, unique stays (combined 4.4%) offer potential for unique stay experiences.
Lagos de Moreno Airbnb Room Capacity Analysis (2026): Bedroom Distribution
Distribution of Listings by Number of Bedrooms
Room Capacity Insights for Lagos de Moreno
- The dominant room capacity in Lagos de Moreno is 1 bedroom listings, making up 33.6% of the market. This suggests a strong demand for properties suitable for couples or solo travelers.
- Together, 1 bedroom and 2 bedrooms properties represent 65.7% of the active Airbnb listings in Lagos de Moreno, indicating a high concentration in these sizes.
- A significant 23.9% of listings offer 3+ bedrooms, catering to larger groups and families seeking more space in Lagos de Moreno.
Lagos de Moreno Vacation Rental Guest Capacity Trends (2026)
Distribution of Listings by Guest Capacity
Guest Capacity Insights for Lagos de Moreno
- The most common guest capacity trend in Lagos de Moreno vacation rentals is listings accommodating 4 guests (26.9%). This suggests the primary traveler segment is likely small families or groups.
- Properties designed for 4 guests and 2 guests dominate the Lagos de Moreno STR market, accounting for 47.0% of listings.
- 26.8% of properties accommodate 6+ guests, serving the market segment for larger families or group travel in Lagos de Moreno.
- On average, properties in Lagos de Moreno are equipped to host 4.0 guests.
Lagos de Moreno Airbnb Booking Patterns (2026): Available vs. Booked Days
Available Days Distribution
Booked Days Distribution
Booking Pattern Insights for Lagos de Moreno
- The most common availability pattern in Lagos de Moreno falls within the 271-366 days range, representing 67.9% of listings. This suggests many properties have significant open periods on their calendars.
- Approximately 93.3% of listings show high availability (181+ days open annually), indicating potential for increased bookings or specific owner usage patterns.
- For booked days, the 31-90 days range is most frequent in Lagos de Moreno (37.3%), reflecting common guest stay durations or potential owner blocking patterns.
- A notable 9.7% of properties secure long booking periods (181+ days booked per year), highlighting successful long-term rental strategies or significant owner usage.
Lagos de Moreno Airbnb Minimum Stay Requirements Analysis
Distribution of Listings by Minimum Night Requirement
1 Night
124 listings
92.5% of total
2 Nights
4 listings
3% of total
30+ Nights
6 listings
4.5% of total
Key Insights
- The most prevalent minimum stay requirement in Lagos de Moreno is 1 Night, adopted by 92.5% of listings. This highlights the market's preference for shorter, flexible bookings.
- A strong majority (95.5%) of the Lagos de Moreno Airbnb data shows acceptance of very short stays (1-2 nights), indicating a dynamic, high-turnover market.
Recommendations
- Align with the market by considering a 1 Night minimum stay, as 92.5% of Lagos de Moreno hosts use this setting.
- Adjust minimum nights based on seasonality – potentially shorter during low season and longer during peak demand periods in Lagos de Moreno.
Lagos de Moreno Airbnb Cancellation Policy Trends Analysis (2026)
Limited
1 listings
0.7% of total
Flexible
56 listings
41.8% of total
Moderate
59 listings
44% of total
Firm
18 listings
13.4% of total
Cancellation Policy Insights for Lagos de Moreno
- The prevailing Airbnb cancellation policy trend in Lagos de Moreno is Moderate, used by 44% of listings.
- The market strongly favors guest-friendly terms, with 85.8% of listings offering Flexible or Moderate policies. This suggests guests in Lagos de Moreno may expect booking flexibility.
Recommendations for Hosts
- Consider adopting a Moderate policy to align with the 44% market standard in Lagos de Moreno.
- Regularly review your cancellation policy against competitors and market demand shifts in Lagos de Moreno.
Lagos de Moreno STR Booking Lead Time Analysis (2026)
Average Booking Lead Time by Month
Booking Lead Time Insights for Lagos de Moreno
- The overall average booking lead time for vacation rentals in Lagos de Moreno is 22 days.
- Guests book furthest in advance for stays during November (average 31 days), likely coinciding with peak travel demand or local events.
- The shortest booking windows occur for stays in February (average 9 days), indicating more last-minute travel plans during this time.
- Seasonally, Summer (22 days avg.) sees the longest lead times, while Winter (16 days avg.) has the shortest, reflecting typical travel planning cycles.
Recommendations for Hosts
- Use the overall average lead time (22 days) as a baseline for your pricing and availability strategy in Lagos de Moreno.
- During February, focus on last-minute booking availability and promotions, as guests book with very short notice (9 days avg.).
- Target marketing efforts for the Summer season well in advance (at least 22 days) to capture early planners.
- Monitor your own booking lead times against these Lagos de Moreno averages to identify opportunities for dynamic pricing adjustments.
Popular & Essential Airbnb Amenities in Lagos de Moreno (2026)
Amenity Prevalence
Amenity Insights for Lagos de Moreno
- Essential amenities in Lagos de Moreno that guests expect include: Wifi. Lacking these (this) could significantly impact bookings.
- Popular amenities like TV, Hot water, Kitchen are common but not universal. Offering these can provide a competitive edge.
Recommendations for Hosts
- Ensure your listing includes all essential amenities for Lagos de Moreno: Wifi.
- Prioritize adding missing essentials: Wifi.
- Consider adding popular differentiators like TV or Hot water to increase appeal.
- Highlight unique or less common amenities you offer (e.g., hot tub, dedicated workspace, EV charger) in your listing description and photos.
- Regularly check competitor amenities in Lagos de Moreno to stay competitive.
Lagos de Moreno Airbnb Guest Demographics & Profile Analysis (2026)
Guest Profile Summary for Lagos de Moreno
- The typical guest profile for Airbnb in Lagos de Moreno consists of primarily domestic travelers (89%), often arriving from nearby Guadalajara, typically belonging to the Post-2000s (Gen Z/Alpha) group (50%), primarily speaking Spanish or English.
- Domestic travelers account for 89.0% of guests.
- Key international markets include Mexico (89%) and United States (8.8%).
- Top languages spoken are Spanish (58.8%) followed by English (33.1%).
- A significant demographic segment is the Post-2000s (Gen Z/Alpha) group, representing 50% of guests.
Recommendations for Hosts
- Target domestic marketing efforts towards travelers from Guadalajara and Mexico City.
- Tailor amenities and listing descriptions to appeal to the dominant Post-2000s (Gen Z/Alpha) demographic (e.g., highlight fast WiFi, smart home features, local guides).
- Highlight unique local experiences or amenities relevant to the primary guest profile.
- Consider seasonal promotions aligned with peak travel times for key origin markets.
Nearby Short-Term Rental Market Comparison
How does the Lagos de Moreno Airbnb market stack up against its neighbors? Compare key performance metrics like average monthly revenue, ADR, and occupancy rates in surrounding areas to understand the broader regional STR landscape.
| Market | Active Properties | Monthly Revenue | Daily Rate | Avg. Occupancy |
|---|---|---|---|---|
| Alcocer | 11 | $1,642 | $271.32 | 21% |
| San Miguel de Allende | 2,169 | $1,470 | $194.10 | 32% |
| Lomas de Comanjilla | 21 | $1,382 | $183.03 | 27% |
| Cañajo | 40 | $1,005 | $144.20 | 28% |
| Fraccionamiento Zirándaro | 10 | $1,002 | $101.05 | 34% |
| San Miguel | 11 | $998 | $120.23 | 25% |
| Héroes de León | 13 | $830 | $327.68 | 36% |
| El Refugio | 40 | $770 | $70.47 | 39% |
| Zibatá | 131 | $706 | $77.71 | 37% |
| San Isidro El Viejo | 15 | $702 | $95.79 | 33% |