La Manzanilla de la Paz Airbnb Market Analysis 2026: Short Term Rental Data & Vacation Rental Statistics in Jalisco, Mexico
Is Airbnb profitable in La Manzanilla de la Paz in 2026? Explore comprehensive Airbnb analytics for La Manzanilla de la Paz, Jalisco, Mexico to uncover income potential. This 2026 STR market report for La Manzanilla de la Paz, based on AirROI data from February 2025 to January 2026, reveals key trends in the niche market of 39 active listings.
Whether you're considering an Airbnb investment in La Manzanilla de la Paz, optimizing your existing vacation rental, or exploring rental arbitrage opportunities, understanding the La Manzanilla de la Paz Airbnb data is crucial. Leveraging the low regulation environment is key to maximizing your short term rental income potential. Let's dive into the specifics.
Key La Manzanilla de la Paz Airbnb Performance Metrics Overview
Monthly Airbnb Revenue Variations & Income Potential in La Manzanilla de la Paz (2026)
Understanding the monthly revenue variations for Airbnb listings in La Manzanilla de la Paz is key to maximizing your short term rental income potential. Seasonality significantly impacts earnings. Our analysis, based on data from the past 12 months, shows that the peak revenue month for STRs in La Manzanilla de la Paz is typically December, while June often presents the lowest earnings, highlighting opportunities for strategic pricing adjustments during shoulder and low seasons. Explore the typical Airbnb income in La Manzanilla de la Paz across different performance tiers:
- Best-in-class properties (Top 10%) achieve $1,311+ monthly, often utilizing dynamic pricing and superior guest experiences.
- Strong performing properties (Top 25%) earn $666 or more, indicating effective management and desirable locations/amenities.
- Typical properties (Median) generate around $287 per month, representing the average market performance.
- Entry-level properties (Bottom 25%) see earnings around $173, often with potential for optimization.
Average Monthly Airbnb Earnings Trend in La Manzanilla de la Paz
La Manzanilla de la Paz Airbnb Occupancy Rate Trends (2026)
Maximize your bookings by understanding the La Manzanilla de la Paz STR occupancy trends. Seasonal demand shifts significantly influence how often properties are booked. Typically, Decembersees the highest demand (peak season occupancy), while June experiences the lowest (low season). Effective strategies, like adjusting minimum stays or offering promotions, can boost occupancy during slower periods. Here's how different property tiers perform in La Manzanilla de la Paz:
- Best-in-class properties (Top 10%) achieve 27%+ occupancy, indicating high desirability and potentially optimized availability.
- Strong performing properties (Top 25%) maintain 19% or higher occupancy, suggesting good market fit and guest satisfaction.
- Typical properties (Median) have an occupancy rate around 12%.
- Entry-level properties (Bottom 25%) average 8% occupancy, potentially facing higher vacancy.
Average Monthly Occupancy Rate Trend in La Manzanilla de la Paz
Average Daily Rate (ADR) Airbnb Trends in La Manzanilla de la Paz (2026)
Effective short term rental pricing strategy in La Manzanilla de la Paz involves understanding monthly ADR fluctuations. The Average Daily Rate (ADR) for Airbnb in La Manzanilla de la Paz typically peaks in November and dips lowest during February. Leveraging Airbnb dynamic pricing tools or strategies based on this seasonality can significantly boost revenue. Here's a look at the typical nightly rates achieved:
- Best-in-class properties (Top 10%) command rates of $261+ per night, often due to premium features or locations.
- Strong performing properties (Top 25%) achieve nightly rates of $143 or more.
- Typical properties (Median) charge around $74 per night.
- Entry-level properties (Bottom 25%) earn around $58 per night.
Average Daily Rate (ADR) Trend by Month in La Manzanilla de la Paz
Get Live La Manzanilla de la Paz Market Intelligence 👇

Explore Real-time Analytics
Airbnb Seasonality Analysis & Trends in La Manzanilla de la Paz (2026)
Peak Season (December, July, November)
- Revenue averages $836 per month
- Occupancy rates average 19.5%
- Daily rates average $121
Shoulder Season
- Revenue averages $546 per month
- Occupancy maintains around 14.0%
- Daily rates hold near $118
Low Season (February, May, June)
- Revenue drops to average $315 per month
- Occupancy decreases to average 10.1%
- Daily rates adjust to average $116
Seasonality Insights for La Manzanilla de la Paz
- The Airbnb seasonality in La Manzanilla de la Paz shows highly seasonal trends requiring careful strategy. While the sections above show seasonal averages, it's also insightful to look at the extremes:
- During the high season, the absolute peak month showcases La Manzanilla de la Paz's highest earning potential, with monthly revenues capable of climbing to $1,175, occupancy reaching a high of 27.1%, and ADRs peaking at $122.
- Conversely, the slowest single month of the year, typically falling within the low season, marks the market's lowest point. In this month, revenue might dip to $261, occupancy could drop to 8.7%, and ADRs may adjust down to $115.
- Understanding both the seasonal averages and these monthly peaks and troughs in revenue, occupancy, and ADR is crucial for maximizing your Airbnb profit potential in La Manzanilla de la Paz.
Seasonal Strategies for Maximizing Profit
- Peak Season: Maximize revenue through premium pricing and potentially longer minimum stays. Ensure high availability.
- Low Season: Offer competitive pricing, special promotions (e.g., extended stay discounts), and flexible cancellation policies. Target off-season travelers like remote workers or budget-conscious guests.
- Shoulder Seasons: Implement dynamic pricing that balances peak and low rates. Target weekend travelers or specific events. Offer slightly more flexible terms than peak season.
- Regularly analyze your own performance against these La Manzanilla de la Paz seasonality benchmarks and adjust your pricing and availability strategy accordingly.
Best Areas for Airbnb Investment in La Manzanilla de la Paz (2026)
Exploring the top neighborhoods for short-term rentals in La Manzanilla de la Paz? This section highlights key areas, outlining why they are attractive for hosts and guests, along with notable local attractions. Consider these locations based on your target guest profile and investment strategy.
| Neighborhood / Area | Why Host Here? (Target Guests & Appeal) | Key Attractions & Landmarks |
|---|---|---|
| La Manzanilla Beach | Picturesque beach town known for its serene atmosphere, perfect for relaxation and enjoying nature. Attracts tourists who appreciate a laid-back coastal experience. | La Manzanilla Beach, Laguna de la Vida, Turtle Sanctuary, Los Cocos Beach, El Faro |
| Centro La Manzanilla | The vibrant center of La Manzanilla with local shops, eateries, and authentic Mexican culture. A great place for travelers looking to immerse themselves in local life. | Local Markets, Restaurants, Plaza de La Manzanilla, Art galleries, Street vendors |
| Boca de Iguanas | A nearby beach area known for its luxury accommodations and natural beauty. Popular with those seeking a more upscale lodging experience amid nature. | Boca de Iguanas Beach, Private Villas, Eco-friendly lodges, Nature Trails |
| Costa Alegre | A stunning stretch of coastline known for its beautiful beaches and resorts. A prime location for those looking to escape the city and enjoy beach life. | Costa Alegre Beaches, Diving Spots, Luxury Resorts, Surfing Locations |
| Tenacatita Bay | Known for its beautiful bay and water activities, it's perfect for families and adventurers alike. Attracts tourists who love to engage in water sports. | Tenacatita Beach, Snorkeling and Diving, Kayaking, Beachfront Restaurants |
| Melaque | A neighboring town with a charming atmosphere, attracting families and vacationers. Offers a variety of local amenities and scenic beaches. | Melaque Beach, Local Markets, Plaza de Melaque, Fishermen's Wharf |
| Barra de Navidad | A tourist spot with a lovely town center and nearby beaches. Offers a mix of cultural experiences and beach relaxation. | Barra de Navidad Beach, El Centro, Restaurants and Cafes, Historic Church |
| Chamela-Cuixmala Biosphere Reserve | A natural reserve providing eco-tourism experiences for nature lovers and outdoor enthusiasts. Attracts visitors interested in conservation and biodiversity. | Biosphere Reserve, Wildlife Viewing, Nature Walks, Eco-lodges |
Understanding Airbnb License Requirements & STR Laws in La Manzanilla de la Paz (2026)
While La Manzanilla de la Paz, Jalisco, Mexico currently shows low STR regulations, specific Airbnb license requirements might still exist or change. Always verify the latest short term rental regulations and Airbnb license requirements directly with local government authorities for La Manzanilla de la Paz to ensure full compliance before hosting.
(Source: AirROI data, 2026, finding no licensed listings among those analyzed)
Top Performing Airbnb Properties in La Manzanilla de la Paz (2026)
Benchmark your potential! Explore examples of top-performing Airbnb properties in La Manzanilla de la Pazbased on Trailing Twelve Month (TTM) revenue. Analyze their characteristics, revenue, occupancy rate, and ADR to understand what drives success in this market.
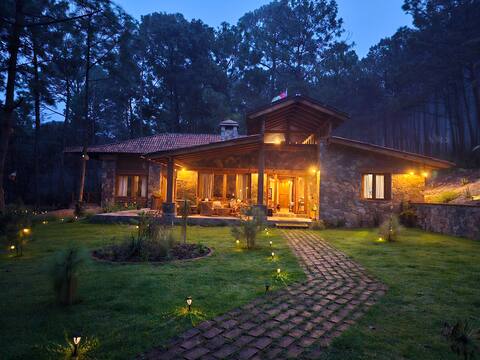
A nice house in the mountains of the forest
Entire Place • 3 bedrooms
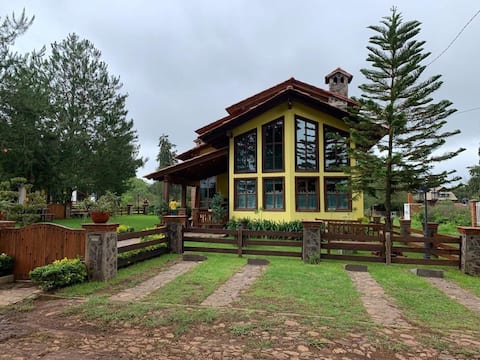
El Amanecer cabin
Entire Place • 5 bedrooms
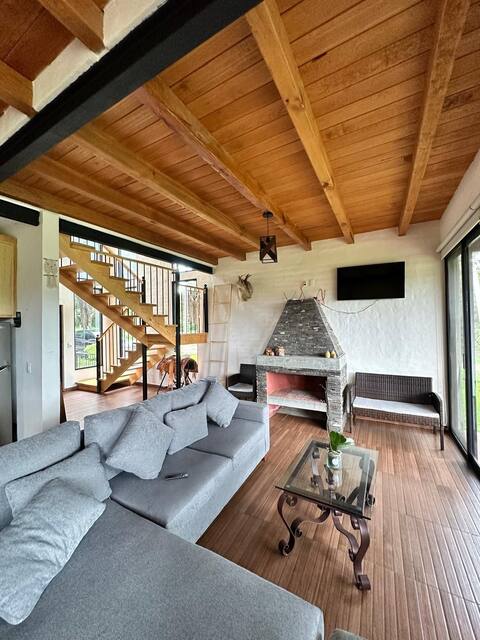
Star Cabin
Entire Place • 3 bedrooms

“MI CIELO” Cabin
Entire Place • 1 bedroom

CHIFLON VILLAS - COMPLETE COMPLEX
Entire Place • 14 bedrooms

El Cielo Cabins - Luna
Entire Place • 3 bedrooms
Note: Performance varies based on location, size, amenities, seasonality, and management quality. Data reflects the past 12 months.
Top Performing Airbnb Hosts in La Manzanilla de la Paz (2026)
Learn from the best! This table showcases top-performing Airbnb hosts in La Manzanilla de la Paz based on the number of properties managed and estimated total revenue over the past year. Analyze their scale and performance metrics.
| Host Name | Properties | Grossing Revenue | Stay Reviews | Avg Rating |
|---|---|---|---|---|
| Jaime | 2 | $38,097 | 37 | 4.83/5.0 |
| Janette | 4 | $26,813 | 30 | 4.81/5.0 |
| Dafne | 1 | $23,885 | 14 | 4.50/5.0 |
| Posada La Manzanilla | 10 | $19,194 | 72 | 4.78/5.0 |
| Rodrigo | 7 | $18,453 | 104 | 4.71/5.0 |
| Salvador | 2 | $12,718 | 41 | 4.94/5.0 |
| Sebastian | 1 | $8,598 | 21 | 4.90/5.0 |
| Ricardo | 4 | $7,334 | 12 | 4.88/5.0 |
| Iliana | 1 | $5,626 | 214 | 4.68/5.0 |
| Sergio | 2 | $4,719 | 43 | 4.45/5.0 |
Analyzing the strategies of top hosts, such as their property selection, pricing, and guest communication, can offer valuable lessons for optimizing your own Airbnb operations in La Manzanilla de la Paz.
Dive Deeper: Advanced La Manzanilla de la Paz STR Market Data (2026)
Ready to unlock more insights? AirROI provides access to advanced metrics and comprehensive Airbnb data for La Manzanilla de la Paz. Explore detailed analytics beyond this report to refine your investment strategy, optimize pricing, and maximize your vacation rental profits.
Explore Advanced MetricsLa Manzanilla de la Paz Short-Term Rental Market Composition (2026): Property & Room Types
Room Type Distribution
Property Type Distribution
Market Composition Insights for La Manzanilla de la Paz
- The La Manzanilla de la Paz Airbnb market composition is heavily skewed towards Entire Home/Apt listings, which make up 53.8% of the 39 active rentals. This indicates strong guest preference for privacy and space.
- However, a notable 46.2% share for Private Rooms suggests opportunities for budget-conscious travelers or hosts renting out spare rooms.
- Looking at the property type distribution in La Manzanilla de la Paz, Hotel/Boutique properties are the most common (43.6%), reflecting the local real estate landscape.
- The presence of 43.6% Hotel/Boutique listings indicates integration with traditional hospitality.
- Smaller segments like others (combined 2.6%) offer potential for unique stay experiences.
La Manzanilla de la Paz Airbnb Room Capacity Analysis (2026): Bedroom Distribution
Distribution of Listings by Number of Bedrooms
Room Capacity Insights for La Manzanilla de la Paz
- The dominant room capacity in La Manzanilla de la Paz is 1 bedroom listings, making up 48.7% of the market. This suggests a strong demand for properties suitable for couples or solo travelers.
- Together, 1 bedroom and 2 bedrooms properties represent 66.6% of the active Airbnb listings in La Manzanilla de la Paz, indicating a high concentration in these sizes.
- A significant 28.1% of listings offer 3+ bedrooms, catering to larger groups and families seeking more space in La Manzanilla de la Paz.
La Manzanilla de la Paz Vacation Rental Guest Capacity Trends (2026)
Distribution of Listings by Guest Capacity
Guest Capacity Insights for La Manzanilla de la Paz
- The most common guest capacity trend in La Manzanilla de la Paz vacation rentals is listings accommodating 2 guests (35.9%). This suggests the primary traveler segment is likely couples or solo travelers.
- Properties designed for 2 guests and 8+ guests dominate the La Manzanilla de la Paz STR market, accounting for 64.1% of listings.
- 35.9% of properties accommodate 6+ guests, serving the market segment for larger families or group travel in La Manzanilla de la Paz.
- On average, properties in La Manzanilla de la Paz are equipped to host 4.4 guests.
La Manzanilla de la Paz Airbnb Booking Patterns (2026): Available vs. Booked Days
Available Days Distribution
Booked Days Distribution
Booking Pattern Insights for La Manzanilla de la Paz
- The most common availability pattern in La Manzanilla de la Paz falls within the 271-366 days range, representing 97.4% of listings. This suggests many properties have significant open periods on their calendars.
- Approximately 100.0% of listings show high availability (181+ days open annually), indicating potential for increased bookings or specific owner usage patterns.
- For booked days, the 31-90 days range is most frequent in La Manzanilla de la Paz (48.7%), reflecting common guest stay durations or potential owner blocking patterns.
La Manzanilla de la Paz Airbnb Minimum Stay Requirements Analysis
Distribution of Listings by Minimum Night Requirement
1 Night
34 listings
87.2% of total
2 Nights
2 listings
5.1% of total
3 Nights
1 listings
2.6% of total
30+ Nights
2 listings
5.1% of total
Key Insights
- The most prevalent minimum stay requirement in La Manzanilla de la Paz is 1 Night, adopted by 87.2% of listings. This highlights the market's preference for shorter, flexible bookings.
- A strong majority (92.3%) of the La Manzanilla de la Paz Airbnb data shows acceptance of very short stays (1-2 nights), indicating a dynamic, high-turnover market.
Recommendations
- Align with the market by considering a 1 Night minimum stay, as 87.2% of La Manzanilla de la Paz hosts use this setting.
- Explore offering discounts for stays of 30+ nights to attract the 5.1% of the market seeking extended stays.
- Adjust minimum nights based on seasonality – potentially shorter during low season and longer during peak demand periods in La Manzanilla de la Paz.
La Manzanilla de la Paz Airbnb Cancellation Policy Trends Analysis (2026)
Limited
3 listings
7.7% of total
Flexible
21 listings
53.8% of total
Moderate
4 listings
10.3% of total
Firm
8 listings
20.5% of total
Strict
3 listings
7.7% of total
Cancellation Policy Insights for La Manzanilla de la Paz
- The prevailing Airbnb cancellation policy trend in La Manzanilla de la Paz is Flexible, used by 53.8% of listings.
- There's a relatively balanced mix between guest-friendly (64.1%) and stricter (28.2%) policies, offering choices for different guest needs.
- Strict cancellation policies are quite rare (7.7%), potentially making listings with this policy less competitive unless justified by high demand or property type.
Recommendations for Hosts
- Consider adopting a Flexible policy to align with the 53.8% market standard in La Manzanilla de la Paz.
- Given the high prevalence of Flexible policies (53.8%), offering this can enhance booking appeal, especially during shoulder seasons.
- Using a Strict policy might deter some guests, as only 7.7% of listings use it. Evaluate if potential revenue protection outweighs possible lower booking rates.
- Regularly review your cancellation policy against competitors and market demand shifts in La Manzanilla de la Paz.
La Manzanilla de la Paz STR Booking Lead Time Analysis (2026)
Average Booking Lead Time by Month
Booking Lead Time Insights for La Manzanilla de la Paz
- The overall average booking lead time for vacation rentals in La Manzanilla de la Paz is 44 days.
- Guests book furthest in advance for stays during April (average 84 days), likely coinciding with peak travel demand or local events.
- The shortest booking windows occur for stays in June (average 6 days), indicating more last-minute travel plans during this time.
- Seasonally, Spring (64 days avg.) sees the longest lead times, while Summer (20 days avg.) has the shortest, reflecting typical travel planning cycles.
Recommendations for Hosts
- Use the overall average lead time (44 days) as a baseline for your pricing and availability strategy in La Manzanilla de la Paz.
- For April stays, consider implementing length-of-stay discounts or slightly higher rates for bookings made less than 84 days out to capitalize on advance planning.
- During June, focus on last-minute booking availability and promotions, as guests book with very short notice (6 days avg.).
- Target marketing efforts for the Spring season well in advance (at least 64 days) to capture early planners.
- Monitor your own booking lead times against these La Manzanilla de la Paz averages to identify opportunities for dynamic pricing adjustments.
Popular & Essential Airbnb Amenities in La Manzanilla de la Paz (2026)
Amenity Prevalence
Amenity Insights for La Manzanilla de la Paz
- Essential amenities in La Manzanilla de la Paz that guests expect include: Free parking on premises. Lacking these (this) could significantly impact bookings.
- Popular amenities like Wifi, TV, Kitchen are common but not universal. Offering these can provide a competitive edge.
- Warning: Wifi is not universally provided but is considered essential globally. Ensure reliable Wifi is offered.
Recommendations for Hosts
- Ensure your listing includes all essential amenities for La Manzanilla de la Paz: Free parking on premises.
- Prioritize adding missing essentials: Free parking on premises.
- Consider adding popular differentiators like Wifi or TV to increase appeal.
- Highlight unique or less common amenities you offer (e.g., hot tub, dedicated workspace, EV charger) in your listing description and photos.
- Regularly check competitor amenities in La Manzanilla de la Paz to stay competitive.
La Manzanilla de la Paz Airbnb Guest Demographics & Profile Analysis (2026)
Guest Profile Summary for La Manzanilla de la Paz
- The typical guest profile for Airbnb in La Manzanilla de la Paz consists of primarily domestic travelers (95%), often arriving from nearby Guadalajara, typically belonging to the Post-2000s (Gen Z/Alpha) group (50%), primarily speaking Spanish or English.
- Domestic travelers account for 94.7% of guests.
- Key international markets include Mexico (94.7%) and United States (2.7%).
- Top languages spoken are Spanish (52.2%) followed by English (43.3%).
- A significant demographic segment is the Post-2000s (Gen Z/Alpha) group, representing 50% of guests.
Recommendations for Hosts
- Target domestic marketing efforts towards travelers from Guadalajara and Zapopan.
- Tailor amenities and listing descriptions to appeal to the dominant Post-2000s (Gen Z/Alpha) demographic (e.g., highlight fast WiFi, smart home features, local guides).
- Highlight unique local experiences or amenities relevant to the primary guest profile.
- Consider seasonal promotions aligned with peak travel times for key origin markets.
Nearby Short-Term Rental Market Comparison
How does the La Manzanilla de la Paz Airbnb market stack up against its neighbors? Compare key performance metrics like average monthly revenue, ADR, and occupancy rates in surrounding areas to understand the broader regional STR landscape.
| Market | Active Properties | Monthly Revenue | Daily Rate | Avg. Occupancy |
|---|---|---|---|---|
| Tapalpa Country Club | 13 | $2,558 | $372.99 | 31% |
| San Juan Cosalá | 97 | $2,085 | $259.66 | 29% |
| La Calera | 25 | $1,725 | $227.68 | 29% |
| San Pedro Tesistán | 13 | $1,669 | $306.69 | 25% |
| Cajititlán | 27 | $1,663 | $216.62 | 26% |
| San Miguel | 36 | $1,487 | $280.59 | 20% |
| La Manzanilla | 30 | $1,460 | $192.53 | 34% |
| La Huerta | 247 | $1,347 | $299.79 | 28% |
| Río de los Chilares | 14 | $1,244 | $179.16 | 28% |
| Tepec | 16 | $1,238 | $220.46 | 20% |