La Estacada Airbnb Market Analysis 2026: Short Term Rental Data & Vacation Rental Statistics in Jalisco, Mexico
Is Airbnb profitable in La Estacada in 2026? Explore comprehensive Airbnb analytics for La Estacada, Jalisco, Mexico to uncover income potential. This 2026 STR market report for La Estacada, based on AirROI data from February 2025 to January 2026, reveals key trends in the niche market of 99 active listings.
Whether you're considering an Airbnb investment in La Estacada, optimizing your existing vacation rental, or exploring rental arbitrage opportunities, understanding the La Estacada Airbnb data is crucial. Leveraging the low regulation environment is key to maximizing your short term rental income potential. Let's dive into the specifics.
Key La Estacada Airbnb Performance Metrics Overview
Monthly Airbnb Revenue Variations & Income Potential in La Estacada (2026)
Understanding the monthly revenue variations for Airbnb listings in La Estacada is key to maximizing your short term rental income potential. Seasonality significantly impacts earnings. Our analysis, based on data from the past 12 months, shows that the peak revenue month for STRs in La Estacada is typically December, while June often presents the lowest earnings, highlighting opportunities for strategic pricing adjustments during shoulder and low seasons. Explore the typical Airbnb income in La Estacada across different performance tiers:
- Best-in-class properties (Top 10%) achieve $1,596+ monthly, often utilizing dynamic pricing and superior guest experiences.
- Strong performing properties (Top 25%) earn $1,074 or more, indicating effective management and desirable locations/amenities.
- Typical properties (Median) generate around $619 per month, representing the average market performance.
- Entry-level properties (Bottom 25%) see earnings around $318, often with potential for optimization.
Average Monthly Airbnb Earnings Trend in La Estacada
La Estacada Airbnb Occupancy Rate Trends (2026)
Maximize your bookings by understanding the La Estacada STR occupancy trends. Seasonal demand shifts significantly influence how often properties are booked. Typically, Decembersees the highest demand (peak season occupancy), while June experiences the lowest (low season). Effective strategies, like adjusting minimum stays or offering promotions, can boost occupancy during slower periods. Here's how different property tiers perform in La Estacada:
- Best-in-class properties (Top 10%) achieve 41%+ occupancy, indicating high desirability and potentially optimized availability.
- Strong performing properties (Top 25%) maintain 27% or higher occupancy, suggesting good market fit and guest satisfaction.
- Typical properties (Median) have an occupancy rate around 15%.
- Entry-level properties (Bottom 25%) average 8% occupancy, potentially facing higher vacancy.
Average Monthly Occupancy Rate Trend in La Estacada
Average Daily Rate (ADR) Airbnb Trends in La Estacada (2026)
Effective short term rental pricing strategy in La Estacada involves understanding monthly ADR fluctuations. The Average Daily Rate (ADR) for Airbnb in La Estacada typically peaks in December and dips lowest during March. Leveraging Airbnb dynamic pricing tools or strategies based on this seasonality can significantly boost revenue. Here's a look at the typical nightly rates achieved:
- Best-in-class properties (Top 10%) command rates of $255+ per night, often due to premium features or locations.
- Strong performing properties (Top 25%) achieve nightly rates of $181 or more.
- Typical properties (Median) charge around $123 per night.
- Entry-level properties (Bottom 25%) earn around $98 per night.
Average Daily Rate (ADR) Trend by Month in La Estacada
Get Live La Estacada Market Intelligence 👇

Explore Real-time Analytics
Airbnb Seasonality Analysis & Trends in La Estacada (2026)
Peak Season (December, July, September)
- Revenue averages $1,099 per month
- Occupancy rates average 24.1%
- Daily rates average $157
Shoulder Season
- Revenue averages $779 per month
- Occupancy maintains around 19.7%
- Daily rates hold near $152
Low Season (March, May, June)
- Revenue drops to average $531 per month
- Occupancy decreases to average 15.3%
- Daily rates adjust to average $146
Seasonality Insights for La Estacada
- The Airbnb seasonality in La Estacada shows highly seasonal trends requiring careful strategy. While the sections above show seasonal averages, it's also insightful to look at the extremes:
- During the high season, the absolute peak month showcases La Estacada's highest earning potential, with monthly revenues capable of climbing to $1,434, occupancy reaching a high of 27.4%, and ADRs peaking at $170.
- Conversely, the slowest single month of the year, typically falling within the low season, marks the market's lowest point. In this month, revenue might dip to $524, occupancy could drop to 13.8%, and ADRs may adjust down to $143.
- Understanding both the seasonal averages and these monthly peaks and troughs in revenue, occupancy, and ADR is crucial for maximizing your Airbnb profit potential in La Estacada.
Seasonal Strategies for Maximizing Profit
- Peak Season: Maximize revenue through premium pricing and potentially longer minimum stays. Ensure high availability.
- Low Season: Offer competitive pricing, special promotions (e.g., extended stay discounts), and flexible cancellation policies. Target off-season travelers like remote workers or budget-conscious guests.
- Shoulder Seasons: Implement dynamic pricing that balances peak and low rates. Target weekend travelers or specific events. Offer slightly more flexible terms than peak season.
- Regularly analyze your own performance against these La Estacada seasonality benchmarks and adjust your pricing and availability strategy accordingly.
Best Areas for Airbnb Investment in La Estacada (2026)
Exploring the top neighborhoods for short-term rentals in La Estacada? This section highlights key areas, outlining why they are attractive for hosts and guests, along with notable local attractions. Consider these locations based on your target guest profile and investment strategy.
| Neighborhood / Area | Why Host Here? (Target Guests & Appeal) | Key Attractions & Landmarks |
|---|---|---|
| Centro Histórico de La Estacada | The historical center of La Estacada offers a glimpse into Mexican culture and architecture. It's a prime location for tourists wanting to explore local history and enjoy traditional Mexican cuisine. | Parroquia de San José, Museo de la Ciudad, Plaza Principal, Casa de la Cultura, Mercado Municipal |
| La Plazuela | Known for its vibrant local markets and charming plazas, La Plazuela is a great area for tourists looking to experience the local lifestyle, with plenty of shopping and dining options. | Mercado de La Plazuela, Cafés and restaurants, Artisan shops, Local festivals |
| Malecón de La Estacada | This waterfront area is perfect for guests who enjoy scenic views and recreational activities. The malecon is an inviting area for families and couples alike. | Scenic waterfront views, Parks and green spaces, Restaurants with local cuisine, Walking and biking paths |
| Las Joyas | A quieter neighborhood known for residential comfort, Las Joyas offers a peaceful retreat for those wanting to escape the busier areas while still being close to main attractions. | Local parks, Small cafes, Community events, Family-friendly spaces |
| Zona de Restaurantes | This area is the epicenter of dining in La Estacada, attracting food lovers eager to sample both traditional and contemporary Mexican dishes. | Top-rated restaurants, Culinary tours, Food festivals |
| El Mirador | Famous for its scenic views and panoramas of La Estacada, El Mirador is an ideal location for those who appreciate nature and outdoor activities. | Hiking trails, Observation points, Picnic areas |
| Barrio de los Artistas | An artistic neighborhood filled with galleries and studios, appealing to those looking for unique art and culture experiences. A hotspot for creative individuals. | Art galleries, Workshops, Cultural events, Exhibitions |
| Puente de La Estacada | This area combines natural beauty with local charm, making it attractive for visitors who want to enjoy recreational activities along the riverbank. | Riverbank walks, Fishing spots, Local picnics |
Understanding Airbnb License Requirements & STR Laws in La Estacada (2026)
While La Estacada, Jalisco, Mexico currently shows low STR regulations, specific Airbnb license requirements might still exist or change. Always verify the latest short term rental regulations and Airbnb license requirements directly with local government authorities for La Estacada to ensure full compliance before hosting.
(Source: AirROI data, 2026, based on 1% licensed listings)
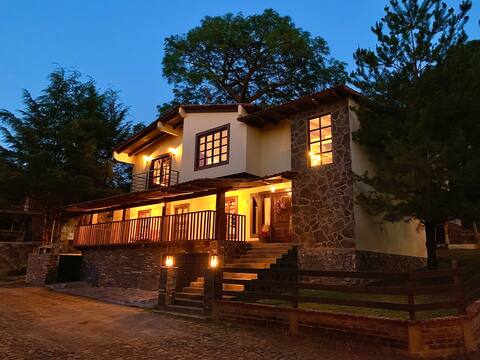
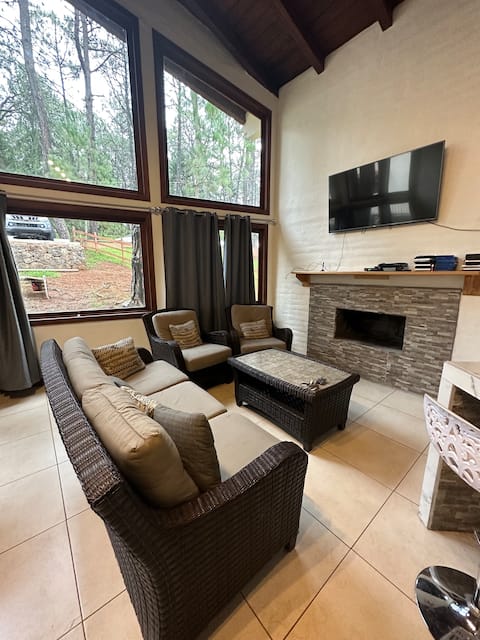
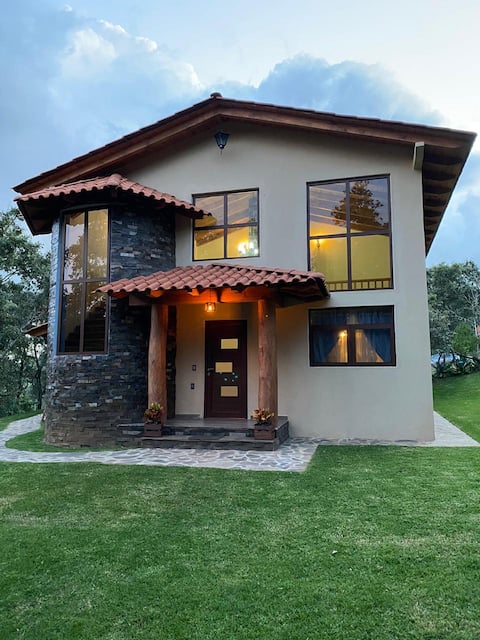
Top Performing Airbnb Properties in La Estacada (2026)
Benchmark your potential! Explore examples of top-performing Airbnb properties in La Estacadabased on Trailing Twelve Month (TTM) revenue. Analyze their characteristics, revenue, occupancy rate, and ADR to understand what drives success in this market.
Luxury Cabin in Residential Development
Entire Place • 4 bedrooms

El Roble Mazamitla Cabin
Entire Place • 4 bedrooms

Paso del Coyote Cabin 2
Entire Place • 3 bedrooms
The best location in Mazamitla.
Entire Place • 3 bedrooms
October's Moon Cabin
Entire Place • 3 bedrooms

Beautiful Cabin in Mazamitla
Entire Place • 3 bedrooms
Note: Performance varies based on location, size, amenities, seasonality, and management quality. Data reflects the past 12 months.
Top Performing Airbnb Hosts in La Estacada (2026)
Learn from the best! This table showcases top-performing Airbnb hosts in La Estacada based on the number of properties managed and estimated total revenue over the past year. Analyze their scale and performance metrics.
| Host Name | Properties | Grossing Revenue | Stay Reviews | Avg Rating |
|---|---|---|---|---|
| CabañasVenegas | 8 | $64,880 | 697 | 4.56/5.0 |
| Fernanda | 1 | $35,716 | 181 | 4.63/5.0 |
| Noe | 2 | $31,578 | 174 | 4.91/5.0 |
| Detalo | 4 | $30,836 | 48 | 4.76/5.0 |
| Miguel Angel | 2 | $30,419 | 169 | 4.68/5.0 |
| Sergio | 2 | $27,950 | 160 | 4.95/5.0 |
| Rich | 3 | $26,951 | 526 | 4.91/5.0 |
| Ma. Angeles | 6 | $23,070 | 258 | 4.62/5.0 |
| Alfredo Ruben | 3 | $17,547 | 23 | 4.93/5.0 |
| Omar | 1 | $17,236 | 70 | 4.79/5.0 |
Analyzing the strategies of top hosts, such as their property selection, pricing, and guest communication, can offer valuable lessons for optimizing your own Airbnb operations in La Estacada.
Dive Deeper: Advanced La Estacada STR Market Data (2026)
Ready to unlock more insights? AirROI provides access to advanced metrics and comprehensive Airbnb data for La Estacada. Explore detailed analytics beyond this report to refine your investment strategy, optimize pricing, and maximize your vacation rental profits.
Explore Advanced MetricsLa Estacada Short-Term Rental Market Composition (2026): Property & Room Types
Room Type Distribution
Property Type Distribution
Market Composition Insights for La Estacada
- The La Estacada Airbnb market composition is heavily skewed towards Entire Home/Apt listings, which make up 97% of the 99 active rentals. This indicates strong guest preference for privacy and space.
- Looking at the property type distribution in La Estacada, Outdoor/Unique properties are the most common (88.9%), reflecting the local real estate landscape.
- Smaller segments like apartment/condo, unique stays, hotel/boutique (combined 6.0%) offer potential for unique stay experiences.
La Estacada Airbnb Room Capacity Analysis (2026): Bedroom Distribution
Distribution of Listings by Number of Bedrooms
Room Capacity Insights for La Estacada
- The dominant room capacity in La Estacada is 1 bedroom listings, making up 36.4% of the market. This suggests a strong demand for properties suitable for couples or solo travelers.
- Together, 1 bedroom and 3 bedrooms properties represent 57.6% of the active Airbnb listings in La Estacada, indicating a high concentration in these sizes.
- A significant 42.4% of listings offer 3+ bedrooms, catering to larger groups and families seeking more space in La Estacada.
La Estacada Vacation Rental Guest Capacity Trends (2026)
Distribution of Listings by Guest Capacity
Guest Capacity Insights for La Estacada
- The most common guest capacity trend in La Estacada vacation rentals is listings accommodating 8+ guests (41.4%). This suggests the primary traveler segment is likely larger groups.
- Properties designed for 8+ guests and 2 guests dominate the La Estacada STR market, accounting for 63.6% of listings.
- 56.5% of properties accommodate 6+ guests, serving the market segment for larger families or group travel in La Estacada.
- On average, properties in La Estacada are equipped to host 5.5 guests.
La Estacada Airbnb Booking Patterns (2026): Available vs. Booked Days
Available Days Distribution
Booked Days Distribution
Booking Pattern Insights for La Estacada
- The most common availability pattern in La Estacada falls within the 271-366 days range, representing 84.8% of listings. This suggests many properties have significant open periods on their calendars.
- Approximately 100.0% of listings show high availability (181+ days open annually), indicating potential for increased bookings or specific owner usage patterns.
- For booked days, the 1-30 days range is most frequent in La Estacada (48.5%), reflecting common guest stay durations or potential owner blocking patterns.
La Estacada Airbnb Minimum Stay Requirements Analysis
Distribution of Listings by Minimum Night Requirement
1 Night
70 listings
70.7% of total
2 Nights
18 listings
18.2% of total
3 Nights
1 listings
1% of total
30+ Nights
10 listings
10.1% of total
Key Insights
- The most prevalent minimum stay requirement in La Estacada is 1 Night, adopted by 70.7% of listings. This highlights the market's preference for shorter, flexible bookings.
- A strong majority (88.9%) of the La Estacada Airbnb data shows acceptance of very short stays (1-2 nights), indicating a dynamic, high-turnover market.
- A significant segment (10.1%) caters to monthly stays (30+ nights) in La Estacada, pointing to opportunities in the extended-stay market.
Recommendations
- Align with the market by considering a 1 Night minimum stay, as 70.7% of La Estacada hosts use this setting.
- Explore offering discounts for stays of 30+ nights to attract the 10.1% of the market seeking extended stays.
- Adjust minimum nights based on seasonality – potentially shorter during low season and longer during peak demand periods in La Estacada.
La Estacada Airbnb Cancellation Policy Trends Analysis (2026)
Limited
5 listings
5.1% of total
Flexible
29 listings
29.3% of total
Moderate
26 listings
26.3% of total
Firm
24 listings
24.2% of total
Strict
15 listings
15.2% of total
Cancellation Policy Insights for La Estacada
- The prevailing Airbnb cancellation policy trend in La Estacada is Flexible, used by 29.3% of listings.
- There's a relatively balanced mix between guest-friendly (55.6%) and stricter (39.4%) policies, offering choices for different guest needs.
Recommendations for Hosts
- Consider adopting a Flexible policy to align with the 29.3% market standard in La Estacada.
- Regularly review your cancellation policy against competitors and market demand shifts in La Estacada.
La Estacada STR Booking Lead Time Analysis (2026)
Average Booking Lead Time by Month
Booking Lead Time Insights for La Estacada
- The overall average booking lead time for vacation rentals in La Estacada is 31 days.
- Guests book furthest in advance for stays during December (average 64 days), likely coinciding with peak travel demand or local events.
- The shortest booking windows occur for stays in June (average 8 days), indicating more last-minute travel plans during this time.
- Seasonally, Winter (34 days avg.) sees the longest lead times, while Summer (13 days avg.) has the shortest, reflecting typical travel planning cycles.
Recommendations for Hosts
- Use the overall average lead time (31 days) as a baseline for your pricing and availability strategy in La Estacada.
- For December stays, consider implementing length-of-stay discounts or slightly higher rates for bookings made less than 64 days out to capitalize on advance planning.
- During June, focus on last-minute booking availability and promotions, as guests book with very short notice (8 days avg.).
- Target marketing efforts for the Winter season well in advance (at least 34 days) to capture early planners.
- Monitor your own booking lead times against these La Estacada averages to identify opportunities for dynamic pricing adjustments.
Popular & Essential Airbnb Amenities in La Estacada (2026)
Amenity Prevalence
Amenity Insights for La Estacada
- Essential amenities in La Estacada that guests expect include: Kitchen. Lacking these (this) could significantly impact bookings.
- Popular amenities like Indoor fireplace, Free parking on premises, TV are common but not universal. Offering these can provide a competitive edge.
- Warning: Wifi is not universally provided but is considered essential globally. Ensure reliable Wifi is offered.
Recommendations for Hosts
- Ensure your listing includes all essential amenities for La Estacada: Kitchen.
- Prioritize adding missing essentials: Kitchen.
- Consider adding popular differentiators like Indoor fireplace or Free parking on premises to increase appeal.
- Highlight unique or less common amenities you offer (e.g., hot tub, dedicated workspace, EV charger) in your listing description and photos.
- Regularly check competitor amenities in La Estacada to stay competitive.
La Estacada Airbnb Guest Demographics & Profile Analysis (2026)
Guest Profile Summary for La Estacada
- The typical guest profile for Airbnb in La Estacada consists of primarily domestic travelers (93%), often arriving from nearby Guadalajara, typically belonging to the Post-2000s (Gen Z/Alpha) group (50%), primarily speaking Spanish or English.
- Domestic travelers account for 93.4% of guests.
- Key international markets include Mexico (93.4%) and United States (4.8%).
- Top languages spoken are Spanish (61.4%) followed by English (34.1%).
- A significant demographic segment is the Post-2000s (Gen Z/Alpha) group, representing 50% of guests.
Recommendations for Hosts
- Target domestic marketing efforts towards travelers from Guadalajara and Zapopan.
- Tailor amenities and listing descriptions to appeal to the dominant Post-2000s (Gen Z/Alpha) demographic (e.g., highlight fast WiFi, smart home features, local guides).
- Highlight unique local experiences or amenities relevant to the primary guest profile.
- Consider seasonal promotions aligned with peak travel times for key origin markets.
Nearby Short-Term Rental Market Comparison
How does the La Estacada Airbnb market stack up against its neighbors? Compare key performance metrics like average monthly revenue, ADR, and occupancy rates in surrounding areas to understand the broader regional STR landscape.
| Market | Active Properties | Monthly Revenue | Daily Rate | Avg. Occupancy |
|---|---|---|---|---|
| Tapalpa Country Club | 13 | $2,558 | $372.99 | 31% |
| San Juan Cosalá | 97 | $2,085 | $259.66 | 29% |
| La Calera | 25 | $1,725 | $227.68 | 29% |
| San Pedro Tesistán | 13 | $1,669 | $306.69 | 25% |
| Cajititlán | 27 | $1,663 | $216.62 | 26% |
| San Miguel | 36 | $1,487 | $280.59 | 20% |
| La Manzanilla | 30 | $1,460 | $192.53 | 34% |
| La Huerta | 247 | $1,347 | $299.79 | 28% |
| Río de los Chilares | 14 | $1,244 | $179.16 | 28% |
| Tepec | 16 | $1,238 | $220.46 | 20% |