El Llano de los Toros Airbnb Market Analysis 2026: Short Term Rental Data & Vacation Rental Statistics in Jalisco, Mexico
Is Airbnb profitable in El Llano de los Toros in 2026? Explore comprehensive Airbnb analytics for El Llano de los Toros, Jalisco, Mexico to uncover income potential. This 2026 STR market report for El Llano de los Toros, based on AirROI data from February 2025 to January 2026, reveals key trends in the niche market of 27 active listings.
Whether you're considering an Airbnb investment in El Llano de los Toros, optimizing your existing vacation rental, or exploring rental arbitrage opportunities, understanding the El Llano de los Toros Airbnb data is crucial. Leveraging the low regulation environment is key to maximizing your short term rental income potential. Let's dive into the specifics.
Key El Llano de los Toros Airbnb Performance Metrics Overview
Monthly Airbnb Revenue Variations & Income Potential in El Llano de los Toros (2026)
Understanding the monthly revenue variations for Airbnb listings in El Llano de los Toros is key to maximizing your short term rental income potential. Seasonality significantly impacts earnings. Our analysis, based on data from the past 12 months, shows that the peak revenue month for STRs in El Llano de los Toros is typically December, while March often presents the lowest earnings, highlighting opportunities for strategic pricing adjustments during shoulder and low seasons. Explore the typical Airbnb income in El Llano de los Toros across different performance tiers:
- Best-in-class properties (Top 10%) achieve $2,314+ monthly, often utilizing dynamic pricing and superior guest experiences.
- Strong performing properties (Top 25%) earn $1,058 or more, indicating effective management and desirable locations/amenities.
- Typical properties (Median) generate around $625 per month, representing the average market performance.
- Entry-level properties (Bottom 25%) see earnings around $354, often with potential for optimization.
Average Monthly Airbnb Earnings Trend in El Llano de los Toros
El Llano de los Toros Airbnb Occupancy Rate Trends (2026)
Maximize your bookings by understanding the El Llano de los Toros STR occupancy trends. Seasonal demand shifts significantly influence how often properties are booked. Typically, Decembersees the highest demand (peak season occupancy), while January experiences the lowest (low season). Effective strategies, like adjusting minimum stays or offering promotions, can boost occupancy during slower periods. Here's how different property tiers perform in El Llano de los Toros:
- Best-in-class properties (Top 10%) achieve 49%+ occupancy, indicating high desirability and potentially optimized availability.
- Strong performing properties (Top 25%) maintain 23% or higher occupancy, suggesting good market fit and guest satisfaction.
- Typical properties (Median) have an occupancy rate around 13%.
- Entry-level properties (Bottom 25%) average 8% occupancy, potentially facing higher vacancy.
Average Monthly Occupancy Rate Trend in El Llano de los Toros
Average Daily Rate (ADR) Airbnb Trends in El Llano de los Toros (2026)
Effective short term rental pricing strategy in El Llano de los Toros involves understanding monthly ADR fluctuations. The Average Daily Rate (ADR) for Airbnb in El Llano de los Toros typically peaks in December and dips lowest during April. Leveraging Airbnb dynamic pricing tools or strategies based on this seasonality can significantly boost revenue. Here's a look at the typical nightly rates achieved:
- Best-in-class properties (Top 10%) command rates of $268+ per night, often due to premium features or locations.
- Strong performing properties (Top 25%) achieve nightly rates of $197 or more.
- Typical properties (Median) charge around $136 per night.
- Entry-level properties (Bottom 25%) earn around $88 per night.
Average Daily Rate (ADR) Trend by Month in El Llano de los Toros
Get Live El Llano de los Toros Market Intelligence 👇

Explore Real-time Analytics
Airbnb Seasonality Analysis & Trends in El Llano de los Toros (2026)
Peak Season (December, September, August)
- Revenue averages $1,392 per month
- Occupancy rates average 25.2%
- Daily rates average $160
Shoulder Season
- Revenue averages $1,016 per month
- Occupancy maintains around 18.7%
- Daily rates hold near $158
Low Season (February, March, April)
- Revenue drops to average $785 per month
- Occupancy decreases to average 18.1%
- Daily rates adjust to average $143
Seasonality Insights for El Llano de los Toros
- The Airbnb seasonality in El Llano de los Toros shows highly seasonal trends requiring careful strategy. While the sections above show seasonal averages, it's also insightful to look at the extremes:
- During the high season, the absolute peak month showcases El Llano de los Toros's highest earning potential, with monthly revenues capable of climbing to $1,629, occupancy reaching a high of 29.4%, and ADRs peaking at $168.
- Conversely, the slowest single month of the year, typically falling within the low season, marks the market's lowest point. In this month, revenue might dip to $741, occupancy could drop to 15.8%, and ADRs may adjust down to $142.
- Understanding both the seasonal averages and these monthly peaks and troughs in revenue, occupancy, and ADR is crucial for maximizing your Airbnb profit potential in El Llano de los Toros.
Seasonal Strategies for Maximizing Profit
- Peak Season: Maximize revenue through premium pricing and potentially longer minimum stays. Ensure high availability.
- Low Season: Offer competitive pricing, special promotions (e.g., extended stay discounts), and flexible cancellation policies. Target off-season travelers like remote workers or budget-conscious guests.
- Shoulder Seasons: Implement dynamic pricing that balances peak and low rates. Target weekend travelers or specific events. Offer slightly more flexible terms than peak season.
- Regularly analyze your own performance against these El Llano de los Toros seasonality benchmarks and adjust your pricing and availability strategy accordingly.
Best Areas for Airbnb Investment in El Llano de los Toros (2026)
Exploring the top neighborhoods for short-term rentals in El Llano de los Toros? This section highlights key areas, outlining why they are attractive for hosts and guests, along with notable local attractions. Consider these locations based on your target guest profile and investment strategy.
| Neighborhood / Area | Why Host Here? (Target Guests & Appeal) | Key Attractions & Landmarks |
|---|---|---|
| Centro Histórico de Guadalajara | Cultural and historical heart of Jalisco, attracting tourists with its colonial architecture and vibrant atmosphere. A prime location for travelers seeking to explore the history and culture of Mexico. | Teatro Degollado, Cathedral of Guadalajara, Instituto Cultural Cabañas, Mercado San Juan de Dios, Plaza Tlaquepaque |
| Lago de Chapala | The largest lake in Mexico and a popular getaway for both locals and expats. Known for its scenic beauty and mild climate, making it a favorite for vacation rentals. | Ajijic, Chapala Malecon, Santos Degollado Theatre, Natural hot springs, Lake Chapala Boardwalk |
| Puerto Vallarta | A top tourist destination with beautiful beaches and a lively nightlife. Its thriving tourism market provides continuous demand for short-term rentals. | Malecón, Los Muertos Beach, Banderas Bay, Vallarta Botanical Gardens, El Centro |
| Tequila | Famous for producing the national drink of Mexico, Tequila offers unique experiences related to agave distilleries and rural tourism, attracting visitors interested in local culture. | Tequila distilleries, Museo Nacional del Tequila, Agave Landscape, Plaza Principal, El Hombre de Madera |
| Tlaquepaque | Known for its arts and crafts scene, this charming town attracts visitors looking for local artisan goods, food, and culture, perfect for a cozy Airbnb stay. | El Parian, Centro Cultural El Refugio, Andares, Templo de San Pedro, Museo Regional de Artes |
| Guadalajara Zoo | A well-known attraction in Guadalajara that draws families and tourists interested in wildlife, providing a good market for family-friendly rentals. | Guadalajara Zoo, Cerro del Cuatro, Parque de la Revolución, Plaza de la Bandera |
| Colonia Americana | A trendy urban district known for its vibrant nightlife, restaurants, and cultural spots, attracting young professionals and tourists looking for a lively atmosphere. | Paseo de Chapultepec, Casa-taller Jose Clemente Orozco, Cultural Institute of the West, Fonda de la Calle, Museo de las Artes de la Universidad de Guadalajara |
| San Sebastián del Oeste | A picturesque mountain town that offers stunning views and eco-tourism opportunities. Attracts nature lovers and those seeking relaxation in a tranquil setting. | Town's main square, Ecoturism trails, Old mining towns, Natural hot springs, Coffee plantations |
Understanding Airbnb License Requirements & STR Laws in El Llano de los Toros (2026)
While El Llano de los Toros, Jalisco, Mexico currently shows low STR regulations, specific Airbnb license requirements might still exist or change. Always verify the latest short term rental regulations and Airbnb license requirements directly with local government authorities for El Llano de los Toros to ensure full compliance before hosting.
(Source: AirROI data, 2026, finding no licensed listings among those analyzed)
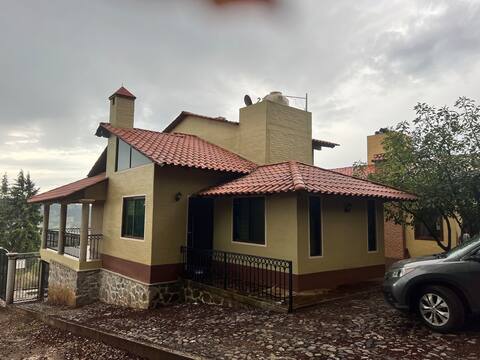
Top Performing Airbnb Properties in El Llano de los Toros (2026)
Benchmark your potential! Explore examples of top-performing Airbnb properties in El Llano de los Torosbased on Trailing Twelve Month (TTM) revenue. Analyze their characteristics, revenue, occupancy rate, and ADR to understand what drives success in this market.

Children's games, foosball, spacious gardens.
Entire Place • 5 bedrooms
Rincon de los Recuerdos Cabin
Entire Place • 4 bedrooms
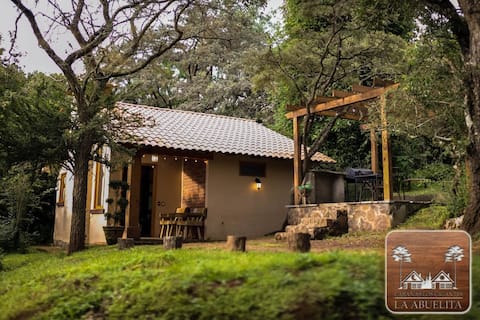
Los Gigantes "la Abuelita" Cabin
Entire Place • 1 bedroom
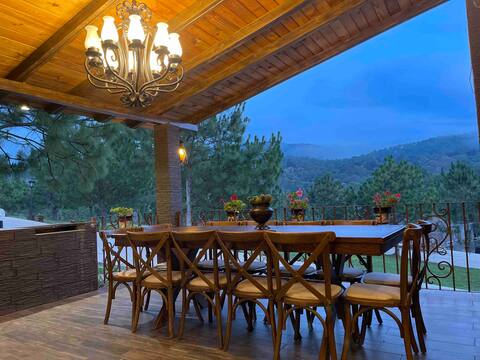
Puerta del Bosque Cabin, Mazamitla Jal
Entire Place • 3 bedrooms

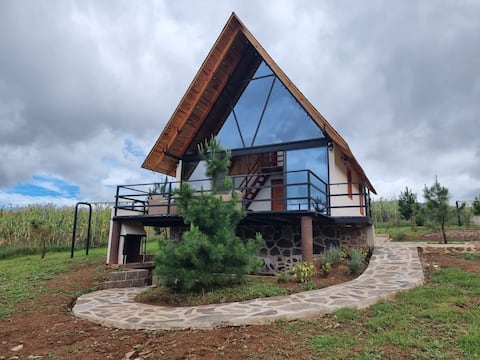
Flora Natura, Cabins. (1)
Entire Place • 7 bedrooms
Centauro Cabin
Entire Place • 2 bedrooms
Note: Performance varies based on location, size, amenities, seasonality, and management quality. Data reflects the past 12 months.
Top Performing Airbnb Hosts in El Llano de los Toros (2026)
Learn from the best! This table showcases top-performing Airbnb hosts in El Llano de los Toros based on the number of properties managed and estimated total revenue over the past year. Analyze their scale and performance metrics.
| Host Name | Properties | Grossing Revenue | Stay Reviews | Avg Rating |
|---|---|---|---|---|
| Blanca | 1 | $69,901 | 50 | 4.88/5.0 |
| Maria Gudalupe | 9 | $55,271 | 212 | 4.87/5.0 |
| Laura | 1 | $21,710 | 43 | 4.88/5.0 |
| Manuel | 2 | $20,111 | 58 | 4.84/5.0 |
| Eva | 4 | $15,907 | 69 | 4.63/5.0 |
| Francisco Javier | 2 | $13,991 | 223 | 4.34/5.0 |
| Ana Paulina | 2 | $9,261 | 61 | 4.25/5.0 |
| Giovanni Daniel | 1 | $8,594 | 8 | 4.50/5.0 |
| Adriana | 1 | $2,910 | 49 | 4.80/5.0 |
| Gerardo | 1 | $2,599 | 10 | 4.20/5.0 |
Analyzing the strategies of top hosts, such as their property selection, pricing, and guest communication, can offer valuable lessons for optimizing your own Airbnb operations in El Llano de los Toros.
Dive Deeper: Advanced El Llano de los Toros STR Market Data (2026)
Ready to unlock more insights? AirROI provides access to advanced metrics and comprehensive Airbnb data for El Llano de los Toros. Explore detailed analytics beyond this report to refine your investment strategy, optimize pricing, and maximize your vacation rental profits.
Explore Advanced MetricsEl Llano de los Toros Short-Term Rental Market Composition (2026): Property & Room Types
Room Type Distribution
Property Type Distribution
Market Composition Insights for El Llano de los Toros
- The El Llano de los Toros Airbnb market composition is heavily skewed towards Entire Home/Apt listings, which make up 92.6% of the 27 active rentals. This indicates strong guest preference for privacy and space.
- Looking at the property type distribution in El Llano de los Toros, Outdoor/Unique properties are the most common (88.9%), reflecting the local real estate landscape.
- Smaller segments like apartment/condo (combined 3.7%) offer potential for unique stay experiences.
El Llano de los Toros Airbnb Room Capacity Analysis (2026): Bedroom Distribution
Distribution of Listings by Number of Bedrooms
Room Capacity Insights for El Llano de los Toros
- The dominant room capacity in El Llano de los Toros is 2 bedrooms listings, making up 37% of the market. This suggests a strong demand for properties suitable for couples or solo travelers.
- Together, 2 bedrooms and 1 bedroom properties represent 55.5% of the active Airbnb listings in El Llano de los Toros, indicating a high concentration in these sizes.
- A significant 33.3% of listings offer 3+ bedrooms, catering to larger groups and families seeking more space in El Llano de los Toros.
El Llano de los Toros Vacation Rental Guest Capacity Trends (2026)
Distribution of Listings by Guest Capacity
Guest Capacity Insights for El Llano de los Toros
- The most common guest capacity trend in El Llano de los Toros vacation rentals is listings accommodating 8+ guests (48.1%). This suggests the primary traveler segment is likely larger groups.
- Properties designed for 8+ guests and 2 guests dominate the El Llano de los Toros STR market, accounting for 70.3% of listings.
- 66.6% of properties accommodate 6+ guests, serving the market segment for larger families or group travel in El Llano de los Toros.
- On average, properties in El Llano de los Toros are equipped to host 5.7 guests.
El Llano de los Toros Airbnb Booking Patterns (2026): Available vs. Booked Days
Available Days Distribution
Booked Days Distribution
Booking Pattern Insights for El Llano de los Toros
- The most common availability pattern in El Llano de los Toros falls within the 271-366 days range, representing 85.2% of listings. This suggests many properties have significant open periods on their calendars.
- Approximately 92.6% of listings show high availability (181+ days open annually), indicating potential for increased bookings or specific owner usage patterns.
- For booked days, the 1-30 days range is most frequent in El Llano de los Toros (48.1%), reflecting common guest stay durations or potential owner blocking patterns.
- A notable 7.4% of properties secure long booking periods (181+ days booked per year), highlighting successful long-term rental strategies or significant owner usage.
El Llano de los Toros Airbnb Minimum Stay Requirements Analysis
Distribution of Listings by Minimum Night Requirement
1 Night
13 listings
48.1% of total
2 Nights
9 listings
33.3% of total
30+ Nights
5 listings
18.5% of total
Key Insights
- The most prevalent minimum stay requirement in El Llano de los Toros is 1 Night, adopted by 48.1% of listings. This highlights the market's preference for shorter, flexible bookings.
- A strong majority (81.4%) of the El Llano de los Toros Airbnb data shows acceptance of very short stays (1-2 nights), indicating a dynamic, high-turnover market.
- A significant segment (18.5%) caters to monthly stays (30+ nights) in El Llano de los Toros, pointing to opportunities in the extended-stay market.
Recommendations
- Align with the market by considering a 1 Night minimum stay, as 48.1% of El Llano de los Toros hosts use this setting.
- Explore offering discounts for stays of 30+ nights to attract the 18.5% of the market seeking extended stays.
- Adjust minimum nights based on seasonality – potentially shorter during low season and longer during peak demand periods in El Llano de los Toros.
El Llano de los Toros Airbnb Cancellation Policy Trends Analysis (2026)
Flexible
3 listings
11.1% of total
Moderate
5 listings
18.5% of total
Firm
16 listings
59.3% of total
Strict
3 listings
11.1% of total
Cancellation Policy Insights for El Llano de los Toros
- The prevailing Airbnb cancellation policy trend in El Llano de los Toros is Firm, used by 59.3% of listings.
- A majority (70.4%) of hosts in El Llano de los Toros utilize Firm or Strict policies, indicating a market where hosts prioritize booking security.
Recommendations for Hosts
- Consider adopting a Firm policy to align with the 59.3% market standard in El Llano de los Toros.
- Using a Strict policy might deter some guests, as only 11.1% of listings use it. Evaluate if potential revenue protection outweighs possible lower booking rates.
- Regularly review your cancellation policy against competitors and market demand shifts in El Llano de los Toros.
El Llano de los Toros STR Booking Lead Time Analysis (2026)
Average Booking Lead Time by Month
Booking Lead Time Insights for El Llano de los Toros
- The overall average booking lead time for vacation rentals in El Llano de los Toros is 32 days.
- Guests book furthest in advance for stays during December (average 69 days), likely coinciding with peak travel demand or local events.
- The shortest booking windows occur for stays in June (average 10 days), indicating more last-minute travel plans during this time.
- Seasonally, Winter (47 days avg.) sees the longest lead times, while Summer (20 days avg.) has the shortest, reflecting typical travel planning cycles.
Recommendations for Hosts
- Use the overall average lead time (32 days) as a baseline for your pricing and availability strategy in El Llano de los Toros.
- For December stays, consider implementing length-of-stay discounts or slightly higher rates for bookings made less than 69 days out to capitalize on advance planning.
- During June, focus on last-minute booking availability and promotions, as guests book with very short notice (10 days avg.).
- Target marketing efforts for the Winter season well in advance (at least 47 days) to capture early planners.
- Monitor your own booking lead times against these El Llano de los Toros averages to identify opportunities for dynamic pricing adjustments.
Popular & Essential Airbnb Amenities in El Llano de los Toros (2026)
Amenity Prevalence
Amenity Insights for El Llano de los Toros
- Essential amenities in El Llano de los Toros that guests expect include: TV. Lacking these (this) could significantly impact bookings.
- Popular amenities like Hot water, Free parking on premises, Kitchen are common but not universal. Offering these can provide a competitive edge.
- Warning: Wifi is not universally provided but is considered essential globally. Ensure reliable Wifi is offered.
Recommendations for Hosts
- Ensure your listing includes all essential amenities for El Llano de los Toros: TV.
- Consider adding popular differentiators like Hot water or Free parking on premises to increase appeal.
- Highlight unique or less common amenities you offer (e.g., hot tub, dedicated workspace, EV charger) in your listing description and photos.
- Regularly check competitor amenities in El Llano de los Toros to stay competitive.
El Llano de los Toros Airbnb Guest Demographics & Profile Analysis (2026)
Guest Profile Summary for El Llano de los Toros
- The typical guest profile for Airbnb in El Llano de los Toros consists of primarily domestic travelers (89%), often arriving from nearby Guadalajara, typically belonging to the Post-2000s (Gen Z/Alpha) group (50%), primarily speaking Spanish or English.
- Domestic travelers account for 88.8% of guests.
- Key international markets include Mexico (88.8%) and United States (8.8%).
- Top languages spoken are Spanish (60.7%) followed by English (39.3%).
- A significant demographic segment is the Post-2000s (Gen Z/Alpha) group, representing 50% of guests.
Recommendations for Hosts
- Target domestic marketing efforts towards travelers from Guadalajara and Zapopan.
- Tailor amenities and listing descriptions to appeal to the dominant Post-2000s (Gen Z/Alpha) demographic (e.g., highlight fast WiFi, smart home features, local guides).
- Highlight unique local experiences or amenities relevant to the primary guest profile.
- Consider seasonal promotions aligned with peak travel times for key origin markets.
Nearby Short-Term Rental Market Comparison
How does the El Llano de los Toros Airbnb market stack up against its neighbors? Compare key performance metrics like average monthly revenue, ADR, and occupancy rates in surrounding areas to understand the broader regional STR landscape.
| Market | Active Properties | Monthly Revenue | Daily Rate | Avg. Occupancy |
|---|---|---|---|---|
| Tapalpa Country Club | 13 | $2,558 | $372.99 | 31% |
| San Juan Cosalá | 97 | $2,085 | $259.66 | 29% |
| La Calera | 25 | $1,725 | $227.68 | 29% |
| San Pedro Tesistán | 13 | $1,669 | $306.69 | 25% |
| Cajititlán | 27 | $1,663 | $216.62 | 26% |
| San Miguel | 36 | $1,487 | $280.59 | 20% |
| La Manzanilla | 30 | $1,460 | $192.53 | 34% |
| La Huerta | 247 | $1,347 | $299.79 | 28% |
| Río de los Chilares | 14 | $1,244 | $179.16 | 28% |
| Tepec | 16 | $1,238 | $220.46 | 20% |