Onna Airbnb Market Analysis 2026: Short Term Rental Data & Vacation Rental Statistics in Okinawa Prefecture, Japan
Is Airbnb profitable in Onna in 2026? Explore comprehensive Airbnb analytics for Onna, Okinawa Prefecture, Japan to uncover income potential. This 2026 STR market report for Onna, based on AirROI data from February 2025 to January 2026, reveals key trends in the market of 410 active listings.
Whether you're considering an Airbnb investment in Onna, optimizing your existing vacation rental, or exploring rental arbitrage opportunities, understanding the Onna Airbnb data is crucial. Navigating the high regulation landscape is key to maximizing your short term rental income potential. Let's dive into the specifics.
Key Onna Airbnb Performance Metrics Overview
Monthly Airbnb Revenue Variations & Income Potential in Onna (2026)
Understanding the monthly revenue variations for Airbnb listings in Onna is key to maximizing your short term rental income potential. Seasonality significantly impacts earnings. Our analysis, based on data from the past 12 months, shows that the peak revenue month for STRs in Onna is typically August, while January often presents the lowest earnings, highlighting opportunities for strategic pricing adjustments during shoulder and low seasons. Explore the typical Airbnb income in Onna across different performance tiers:
- Best-in-class properties (Top 10%) achieve $7,674+ monthly, often utilizing dynamic pricing and superior guest experiences.
- Strong performing properties (Top 25%) earn $4,971 or more, indicating effective management and desirable locations/amenities.
- Typical properties (Median) generate around $2,727 per month, representing the average market performance.
- Entry-level properties (Bottom 25%) see earnings around $1,388, often with potential for optimization.
Average Monthly Airbnb Earnings Trend in Onna
Onna Airbnb Occupancy Rate Trends (2026)
Maximize your bookings by understanding the Onna STR occupancy trends. Seasonal demand shifts significantly influence how often properties are booked. Typically, Augustsees the highest demand (peak season occupancy), while January experiences the lowest (low season). Effective strategies, like adjusting minimum stays or offering promotions, can boost occupancy during slower periods. Here's how different property tiers perform in Onna:
- Best-in-class properties (Top 10%) achieve 85%+ occupancy, indicating high desirability and potentially optimized availability.
- Strong performing properties (Top 25%) maintain 73% or higher occupancy, suggesting good market fit and guest satisfaction.
- Typical properties (Median) have an occupancy rate around 53%.
- Entry-level properties (Bottom 25%) average 31% occupancy, potentially facing higher vacancy.
Average Monthly Occupancy Rate Trend in Onna
Average Daily Rate (ADR) Airbnb Trends in Onna (2026)
Effective short term rental pricing strategy in Onna involves understanding monthly ADR fluctuations. The Average Daily Rate (ADR) for Airbnb in Onna typically peaks in August and dips lowest during January. Leveraging Airbnb dynamic pricing tools or strategies based on this seasonality can significantly boost revenue. Here's a look at the typical nightly rates achieved:
- Best-in-class properties (Top 10%) command rates of $433+ per night, often due to premium features or locations.
- Strong performing properties (Top 25%) achieve nightly rates of $269 or more.
- Typical properties (Median) charge around $171 per night.
- Entry-level properties (Bottom 25%) earn around $108 per night.
Average Daily Rate (ADR) Trend by Month in Onna
Get Live Onna Market Intelligence 👇

Explore Real-time Analytics
Airbnb Seasonality Analysis & Trends in Onna (2026)
Peak Season (August, July, October)
- Revenue averages $5,325 per month
- Occupancy rates average 61.4%
- Daily rates average $271
Shoulder Season
- Revenue averages $3,633 per month
- Occupancy maintains around 51.6%
- Daily rates hold near $240
Low Season (January, February, December)
- Revenue drops to average $2,699 per month
- Occupancy decreases to average 42.8%
- Daily rates adjust to average $217
Seasonality Insights for Onna
- The Airbnb seasonality in Onna shows highly seasonal trends requiring careful strategy. While the sections above show seasonal averages, it's also insightful to look at the extremes:
- During the high season, the absolute peak month showcases Onna's highest earning potential, with monthly revenues capable of climbing to $6,375, occupancy reaching a high of 65.4%, and ADRs peaking at $302.
- Conversely, the slowest single month of the year, typically falling within the low season, marks the market's lowest point. In this month, revenue might dip to $2,244, occupancy could drop to 34.5%, and ADRs may adjust down to $205.
- Understanding both the seasonal averages and these monthly peaks and troughs in revenue, occupancy, and ADR is crucial for maximizing your Airbnb profit potential in Onna.
Seasonal Strategies for Maximizing Profit
- Peak Season: Maximize revenue through premium pricing and potentially longer minimum stays. Ensure high availability.
- Low Season: Offer competitive pricing, special promotions (e.g., extended stay discounts), and flexible cancellation policies. Target off-season travelers like remote workers or budget-conscious guests.
- Shoulder Seasons: Implement dynamic pricing that balances peak and low rates. Target weekend travelers or specific events. Offer slightly more flexible terms than peak season.
- Regularly analyze your own performance against these Onna seasonality benchmarks and adjust your pricing and availability strategy accordingly.
Best Areas for Airbnb Investment in Onna (2026)
Exploring the top neighborhoods for short-term rentals in Onna? This section highlights key areas, outlining why they are attractive for hosts and guests, along with notable local attractions. Consider these locations based on your target guest profile and investment strategy.
| Neighborhood / Area | Why Host Here? (Target Guests & Appeal) | Key Attractions & Landmarks |
|---|---|---|
| Cape Manzamo | A stunning natural rock formation and scenic overlook that attracts many tourists for photos and sightseeing. Perfect for eco-tourism and nature lovers looking for beautiful views and outdoor activities. | Cape Manzamo, Shinsei Beach, Onna Village Museum, Kanna Beach, Ryukyu Mura |
| Onna Village | A charming village known for its beautiful beaches and traditional Okinawan culture. Ideal for travelers seeking authenticity and local experiences. | Onna Beach, Atsuta Beach, Manza Beach, Cape Maeda, Onna Seaside Park |
| Maeda Point | Known for its crystal-clear waters and excellent diving spots, Maeda Point is a hotspot for water sports enthusiasts and divers. Great for adventurous travelers looking for underwater experiences. | Maeda Point Beach, Diving spots, Blue Cave, Snorkeling tours, Kayaking experiences |
| Bise Fukugi Tree Road | A picturesque road lined with ancient Fukugi trees, providing a tranquil atmosphere and beautiful scenery. Great for those looking to experience nature and traditional landscapes. | Bise Fukugi Tree Road, Kouri Island, Kouri Bridge, Fukugi Tree Park, Shioya Beach |
| American Village | A vibrant entertainment complex that blends American and Okinawan cultures. Great for families and young travelers looking for fun activities, shopping, and dining. | Mihama American Village, Sunset Beach, Shopping centers, Dining spots, Amusement parks |
| Kadena Air Base Area | Located near the Kadena Air Base, this area attracts military personnel and their families, making it a good option for stable rental income. Offers a unique perspective on American-Okinawan life. | Chatan Beach, Depot Island, Kadena Air Base, Local markets, Restaurants |
| Shurijo Castle | A UNESCO World Heritage Site, Shurijo Castle is a significant cultural landmark. Attracts history buffs and tourists interested in Okinawa's heritage. | Shurijo Castle, Shuri Park, Local museums, Traditional Ryukyu performances, Okinawa Prefectural Museum |
| Nago | A beautiful city located north of Onna, known for its natural scenery and attractions. Great for tourists looking to escape the more crowded areas while still enjoying the beauty of Okinawa. | Nago Pineapple Park, Kourijima Island, Nago Castle, Warumi Ohashi Bridge, Okinawa Churaumi Aquarium |
Understanding Airbnb License Requirements & STR Laws in Onna (2026)
Yes, Onna, Okinawa Prefecture, Japan enforces high STR regulations. Obtaining a license and ensuring compliance is almost certainly required according to current 2026 STR laws. Always verify the latest short term rental regulations and Airbnb license requirements directly with local government authorities for Onna to ensure full compliance before hosting.
(Source: AirROI data, 2026, based on 96% licensed listings)
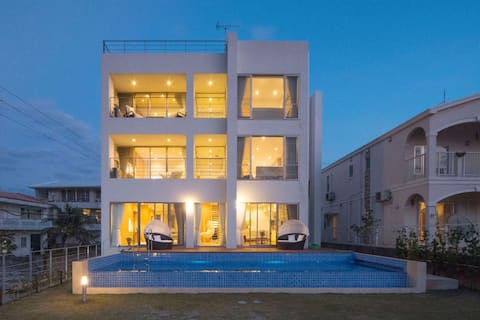
Top Performing Airbnb Properties in Onna (2026)
Benchmark your potential! Explore examples of top-performing Airbnb properties in Onnabased on Trailing Twelve Month (TTM) revenue. Analyze their characteristics, revenue, occupancy rate, and ADR to understand what drives success in this market.
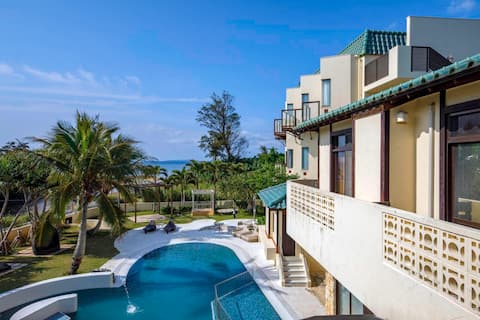
Okinawa's finest and largest 1250 ㎡ 10 full suite large pool, next to the sandy beach, 30 beds 155 m
Private Room • 10 bedrooms
7 Large suite Rooms, 10M Pool, Sea View 5000 SF
Entire Place • 7 bedrooms

M Shirahama 10 seconds 560㎡ Elevator 7BR, 6 baths 22 people free BBQ
Entire Place • 7 bedrooms

Welcome to the "Heavenly Terrace", an ocean view living room with an area of over 100 ㎡ that offers
Entire Place • 6 bedrooms

白砂Private Beach 560㎡ Elevator 7BR, 6bath Max22P
Entire Place • 8 bedrooms

Okinawa's largest 20 beds, no extra charge, 6 rooms, 5 showers, 4 toilets, ocean view, BBQ, izakaya,
Entire Place • 6 bedrooms
Note: Performance varies based on location, size, amenities, seasonality, and management quality. Data reflects the past 12 months.
Top Performing Airbnb Hosts in Onna (2026)
Learn from the best! This table showcases top-performing Airbnb hosts in Onna based on the number of properties managed and estimated total revenue over the past year. Analyze their scale and performance metrics.
| Host Name | Properties | Grossing Revenue | Stay Reviews | Avg Rating |
|---|---|---|---|---|
| Grandioso | 35 | $2,478,583 | 2084 | 4.75/5.0 |
| YotaMika | 13 | $1,651,479 | 1771 | 4.83/5.0 |
| ChingI | 7 | $644,633 | 892 | 4.94/5.0 |
| Panacea | 1 | $341,620 | 44 | 4.95/5.0 |
| Youki | 12 | $337,432 | 2587 | 4.89/5.0 |
| Villa VALIOSA | 4 | $309,673 | 35 | 4.96/5.0 |
| 巧 | 3 | $300,774 | 88 | 4.98/5.0 |
| Lohas | 1 | $236,588 | 44 | 4.91/5.0 |
| Grandioso | 4 | $236,421 | 485 | 4.76/5.0 |
| Villa | 7 | $227,994 | 283 | 4.61/5.0 |
Analyzing the strategies of top hosts, such as their property selection, pricing, and guest communication, can offer valuable lessons for optimizing your own Airbnb operations in Onna.
Dive Deeper: Advanced Onna STR Market Data (2026)
Ready to unlock more insights? AirROI provides access to advanced metrics and comprehensive Airbnb data for Onna. Explore detailed analytics beyond this report to refine your investment strategy, optimize pricing, and maximize your vacation rental profits.
Explore Advanced MetricsOnna Short-Term Rental Market Composition (2026): Property & Room Types
Room Type Distribution
Property Type Distribution
Market Composition Insights for Onna
- The Onna Airbnb market composition is heavily skewed towards Entire Home/Apt listings, which make up 87.6% of the 410 active rentals. This indicates strong guest preference for privacy and space.
- Looking at the property type distribution in Onna, House properties are the most common (63.2%), reflecting the local real estate landscape.
- Houses represent a significant 63.2% portion, catering likely to families or larger groups.
- The presence of 8% Hotel/Boutique listings indicates integration with traditional hospitality.
- Smaller segments like outdoor/unique (combined 2.7%) offer potential for unique stay experiences.
Onna Airbnb Room Capacity Analysis (2026): Bedroom Distribution
Distribution of Listings by Number of Bedrooms
Room Capacity Insights for Onna
- The dominant room capacity in Onna is 3 bedrooms listings, making up 27.6% of the market. This suggests a strong demand for properties suitable for families or small groups.
- Together, 3 bedrooms and 2 bedrooms properties represent 51.0% of the active Airbnb listings in Onna, indicating a high concentration in these sizes.
- A significant 48.8% of listings offer 3+ bedrooms, catering to larger groups and families seeking more space in Onna.
Onna Vacation Rental Guest Capacity Trends (2026)
Distribution of Listings by Guest Capacity
Guest Capacity Insights for Onna
- The most common guest capacity trend in Onna vacation rentals is listings accommodating 8+ guests (54.6%). This suggests the primary traveler segment is likely larger groups.
- Properties designed for 8+ guests and 6 guests dominate the Onna STR market, accounting for 68.5% of listings.
- 72.4% of properties accommodate 6+ guests, serving the market segment for larger families or group travel in Onna.
- On average, properties in Onna are equipped to host 6.3 guests.
Onna Airbnb Booking Patterns (2026): Available vs. Booked Days
Available Days Distribution
Booked Days Distribution
Booking Pattern Insights for Onna
- The most common availability pattern in Onna falls within the 91-180 days range, representing 30.5% of listings. This suggests many properties have significant open periods on their calendars.
- Approximately 56.1% of listings show high availability (181+ days open annually), indicating potential for increased bookings or specific owner usage patterns.
- For booked days, the 181-270 days range is most frequent in Onna (30.7%), reflecting common guest stay durations or potential owner blocking patterns.
- A notable 45.3% of properties secure long booking periods (181+ days booked per year), highlighting successful long-term rental strategies or significant owner usage.
Onna Airbnb Minimum Stay Requirements Analysis
Distribution of Listings by Minimum Night Requirement
1 Night
240 listings
58.5% of total
2 Nights
92 listings
22.4% of total
3 Nights
2 listings
0.5% of total
7-29 Nights
3 listings
0.7% of total
30+ Nights
73 listings
17.8% of total
Key Insights
- The most prevalent minimum stay requirement in Onna is 1 Night, adopted by 58.5% of listings. This highlights the market's preference for shorter, flexible bookings.
- A strong majority (80.9%) of the Onna Airbnb data shows acceptance of very short stays (1-2 nights), indicating a dynamic, high-turnover market.
- A significant segment (17.8%) caters to monthly stays (30+ nights) in Onna, pointing to opportunities in the extended-stay market.
Recommendations
- Align with the market by considering a 1 Night minimum stay, as 58.5% of Onna hosts use this setting.
- Explore offering discounts for stays of 30+ nights to attract the 17.8% of the market seeking extended stays.
- Adjust minimum nights based on seasonality – potentially shorter during low season and longer during peak demand periods in Onna.
Onna Airbnb Cancellation Policy Trends Analysis (2026)
Super Strict 30 Days
1 listings
0.2% of total
Limited
4 listings
1% of total
Flexible
27 listings
6.6% of total
Moderate
102 listings
24.9% of total
Firm
215 listings
52.4% of total
Strict
61 listings
14.9% of total
Cancellation Policy Insights for Onna
- The prevailing Airbnb cancellation policy trend in Onna is Firm, used by 52.4% of listings.
- A majority (67.3%) of hosts in Onna utilize Firm or Strict policies, indicating a market where hosts prioritize booking security.
Recommendations for Hosts
- Consider adopting a Firm policy to align with the 52.4% market standard in Onna.
- Using a Strict policy might deter some guests, as only 14.9% of listings use it. Evaluate if potential revenue protection outweighs possible lower booking rates.
- Regularly review your cancellation policy against competitors and market demand shifts in Onna.
Onna STR Booking Lead Time Analysis (2026)
Average Booking Lead Time by Month
Booking Lead Time Insights for Onna
- The overall average booking lead time for vacation rentals in Onna is 53 days.
- Guests book furthest in advance for stays during August (average 66 days), likely coinciding with peak travel demand or local events.
- The shortest booking windows occur for stays in January (average 46 days), indicating more last-minute travel plans during this time.
- Seasonally, Fall (59 days avg.) sees the longest lead times, while Winter (49 days avg.) has the shortest, reflecting typical travel planning cycles.
Recommendations for Hosts
- Use the overall average lead time (53 days) as a baseline for your pricing and availability strategy in Onna.
- For August stays, consider implementing length-of-stay discounts or slightly higher rates for bookings made less than 66 days out to capitalize on advance planning.
- Target marketing efforts for the Fall season well in advance (at least 59 days) to capture early planners.
- Monitor your own booking lead times against these Onna averages to identify opportunities for dynamic pricing adjustments.
Popular & Essential Airbnb Amenities in Onna (2026)
Amenity Prevalence
Amenity Insights for Onna
- Essential amenities in Onna that guests expect include: Air conditioning, Wifi, Hair dryer, Shampoo, Free parking on premises, Washer. Lacking these (any) could significantly impact bookings.
- Popular amenities like TV, Smoke alarm, Kitchen are common but not universal. Offering these can provide a competitive edge.
Recommendations for Hosts
- Ensure your listing includes all essential amenities for Onna: Air conditioning, Wifi, Hair dryer, Shampoo, Free parking on premises, Washer.
- Prioritize adding missing essentials: Air conditioning, Wifi, Hair dryer, Shampoo, Free parking on premises, Washer.
- Consider adding popular differentiators like TV or Smoke alarm to increase appeal.
- Highlight unique or less common amenities you offer (e.g., hot tub, dedicated workspace, EV charger) in your listing description and photos.
- Regularly check competitor amenities in Onna to stay competitive.
Onna Airbnb Guest Demographics & Profile Analysis (2026)
Guest Profile Summary for Onna
- The typical guest profile for Airbnb in Onna consists of predominantly international visitors (83%), with top international origins including United States, typically belonging to the Post-2000s (Gen Z/Alpha) group (50%), primarily speaking English or Chinese.
- Domestic travelers account for 17.5% of guests.
- Key international markets include Japan (17.5%) and United States (14.9%).
- Top languages spoken are English (43.2%) followed by Chinese (16.2%).
- A significant demographic segment is the Post-2000s (Gen Z/Alpha) group, representing 50% of guests.
Recommendations for Hosts
- Focus marketing internationally, particularly towards travelers from United States.
- Tailor amenities and listing descriptions to appeal to the dominant Post-2000s (Gen Z/Alpha) demographic (e.g., highlight fast WiFi, smart home features, local guides).
- Highlight unique local experiences or amenities relevant to the primary guest profile.
- Consider seasonal promotions aligned with peak travel times for key origin markets.
Nearby Short-Term Rental Market Comparison
How does the Onna Airbnb market stack up against its neighbors? Compare key performance metrics like average monthly revenue, ADR, and occupancy rates in surrounding areas to understand the broader regional STR landscape.
| Market | Active Properties | Monthly Revenue | Daily Rate | Avg. Occupancy |
|---|---|---|---|---|
| Ginowan | 42 | $3,567 | $199.75 | 60% |
| Urasoe | 25 | $3,064 | $202.53 | 48% |
| Chatan | 162 | $3,037 | $226.73 | 49% |
| Ginoza | 12 | $2,887 | $283.90 | 36% |
| Kin | 63 | $2,847 | $181.24 | 53% |
| Nanjo | 101 | $2,819 | $206.31 | 51% |
| Nakijin | 146 | $2,680 | $225.55 | 44% |
| Nago | 204 | $2,626 | $229.82 | 44% |
| Yomitan | 162 | $2,408 | $162.94 | 51% |
| Tomigusuku | 19 | $2,366 | $148.25 | 55% |