Nanjo Airbnb Market Analysis 2026: Short Term Rental Data & Vacation Rental Statistics in Okinawa Prefecture, Japan
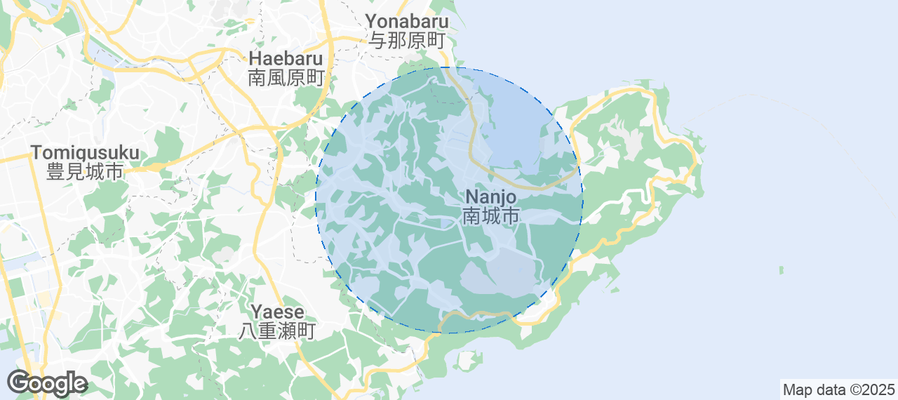
Is Airbnb profitable in Nanjo in 2026? Explore comprehensive Airbnb analytics for Nanjo, Okinawa Prefecture, Japan to uncover income potential. This 2026 STR market report for Nanjo, based on AirROI data from February 2025 to January 2026, reveals key trends in the niche market of 101 active listings.
Whether you're considering an Airbnb investment in Nanjo, optimizing your existing vacation rental, or exploring rental arbitrage opportunities, understanding the Nanjo Airbnb data is crucial. Navigating the high regulation landscape is key to maximizing your short term rental income potential. Let's dive into the specifics.
Key Nanjo Airbnb Performance Metrics Overview
Monthly Airbnb Revenue Variations & Income Potential in Nanjo (2026)
Understanding the monthly revenue variations for Airbnb listings in Nanjo is key to maximizing your short term rental income potential. Seasonality significantly impacts earnings. Our analysis, based on data from the past 12 months, shows that the peak revenue month for STRs in Nanjo is typically August, while January often presents the lowest earnings, highlighting opportunities for strategic pricing adjustments during shoulder and low seasons. Explore the typical Airbnb income in Nanjo across different performance tiers:
- Best-in-class properties (Top 10%) achieve $6,208+ monthly, often utilizing dynamic pricing and superior guest experiences.
- Strong performing properties (Top 25%) earn $4,467 or more, indicating effective management and desirable locations/amenities.
- Typical properties (Median) generate around $2,523 per month, representing the average market performance.
- Entry-level properties (Bottom 25%) see earnings around $1,267, often with potential for optimization.
Average Monthly Airbnb Earnings Trend in Nanjo
Nanjo Airbnb Occupancy Rate Trends (2026)
Maximize your bookings by understanding the Nanjo STR occupancy trends. Seasonal demand shifts significantly influence how often properties are booked. Typically, Augustsees the highest demand (peak season occupancy), while January experiences the lowest (low season). Effective strategies, like adjusting minimum stays or offering promotions, can boost occupancy during slower periods. Here's how different property tiers perform in Nanjo:
- Best-in-class properties (Top 10%) achieve 87%+ occupancy, indicating high desirability and potentially optimized availability.
- Strong performing properties (Top 25%) maintain 75% or higher occupancy, suggesting good market fit and guest satisfaction.
- Typical properties (Median) have an occupancy rate around 54%.
- Entry-level properties (Bottom 25%) average 30% occupancy, potentially facing higher vacancy.
Average Monthly Occupancy Rate Trend in Nanjo
Average Daily Rate (ADR) Airbnb Trends in Nanjo (2026)
Effective short term rental pricing strategy in Nanjo involves understanding monthly ADR fluctuations. The Average Daily Rate (ADR) for Airbnb in Nanjo typically peaks in August and dips lowest during January. Leveraging Airbnb dynamic pricing tools or strategies based on this seasonality can significantly boost revenue. Here's a look at the typical nightly rates achieved:
- Best-in-class properties (Top 10%) command rates of $358+ per night, often due to premium features or locations.
- Strong performing properties (Top 25%) achieve nightly rates of $245 or more.
- Typical properties (Median) charge around $169 per night.
- Entry-level properties (Bottom 25%) earn around $113 per night.
Average Daily Rate (ADR) Trend by Month in Nanjo
Get Live Nanjo Market Intelligence 👇
Explore Real-time Analytics
Airbnb Seasonality Analysis & Trends in Nanjo (2026)
Peak Season (August, July, October)
- Revenue averages $4,275 per month
- Occupancy rates average 61.5%
- Daily rates average $222
Shoulder Season
- Revenue averages $2,951 per month
- Occupancy maintains around 50.3%
- Daily rates hold near $204
Low Season (January, February, November)
- Revenue drops to average $2,443 per month
- Occupancy decreases to average 48.5%
- Daily rates adjust to average $184
Seasonality Insights for Nanjo
- The Airbnb seasonality in Nanjo shows highly seasonal trends requiring careful strategy. While the sections above show seasonal averages, it's also insightful to look at the extremes:
- During the high season, the absolute peak month showcases Nanjo's highest earning potential, with monthly revenues capable of climbing to $4,782, occupancy reaching a high of 66.5%, and ADRs peaking at $234.
- Conversely, the slowest single month of the year, typically falling within the low season, marks the market's lowest point. In this month, revenue might dip to $2,012, occupancy could drop to 37.2%, and ADRs may adjust down to $181.
- Understanding both the seasonal averages and these monthly peaks and troughs in revenue, occupancy, and ADR is crucial for maximizing your Airbnb profit potential in Nanjo.
Seasonal Strategies for Maximizing Profit
- Peak Season: Maximize revenue through premium pricing and potentially longer minimum stays. Ensure high availability.
- Low Season: Offer competitive pricing, special promotions (e.g., extended stay discounts), and flexible cancellation policies. Target off-season travelers like remote workers or budget-conscious guests.
- Shoulder Seasons: Implement dynamic pricing that balances peak and low rates. Target weekend travelers or specific events. Offer slightly more flexible terms than peak season.
- Regularly analyze your own performance against these Nanjo seasonality benchmarks and adjust your pricing and availability strategy accordingly.
Best Areas for Airbnb Investment in Nanjo (2026)
Exploring the top neighborhoods for short-term rentals in Nanjo? This section highlights key areas, outlining why they are attractive for hosts and guests, along with notable local attractions. Consider these locations based on your target guest profile and investment strategy.
| Neighborhood / Area | Why Host Here? (Target Guests & Appeal) | Key Attractions & Landmarks |
|---|---|---|
| Niraikanai Bridge | A scenic bridge offering stunning views of the ocean and surrounding nature. Popular among tourists who want to experience Okinawa's natural beauty and vibrant sunset views. | Niraikanai Bridge, Kijimuna Park, Kijimadaira, Okinawa World, Okinawa Churaumi Aquarium |
| Sefa Utaki | A sacred site in Okinawan religion, featuring lush greenery and significant cultural history. Attracts visitors interested in spirituality and heritage tourism. | Sefa Utaki, Cape Chinen, Hiji Falls, Okinawa World, Tropical Dream Center |
| Tamagusuku | Known for its cultural heritage and beautiful landscapes, Tamagusuku is ideal for those looking to stay in a tranquil, less touristy area with rich local traditions. | Tamagusuku Castle Ruins, Peace Memorial Park, Kyan's House, Shurijo Castle, Battle of Okinawa Historical Site |
| Himeyuri Peace Museum | Offers insights into the Battle of Okinawa and commemorates the Himeyuri students. It's a place of deep historical significance, attracting history buffs and educators. | Himeyuri Peace Museum, Okinawa Peace Memorial Park, Manko Park, Fukushu-en Garden, Naha City Museum of History |
| Nanjyo City | A city with natural beauty and cultural history, attracting those looking for an authentic Okinawan experience away from the crowds. | Nanjo Azalea Park, The Southernmost Point of the Japanese Archipelago, Okinawa Urban Monorail, Sakima Art Museum, The Himeyuri Monument |
| Oyama | A quiet area known for its local markets and traditional Okinawan lifestyle. Great for guests who want to immerse themselves in local culture and cuisine. | Oyama Market, Okinawa Prefectural Museum, Cape Kyan, The Okinawa Railway, Okinawa Toy Museum |
| Kadena | Home to the largest US Air Force base outside of the United States, Kadena is lively and offers various amenities for tourists and base personnel. | Kadena Air Base, Kadena Town, Yomitan Village, Sunset Beach, Cape Zampa |
| Yomitan | Famous for its pottery and beautiful beaches, Yomitan is perfect for those seeking art, relaxation, and natural beauty in Okinawa. | Yomitan Pottery Village, Cape Zampa, Zanpa Misaki Park, Nirai Kanai Bridge, Yomitan Village Museum |
Understanding Airbnb License Requirements & STR Laws in Nanjo (2026)
Yes, Nanjo, Okinawa Prefecture, Japan enforces high STR regulations. Obtaining a license and ensuring compliance is almost certainly required according to current 2026 STR laws. Always verify the latest short term rental regulations and Airbnb license requirements directly with local government authorities for Nanjo to ensure full compliance before hosting.
(Source: AirROI data, 2026, based on 96% licensed listings)
Top Performing Airbnb Properties in Nanjo (2026)
Benchmark your potential! Explore examples of top-performing Airbnb properties in Nanjobased on Trailing Twelve Month (TTM) revenue. Analyze their characteristics, revenue, occupancy rate, and ADR to understand what drives success in this market.
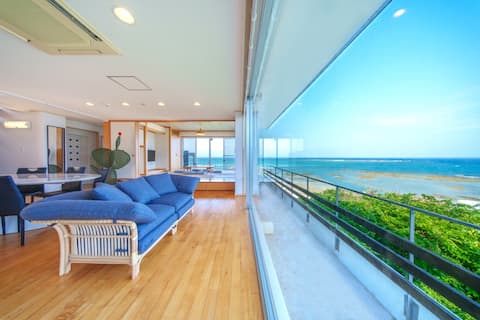
Building A, exclusive sea view! 3-story building/Barrel sauna
Entire Place • 3 bedrooms
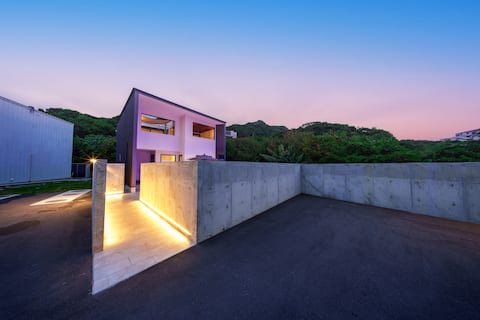
《 Building C 》1-minute walk to the beach, private villa with pool, jacuzzi, and barrel sauna
Entire Place • 3 bedrooms
![Tiny luxury & infinity pool [momo]](https://a0.muscache.com/im/pictures/hosting/Hosting-921986697884043822/original/b47530a8-0726-4fba-b1f1-2c3da528c3d7.jpeg?im_w=480&im_format=avif)
Tiny luxury & infinity pool [momo]
Entire Place • 1 bedroom
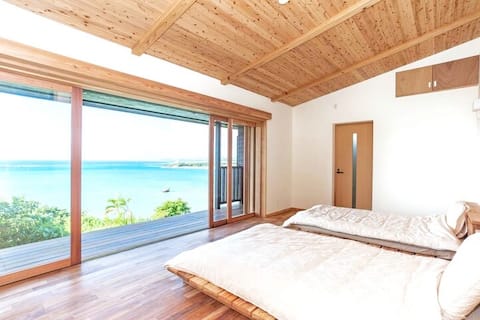
Villa Sachibaru Building A: Spend a peaceful moment in a quiet space with a sea view cafe [Hama Beac
Entire Place • 1 bedroom

Experience Okinawan lifestyle looking at the sea♪
Entire Place • 3 bedrooms
Sister house
Entire Place • 1 bedroom
Note: Performance varies based on location, size, amenities, seasonality, and management quality. Data reflects the past 12 months.
Top Performing Airbnb Hosts in Nanjo (2026)
Learn from the best! This table showcases top-performing Airbnb hosts in Nanjo based on the number of properties managed and estimated total revenue over the past year. Analyze their scale and performance metrics.
| Host Name | Properties | Grossing Revenue | Stay Reviews | Avg Rating |
|---|---|---|---|---|
| クリスタルヴィラ | 4 | $377,882 | 52 | 4.88/5.0 |
| Kenyou | 4 | $239,322 | 231 | 4.97/5.0 |
| Mari | 3 | $229,260 | 1044 | 4.89/5.0 |
| Yuta & Misa | 3 | $205,173 | 100 | 4.97/5.0 |
| 淳 | 4 | $145,369 | 208 | 4.88/5.0 |
| アトリエココグループ | 3 | $137,894 | 119 | 4.67/5.0 |
| サウスウインドハウス | 2 | $106,792 | 239 | 4.88/5.0 |
| Miho | 2 | $92,209 | 299 | 4.99/5.0 |
| Shun | 1 | $76,600 | 296 | 4.90/5.0 |
| Hikaru | 2 | $71,383 | 146 | 4.87/5.0 |
Analyzing the strategies of top hosts, such as their property selection, pricing, and guest communication, can offer valuable lessons for optimizing your own Airbnb operations in Nanjo.
Dive Deeper: Advanced Nanjo STR Market Data (2026)
Ready to unlock more insights? AirROI provides access to advanced metrics and comprehensive Airbnb data for Nanjo. Explore detailed analytics beyond this report to refine your investment strategy, optimize pricing, and maximize your vacation rental profits.
Explore Advanced MetricsNanjo Short-Term Rental Market Composition (2026): Property & Room Types
Room Type Distribution
Property Type Distribution
Market Composition Insights for Nanjo
- The Nanjo Airbnb market composition is heavily skewed towards Entire Home/Apt listings, which make up 86.1% of the 101 active rentals. This indicates strong guest preference for privacy and space.
- Looking at the property type distribution in Nanjo, House properties are the most common (82.2%), reflecting the local real estate landscape.
- Houses represent a significant 82.2% portion, catering likely to families or larger groups.
- The presence of 5.9% Hotel/Boutique listings indicates integration with traditional hospitality.
- Smaller segments like outdoor/unique, unique stays (combined 6.0%) offer potential for unique stay experiences.
Nanjo Airbnb Room Capacity Analysis (2026): Bedroom Distribution
Distribution of Listings by Number of Bedrooms
Room Capacity Insights for Nanjo
- The dominant room capacity in Nanjo is 1 bedroom listings, making up 30.7% of the market. This suggests a strong demand for properties suitable for couples or solo travelers.
- Together, 1 bedroom and 3 bedrooms properties represent 58.4% of the active Airbnb listings in Nanjo, indicating a high concentration in these sizes.
- A significant 45.5% of listings offer 3+ bedrooms, catering to larger groups and families seeking more space in Nanjo.
Nanjo Vacation Rental Guest Capacity Trends (2026)
Distribution of Listings by Guest Capacity
Guest Capacity Insights for Nanjo
- The most common guest capacity trend in Nanjo vacation rentals is listings accommodating 8+ guests (37.6%). This suggests the primary traveler segment is likely larger groups.
- Properties designed for 8+ guests and 6 guests dominate the Nanjo STR market, accounting for 53.4% of listings.
- 58.4% of properties accommodate 6+ guests, serving the market segment for larger families or group travel in Nanjo.
- On average, properties in Nanjo are equipped to host 5.4 guests.
Nanjo Airbnb Booking Patterns (2026): Available vs. Booked Days
Available Days Distribution
Booked Days Distribution
Booking Pattern Insights for Nanjo
- The most common availability pattern in Nanjo falls within the 91-180 days range, representing 34.7% of listings. This suggests many properties have significant open periods on their calendars.
- Approximately 51.5% of listings show high availability (181+ days open annually), indicating potential for increased bookings or specific owner usage patterns.
- For booked days, the 181-270 days range is most frequent in Nanjo (33.7%), reflecting common guest stay durations or potential owner blocking patterns.
- A notable 48.6% of properties secure long booking periods (181+ days booked per year), highlighting successful long-term rental strategies or significant owner usage.
Nanjo Airbnb Minimum Stay Requirements Analysis
Distribution of Listings by Minimum Night Requirement
1 Night
55 listings
54.5% of total
2 Nights
23 listings
22.8% of total
3 Nights
1 listings
1% of total
4-6 Nights
1 listings
1% of total
30+ Nights
21 listings
20.8% of total
Key Insights
- The most prevalent minimum stay requirement in Nanjo is 1 Night, adopted by 54.5% of listings. This highlights the market's preference for shorter, flexible bookings.
- A strong majority (77.3%) of the Nanjo Airbnb data shows acceptance of very short stays (1-2 nights), indicating a dynamic, high-turnover market.
- A significant segment (20.8%) caters to monthly stays (30+ nights) in Nanjo, pointing to opportunities in the extended-stay market.
Recommendations
- Align with the market by considering a 1 Night minimum stay, as 54.5% of Nanjo hosts use this setting.
- Explore offering discounts for stays of 30+ nights to attract the 20.8% of the market seeking extended stays.
- Adjust minimum nights based on seasonality – potentially shorter during low season and longer during peak demand periods in Nanjo.
Nanjo Airbnb Cancellation Policy Trends Analysis (2026)
Non-refundable
3 listings
3% of total
Limited
1 listings
1% of total
Super Strict 60 Days
2 listings
2% of total
Flexible
9 listings
8.9% of total
Moderate
32 listings
31.7% of total
Firm
49 listings
48.5% of total
Strict
5 listings
5% of total
Cancellation Policy Insights for Nanjo
- The prevailing Airbnb cancellation policy trend in Nanjo is Firm, used by 48.5% of listings.
- A majority (53.5%) of hosts in Nanjo utilize Firm or Strict policies, indicating a market where hosts prioritize booking security.
- Strict cancellation policies are quite rare (5%), potentially making listings with this policy less competitive unless justified by high demand or property type.
Recommendations for Hosts
- Consider adopting a Firm policy to align with the 48.5% market standard in Nanjo.
- Using a Strict policy might deter some guests, as only 5% of listings use it. Evaluate if potential revenue protection outweighs possible lower booking rates.
- Regularly review your cancellation policy against competitors and market demand shifts in Nanjo.
Nanjo STR Booking Lead Time Analysis (2026)
Average Booking Lead Time by Month
Booking Lead Time Insights for Nanjo
- The overall average booking lead time for vacation rentals in Nanjo is 53 days.
- Guests book furthest in advance for stays during August (average 62 days), likely coinciding with peak travel demand or local events.
- The shortest booking windows occur for stays in January (average 39 days), indicating more last-minute travel plans during this time.
- Seasonally, Fall (60 days avg.) sees the longest lead times, while Winter (44 days avg.) has the shortest, reflecting typical travel planning cycles.
Recommendations for Hosts
- Use the overall average lead time (53 days) as a baseline for your pricing and availability strategy in Nanjo.
- Target marketing efforts for the Fall season well in advance (at least 60 days) to capture early planners.
- Monitor your own booking lead times against these Nanjo averages to identify opportunities for dynamic pricing adjustments.
Popular & Essential Airbnb Amenities in Nanjo (2026)
Amenity Prevalence
Amenity Insights for Nanjo
- Essential amenities in Nanjo that guests expect include: Air conditioning, Hair dryer, Shampoo, Washer, Wifi, Smoke alarm, Free parking on premises. Lacking these (any) could significantly impact bookings.
- Popular amenities like Fire extinguisher, Kitchen, Refrigerator are common but not universal. Offering these can provide a competitive edge.
Recommendations for Hosts
- Ensure your listing includes all essential amenities for Nanjo: Air conditioning, Hair dryer, Shampoo, Washer, Wifi, Smoke alarm, Free parking on premises.
- Prioritize adding missing essentials: Hair dryer, Shampoo, Washer, Wifi, Smoke alarm, Free parking on premises.
- Consider adding popular differentiators like Fire extinguisher or Kitchen to increase appeal.
- Highlight unique or less common amenities you offer (e.g., hot tub, dedicated workspace, EV charger) in your listing description and photos.
- Regularly check competitor amenities in Nanjo to stay competitive.
Nanjo Airbnb Guest Demographics & Profile Analysis (2026)
Guest Profile Summary for Nanjo
- The typical guest profile for Airbnb in Nanjo consists of predominantly international visitors (82%), with top international origins including United States, typically belonging to the Post-2000s (Gen Z/Alpha) group (50%), primarily speaking English or Japanese.
- Domestic travelers account for 18.2% of guests.
- Key international markets include Japan (18.2%) and United States (14.8%).
- Top languages spoken are English (40.7%) followed by Japanese (12.5%).
- A significant demographic segment is the Post-2000s (Gen Z/Alpha) group, representing 50% of guests.
Recommendations for Hosts
- Focus marketing internationally, particularly towards travelers from United States.
- Tailor amenities and listing descriptions to appeal to the dominant Post-2000s (Gen Z/Alpha) demographic (e.g., highlight fast WiFi, smart home features, local guides).
- Highlight unique local experiences or amenities relevant to the primary guest profile.
- Consider seasonal promotions aligned with peak travel times for key origin markets.
Nearby Short-Term Rental Market Comparison
How does the Nanjo Airbnb market stack up against its neighbors? Compare key performance metrics like average monthly revenue, ADR, and occupancy rates in surrounding areas to understand the broader regional STR landscape.
| Market | Active Properties | Monthly Revenue | Daily Rate | Avg. Occupancy |
|---|---|---|---|---|
| Ginowan | 42 | $3,567 | $199.75 | 60% |
| Onna | 410 | $3,254 | $244.98 | 50% |
| Urasoe | 25 | $3,064 | $202.53 | 48% |
| Chatan | 162 | $3,037 | $226.73 | 49% |
| Ginoza | 12 | $2,887 | $283.90 | 36% |
| Kin | 63 | $2,847 | $181.24 | 53% |
| Nakijin | 146 | $2,680 | $225.55 | 44% |
| Nago | 204 | $2,626 | $229.82 | 44% |
| Yomitan | 162 | $2,408 | $162.94 | 51% |
| Tomigusuku | 19 | $2,366 | $148.25 | 55% |