Motobu Airbnb Market Analysis 2026: Short Term Rental Data & Vacation Rental Statistics in Okinawa Prefecture, Japan
Is Airbnb profitable in Motobu in 2026? Explore comprehensive Airbnb analytics for Motobu, Okinawa Prefecture, Japan to uncover income potential. This 2026 STR market report for Motobu, based on AirROI data from February 2025 to January 2026, reveals key trends in the market of 256 active listings.
Whether you're considering an Airbnb investment in Motobu, optimizing your existing vacation rental, or exploring rental arbitrage opportunities, understanding the Motobu Airbnb data is crucial. Navigating the high regulation landscape is key to maximizing your short term rental income potential. Let's dive into the specifics.
Key Motobu Airbnb Performance Metrics Overview
Monthly Airbnb Revenue Variations & Income Potential in Motobu (2026)
Understanding the monthly revenue variations for Airbnb listings in Motobu is key to maximizing your short term rental income potential. Seasonality significantly impacts earnings. Our analysis, based on data from the past 12 months, shows that the peak revenue month for STRs in Motobu is typically August, while January often presents the lowest earnings, highlighting opportunities for strategic pricing adjustments during shoulder and low seasons. Explore the typical Airbnb income in Motobu across different performance tiers:
- Best-in-class properties (Top 10%) achieve $5,324+ monthly, often utilizing dynamic pricing and superior guest experiences.
- Strong performing properties (Top 25%) earn $3,696 or more, indicating effective management and desirable locations/amenities.
- Typical properties (Median) generate around $2,219 per month, representing the average market performance.
- Entry-level properties (Bottom 25%) see earnings around $1,080, often with potential for optimization.
Average Monthly Airbnb Earnings Trend in Motobu
Motobu Airbnb Occupancy Rate Trends (2026)
Maximize your bookings by understanding the Motobu STR occupancy trends. Seasonal demand shifts significantly influence how often properties are booked. Typically, Augustsees the highest demand (peak season occupancy), while January experiences the lowest (low season). Effective strategies, like adjusting minimum stays or offering promotions, can boost occupancy during slower periods. Here's how different property tiers perform in Motobu:
- Best-in-class properties (Top 10%) achieve 83%+ occupancy, indicating high desirability and potentially optimized availability.
- Strong performing properties (Top 25%) maintain 69% or higher occupancy, suggesting good market fit and guest satisfaction.
- Typical properties (Median) have an occupancy rate around 45%.
- Entry-level properties (Bottom 25%) average 23% occupancy, potentially facing higher vacancy.
Average Monthly Occupancy Rate Trend in Motobu
Average Daily Rate (ADR) Airbnb Trends in Motobu (2026)
Effective short term rental pricing strategy in Motobu involves understanding monthly ADR fluctuations. The Average Daily Rate (ADR) for Airbnb in Motobu typically peaks in August and dips lowest during February. Leveraging Airbnb dynamic pricing tools or strategies based on this seasonality can significantly boost revenue. Here's a look at the typical nightly rates achieved:
- Best-in-class properties (Top 10%) command rates of $339+ per night, often due to premium features or locations.
- Strong performing properties (Top 25%) achieve nightly rates of $227 or more.
- Typical properties (Median) charge around $157 per night.
- Entry-level properties (Bottom 25%) earn around $113 per night.
Average Daily Rate (ADR) Trend by Month in Motobu
Get Live Motobu Market Intelligence 👇

Explore Real-time Analytics
Airbnb Seasonality Analysis & Trends in Motobu (2026)
Peak Season (August, July, October)
- Revenue averages $3,762 per month
- Occupancy rates average 54.0%
- Daily rates average $216
Shoulder Season
- Revenue averages $2,526 per month
- Occupancy maintains around 46.4%
- Daily rates hold near $186
Low Season (January, February, December)
- Revenue drops to average $1,909 per month
- Occupancy decreases to average 38.4%
- Daily rates adjust to average $176
Seasonality Insights for Motobu
- The Airbnb seasonality in Motobu shows highly seasonal trends requiring careful strategy. While the sections above show seasonal averages, it's also insightful to look at the extremes:
- During the high season, the absolute peak month showcases Motobu's highest earning potential, with monthly revenues capable of climbing to $4,492, occupancy reaching a high of 58.0%, and ADRs peaking at $234.
- Conversely, the slowest single month of the year, typically falling within the low season, marks the market's lowest point. In this month, revenue might dip to $1,504, occupancy could drop to 28.9%, and ADRs may adjust down to $164.
- Understanding both the seasonal averages and these monthly peaks and troughs in revenue, occupancy, and ADR is crucial for maximizing your Airbnb profit potential in Motobu.
Seasonal Strategies for Maximizing Profit
- Peak Season: Maximize revenue through premium pricing and potentially longer minimum stays. Ensure high availability.
- Low Season: Offer competitive pricing, special promotions (e.g., extended stay discounts), and flexible cancellation policies. Target off-season travelers like remote workers or budget-conscious guests.
- Shoulder Seasons: Implement dynamic pricing that balances peak and low rates. Target weekend travelers or specific events. Offer slightly more flexible terms than peak season.
- Regularly analyze your own performance against these Motobu seasonality benchmarks and adjust your pricing and availability strategy accordingly.
Best Areas for Airbnb Investment in Motobu (2026)
Exploring the top neighborhoods for short-term rentals in Motobu? This section highlights key areas, outlining why they are attractive for hosts and guests, along with notable local attractions. Consider these locations based on your target guest profile and investment strategy.
| Neighborhood / Area | Why Host Here? (Target Guests & Appeal) | Key Attractions & Landmarks |
|---|---|---|
| Emerald Beach | A stunning white sand beach with crystal clear waters, perfect for families and leisure travelers. It's a popular spot for beachgoers and offers various water sports. | Emerald Beach, Okinawa Churaumi Aquarium, Tropical Dream Center, Bise Fukugi Tree Road, Cape Manzamo |
| Kise Beach | Known for its beautiful shoreline and resorts, Kise Beach attracts both tourists and locals who seek relaxation and beach activities. It's an ideal spot for hosting guests looking for a serene environment. | Kise Beach, Kise Seaside Park, Bios no Oka, Bise Fukugi Village |
| Cape Maeda | A breathtaking coastal area famous for snorkeling and diving opportunities. Attracts adventure seekers and nature lovers looking to explore Okinawa's marine life. | Cape Maeda, Blue Cave, Snorkeling tours, Diving excursions |
| Motobu Town | Rich in culture and history, Motobu Town offers a variety of local experiences and attractions. Ideal for travelers wanting to explore the authentic Okinawan lifestyle. | Motobu Agricultural Park, Okinawa Churaumi Aquarium, Local markets, Cultural experiences |
| Nago | A vibrant city close to many natural attractions, Nago is appealing for tourists looking for a blend of urban and outdoor experiences, including access to beautiful beaches and lush landscape. | Nago Pineapple Park, Agu Pork restaurants, Nago Castle, Kucho Beach |
| Sesoko Island | A small tropical paradise with stunning beaches and crystal-clear water. Perfect for a tranquil getaway and attracts couples and families seeking secluded vacation spots. | Sesoko Beach, Sesoko Island, Snorkeling spots, Beachside cafes |
| Kouri Island | Famous for its scenic bridge and beautiful coastline, Kouri Island is an emerging tourist destination that offers unique local culture and outdoor activities. | Kouri Island Bridge, Kouri Ocean Tower, Beaches, Local seafood restaurants |
| Nakijin Castle | A UNESCO World Heritage site with historical significance. Attracts history buffs and tourists interested in Okinawa's rich cultural heritage and beautiful scenery. | Nakijin Castle Ruins, Cherry blossoms in spring, Historical exhibits, Scenic views of the ocean |
Understanding Airbnb License Requirements & STR Laws in Motobu (2026)
Yes, Motobu, Okinawa Prefecture, Japan enforces high STR regulations. Obtaining a license and ensuring compliance is almost certainly required according to current 2026 STR laws. Always verify the latest short term rental regulations and Airbnb license requirements directly with local government authorities for Motobu to ensure full compliance before hosting.
(Source: AirROI data, 2026, based on 95% licensed listings)
Top Performing Airbnb Properties in Motobu (2026)
Benchmark your potential! Explore examples of top-performing Airbnb properties in Motobubased on Trailing Twelve Month (TTM) revenue. Analyze their characteristics, revenue, occupancy rate, and ADR to understand what drives success in this market.
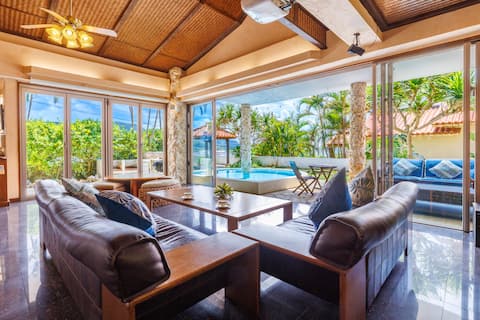
Private villa with pool
Entire Place • 4 bedrooms
![Renew in July! Villa[Jacuzzi /Sauna/max13ppl]](https://a0.muscache.com/im/pictures/miso/Hosting-50490985/original/a0c6154d-c5d1-4e9e-8db2-aca7bb6e16a2.jpeg?im_w=480&im_format=avif)
Renew in July! Villa[Jacuzzi /Sauna/max13ppl]
Entire Place • 3 bedrooms

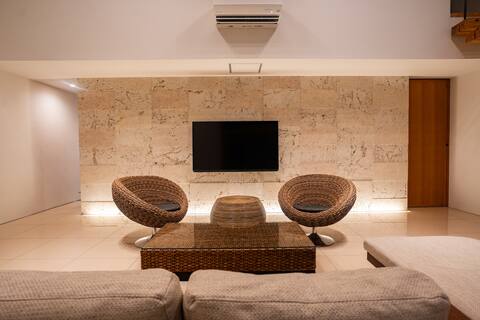
24 people maximum allowed. 5 bed rooms in villa!
Entire Place • 5 bedrooms
Villa with pool "Secret Villas Room 4"
Entire Place • 1 bedroom
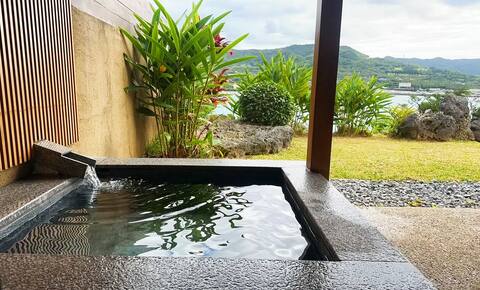
View from the bath at Sesoko Sansui❀ Ao no Mise! Relax in an open-air bath with the Sesoko sea sprea
Private Room • 1 bedroom
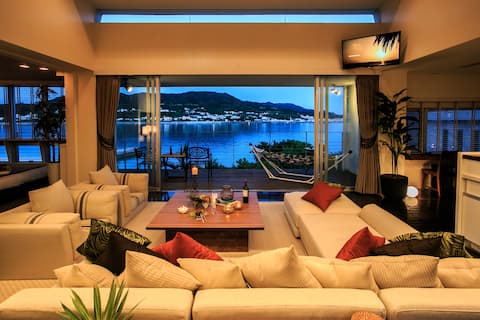
★1-minute walk to the★ beach, a Hawaiian-style house where you can relax★
Entire Place • 3 bedrooms
Note: Performance varies based on location, size, amenities, seasonality, and management quality. Data reflects the past 12 months.
Top Performing Airbnb Hosts in Motobu (2026)
Learn from the best! This table showcases top-performing Airbnb hosts in Motobu based on the number of properties managed and estimated total revenue over the past year. Analyze their scale and performance metrics.
| Host Name | Properties | Grossing Revenue | Stay Reviews | Avg Rating |
|---|---|---|---|---|
| Megumi | 15 | $441,896 | 1404 | 4.83/5.0 |
| Secret Villas By Relapool | 4 | $257,562 | 36 | 4.62/5.0 |
| 佳男 | 4 | $233,072 | 82 | 4.72/5.0 |
| Machidoya | 4 | $193,921 | 257 | 4.94/5.0 |
| アダンリゾート | 11 | $175,560 | 266 | 4.58/5.0 |
| 健 | 3 | $163,946 | 359 | 4.87/5.0 |
| 瀬底倶楽部 | 1 | $130,785 | 34 | 4.91/5.0 |
| Yumi | 4 | $128,864 | 489 | 4.79/5.0 |
| Yae | 1 | $116,507 | 124 | 4.74/5.0 |
| Ash | 3 | $111,665 | 241 | 4.93/5.0 |
Analyzing the strategies of top hosts, such as their property selection, pricing, and guest communication, can offer valuable lessons for optimizing your own Airbnb operations in Motobu.
Dive Deeper: Advanced Motobu STR Market Data (2026)
Ready to unlock more insights? AirROI provides access to advanced metrics and comprehensive Airbnb data for Motobu. Explore detailed analytics beyond this report to refine your investment strategy, optimize pricing, and maximize your vacation rental profits.
Explore Advanced MetricsMotobu Short-Term Rental Market Composition (2026): Property & Room Types
Room Type Distribution
Property Type Distribution
Market Composition Insights for Motobu
- The Motobu Airbnb market composition is heavily skewed towards Entire Home/Apt listings, which make up 85.2% of the 256 active rentals. This indicates strong guest preference for privacy and space.
- Looking at the property type distribution in Motobu, House properties are the most common (68.4%), reflecting the local real estate landscape.
- Houses represent a significant 68.4% portion, catering likely to families or larger groups.
- The presence of 5.1% Hotel/Boutique listings indicates integration with traditional hospitality.
- Smaller segments like unique stays (combined 0.4%) offer potential for unique stay experiences.
Motobu Airbnb Room Capacity Analysis (2026): Bedroom Distribution
Distribution of Listings by Number of Bedrooms
Room Capacity Insights for Motobu
- The dominant room capacity in Motobu is 2 bedrooms listings, making up 33.6% of the market. This suggests a strong demand for properties suitable for couples or solo travelers.
- Together, 2 bedrooms and 1 bedroom properties represent 61.3% of the active Airbnb listings in Motobu, indicating a high concentration in these sizes.
- A significant 31.6% of listings offer 3+ bedrooms, catering to larger groups and families seeking more space in Motobu.
Motobu Vacation Rental Guest Capacity Trends (2026)
Distribution of Listings by Guest Capacity
Guest Capacity Insights for Motobu
- The most common guest capacity trend in Motobu vacation rentals is listings accommodating 8+ guests (37.9%). This suggests the primary traveler segment is likely larger groups.
- Properties designed for 8+ guests and 4 guests dominate the Motobu STR market, accounting for 51.6% of listings.
- 61.4% of properties accommodate 6+ guests, serving the market segment for larger families or group travel in Motobu.
- On average, properties in Motobu are equipped to host 5.9 guests.
Motobu Airbnb Booking Patterns (2026): Available vs. Booked Days
Available Days Distribution
Booked Days Distribution
Booking Pattern Insights for Motobu
- The most common availability pattern in Motobu falls within the 271-366 days range, representing 37.9% of listings. This suggests many properties have significant open periods on their calendars.
- Approximately 67.2% of listings show high availability (181+ days open annually), indicating potential for increased bookings or specific owner usage patterns.
- For booked days, the 91-180 days range is most frequent in Motobu (29.3%), reflecting common guest stay durations or potential owner blocking patterns.
- A notable 33.2% of properties secure long booking periods (181+ days booked per year), highlighting successful long-term rental strategies or significant owner usage.
Motobu Airbnb Minimum Stay Requirements Analysis
Distribution of Listings by Minimum Night Requirement
1 Night
191 listings
74.6% of total
2 Nights
33 listings
12.9% of total
4-6 Nights
2 listings
0.8% of total
30+ Nights
30 listings
11.7% of total
Key Insights
- The most prevalent minimum stay requirement in Motobu is 1 Night, adopted by 74.6% of listings. This highlights the market's preference for shorter, flexible bookings.
- A strong majority (87.5%) of the Motobu Airbnb data shows acceptance of very short stays (1-2 nights), indicating a dynamic, high-turnover market.
- A significant segment (11.7%) caters to monthly stays (30+ nights) in Motobu, pointing to opportunities in the extended-stay market.
Recommendations
- Align with the market by considering a 1 Night minimum stay, as 74.6% of Motobu hosts use this setting.
- Explore offering discounts for stays of 30+ nights to attract the 11.7% of the market seeking extended stays.
- Adjust minimum nights based on seasonality – potentially shorter during low season and longer during peak demand periods in Motobu.
Motobu Airbnb Cancellation Policy Trends Analysis (2026)
Limited
1 listings
0.4% of total
Super Strict 30 Days
1 listings
0.4% of total
Flexible
23 listings
9% of total
Moderate
90 listings
35.2% of total
Firm
125 listings
48.8% of total
Strict
16 listings
6.3% of total
Cancellation Policy Insights for Motobu
- The prevailing Airbnb cancellation policy trend in Motobu is Firm, used by 48.8% of listings.
- A majority (55.1%) of hosts in Motobu utilize Firm or Strict policies, indicating a market where hosts prioritize booking security.
- Strict cancellation policies are quite rare (6.3%), potentially making listings with this policy less competitive unless justified by high demand or property type.
Recommendations for Hosts
- Consider adopting a Firm policy to align with the 48.8% market standard in Motobu.
- Using a Strict policy might deter some guests, as only 6.3% of listings use it. Evaluate if potential revenue protection outweighs possible lower booking rates.
- Regularly review your cancellation policy against competitors and market demand shifts in Motobu.
Motobu STR Booking Lead Time Analysis (2026)
Average Booking Lead Time by Month
Booking Lead Time Insights for Motobu
- The overall average booking lead time for vacation rentals in Motobu is 46 days.
- Guests book furthest in advance for stays during October (average 60 days), likely coinciding with peak travel demand or local events.
- The shortest booking windows occur for stays in January (average 36 days), indicating more last-minute travel plans during this time.
- Seasonally, Fall (52 days avg.) sees the longest lead times, while Spring (39 days avg.) has the shortest, reflecting typical travel planning cycles.
Recommendations for Hosts
- Use the overall average lead time (46 days) as a baseline for your pricing and availability strategy in Motobu.
- For October stays, consider implementing length-of-stay discounts or slightly higher rates for bookings made less than 60 days out to capitalize on advance planning.
- Target marketing efforts for the Fall season well in advance (at least 52 days) to capture early planners.
- Monitor your own booking lead times against these Motobu averages to identify opportunities for dynamic pricing adjustments.
Popular & Essential Airbnb Amenities in Motobu (2026)
Amenity Prevalence
Amenity Insights for Motobu
- Essential amenities in Motobu that guests expect include: Air conditioning, Shampoo, Wifi, Washer, Hair dryer. Lacking these (any) could significantly impact bookings.
- Popular amenities like Free parking on premises, Smoke alarm, TV are common but not universal. Offering these can provide a competitive edge.
Recommendations for Hosts
- Ensure your listing includes all essential amenities for Motobu: Air conditioning, Shampoo, Wifi, Washer, Hair dryer.
- Prioritize adding missing essentials: Air conditioning, Shampoo, Wifi, Washer, Hair dryer.
- Consider adding popular differentiators like Free parking on premises or Smoke alarm to increase appeal.
- Highlight unique or less common amenities you offer (e.g., hot tub, dedicated workspace, EV charger) in your listing description and photos.
- Regularly check competitor amenities in Motobu to stay competitive.
Motobu Airbnb Guest Demographics & Profile Analysis (2026)
Guest Profile Summary for Motobu
- The typical guest profile for Airbnb in Motobu consists of predominantly international visitors (81%), with top international origins including South Korea, typically belonging to the Post-2000s (Gen Z/Alpha) group (50%), primarily speaking English or Chinese.
- Domestic travelers account for 19.4% of guests.
- Key international markets include Japan (19.4%) and South Korea (15.6%).
- Top languages spoken are English (41.7%) followed by Chinese (13.4%).
- A significant demographic segment is the Post-2000s (Gen Z/Alpha) group, representing 50% of guests.
Recommendations for Hosts
- Focus marketing internationally, particularly towards travelers from South Korea.
- Tailor amenities and listing descriptions to appeal to the dominant Post-2000s (Gen Z/Alpha) demographic (e.g., highlight fast WiFi, smart home features, local guides).
- Highlight unique local experiences or amenities relevant to the primary guest profile.
- Consider seasonal promotions aligned with peak travel times for key origin markets.
Nearby Short-Term Rental Market Comparison
How does the Motobu Airbnb market stack up against its neighbors? Compare key performance metrics like average monthly revenue, ADR, and occupancy rates in surrounding areas to understand the broader regional STR landscape.
| Market | Active Properties | Monthly Revenue | Daily Rate | Avg. Occupancy |
|---|---|---|---|---|
| Ginowan | 42 | $3,567 | $199.75 | 60% |
| Onna | 410 | $3,254 | $244.98 | 50% |
| Urasoe | 25 | $3,064 | $202.53 | 48% |
| Chatan | 162 | $3,037 | $226.73 | 49% |
| Ginoza | 12 | $2,887 | $283.90 | 36% |
| Kin | 63 | $2,847 | $181.24 | 53% |
| Nanjo | 101 | $2,819 | $206.31 | 51% |
| Nakijin | 146 | $2,680 | $225.55 | 44% |
| Nago | 204 | $2,626 | $229.82 | 44% |
| Yomitan | 162 | $2,408 | $162.94 | 51% |