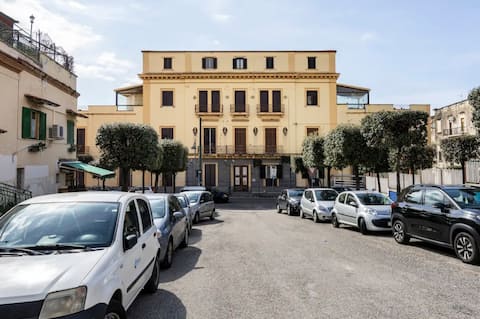
Torre del Greco Airbnb Market Analysis 2026: Short Term Rental Data & Vacation Rental Statistics in Campania, Italy
Is Airbnb profitable in Torre del Greco in 2026? Explore comprehensive Airbnb analytics for Torre del Greco, Campania, Italy to uncover income potential. This 2026 STR market report for Torre del Greco, based on AirROI data from February 2025 to January 2026, reveals key trends in the niche market of 122 active listings.
Whether you're considering an Airbnb investment in Torre del Greco, optimizing your existing vacation rental, or exploring rental arbitrage opportunities, understanding the Torre del Greco Airbnb data is crucial. Navigating the high regulation landscape is key to maximizing your short term rental income potential. Let's dive into the specifics.
Key Torre del Greco Airbnb Performance Metrics Overview
Monthly Airbnb Revenue Variations & Income Potential in Torre del Greco (2026)
Understanding the monthly revenue variations for Airbnb listings in Torre del Greco is key to maximizing your short term rental income potential. Seasonality significantly impacts earnings. Our analysis, based on data from the past 12 months, shows that the peak revenue month for STRs in Torre del Greco is typically August, while January often presents the lowest earnings, highlighting opportunities for strategic pricing adjustments during shoulder and low seasons. Explore the typical Airbnb income in Torre del Greco across different performance tiers:
- Best-in-class properties (Top 10%) achieve $3,079+ monthly, often utilizing dynamic pricing and superior guest experiences.
- Strong performing properties (Top 25%) earn $1,921 or more, indicating effective management and desirable locations/amenities.
- Typical properties (Median) generate around $1,128 per month, representing the average market performance.
- Entry-level properties (Bottom 25%) see earnings around $603, often with potential for optimization.
Average Monthly Airbnb Earnings Trend in Torre del Greco
Torre del Greco Airbnb Occupancy Rate Trends (2026)
Maximize your bookings by understanding the Torre del Greco STR occupancy trends. Seasonal demand shifts significantly influence how often properties are booked. Typically, Augustsees the highest demand (peak season occupancy), while January experiences the lowest (low season). Effective strategies, like adjusting minimum stays or offering promotions, can boost occupancy during slower periods. Here's how different property tiers perform in Torre del Greco:
- Best-in-class properties (Top 10%) achieve 73%+ occupancy, indicating high desirability and potentially optimized availability.
- Strong performing properties (Top 25%) maintain 56% or higher occupancy, suggesting good market fit and guest satisfaction.
- Typical properties (Median) have an occupancy rate around 38%.
- Entry-level properties (Bottom 25%) average 19% occupancy, potentially facing higher vacancy.
Average Monthly Occupancy Rate Trend in Torre del Greco
Average Daily Rate (ADR) Airbnb Trends in Torre del Greco (2026)
Effective short term rental pricing strategy in Torre del Greco involves understanding monthly ADR fluctuations. The Average Daily Rate (ADR) for Airbnb in Torre del Greco typically peaks in August and dips lowest during February. Leveraging Airbnb dynamic pricing tools or strategies based on this seasonality can significantly boost revenue. Here's a look at the typical nightly rates achieved:
- Best-in-class properties (Top 10%) command rates of $186+ per night, often due to premium features or locations.
- Strong performing properties (Top 25%) achieve nightly rates of $130 or more.
- Typical properties (Median) charge around $92 per night.
- Entry-level properties (Bottom 25%) earn around $72 per night.
Average Daily Rate (ADR) Trend by Month in Torre del Greco
Get Live Torre del Greco Market Intelligence 👇

Explore Real-time Analytics
Airbnb Seasonality Analysis & Trends in Torre del Greco (2026)
Peak Season (August, July, September)
- Revenue averages $2,473 per month
- Occupancy rates average 54.0%
- Daily rates average $125
Shoulder Season
- Revenue averages $1,507 per month
- Occupancy maintains around 40.4%
- Daily rates hold near $113
Low Season (January, February, December)
- Revenue drops to average $765 per month
- Occupancy decreases to average 23.5%
- Daily rates adjust to average $112
Seasonality Insights for Torre del Greco
- The Airbnb seasonality in Torre del Greco shows highly seasonal trends requiring careful strategy. While the sections above show seasonal averages, it's also insightful to look at the extremes:
- During the high season, the absolute peak month showcases Torre del Greco's highest earning potential, with monthly revenues capable of climbing to $2,827, occupancy reaching a high of 59.1%, and ADRs peaking at $127.
- Conversely, the slowest single month of the year, typically falling within the low season, marks the market's lowest point. In this month, revenue might dip to $625, occupancy could drop to 18.0%, and ADRs may adjust down to $103.
- Understanding both the seasonal averages and these monthly peaks and troughs in revenue, occupancy, and ADR is crucial for maximizing your Airbnb profit potential in Torre del Greco.
Seasonal Strategies for Maximizing Profit
- Peak Season: Maximize revenue through premium pricing and potentially longer minimum stays. Ensure high availability.
- Low Season: Offer competitive pricing, special promotions (e.g., extended stay discounts), and flexible cancellation policies. Target off-season travelers like remote workers or budget-conscious guests.
- Shoulder Seasons: Implement dynamic pricing that balances peak and low rates. Target weekend travelers or specific events. Offer slightly more flexible terms than peak season.
- Regularly analyze your own performance against these Torre del Greco seasonality benchmarks and adjust your pricing and availability strategy accordingly.
Best Areas for Airbnb Investment in Torre del Greco (2026)
Exploring the top neighborhoods for short-term rentals in Torre del Greco? This section highlights key areas, outlining why they are attractive for hosts and guests, along with notable local attractions. Consider these locations based on your target guest profile and investment strategy.
| Neighborhood / Area | Why Host Here? (Target Guests & Appeal) | Key Attractions & Landmarks |
|---|---|---|
| Torre Annunziata | A neighboring town known for its archaeological sites and proximity to Mount Vesuvius, making it appealing for historical tourism. | Pompeii Archaeological Park, Mount Vesuvius, Lido di Oplontis, Villa di Poppea, Museo Archeologico Virtuale |
| Ercolano | Famous for the Herculaneum archaeological site, it's a small, historic town with beautiful views of the Bay of Naples. | Herculaneum Archaeological Site, Ercolano Ruins, Port of Ercolano, Serapeo of Pozzuoli, La Favorita |
| Vico Equense | Known for its stunning coastal views and proximity to Sorrento, it attracts both beach lovers and culinary enthusiasts with its seafood. | Marina di Vico, Fornillo Beach, Monte Faito, Castello Giusso, Punta della Campanella |
| Sorrento | A popular tourist destination known for its picturesque scenery, shopping, and access to the Amalfi Coast, Sorrento is a prime location. | Piazza Tasso, Marina Grande, Sorrento Cathedral, Sedil Dominova, Punta del Capo |
| Naples Center | The vibrant heart of Naples, known for its rich culture, historic sites, and delicious cuisine, this area offers endless opportunities for tourists. | Naples National Archaeological Museum, Spaccanapoli, Capodimonte Museum, Castel Nuovo, Pizza Napoletana |
| Positano | A picturesque cliffside village and a top destination on the Amalfi Coast, famous for its unique architecture and beautiful beaches. | Spiaggia Grande, Fornillo Beach, Le Sirenuse, Church of Santa Maria Assunta, Path of the Gods |
| Maiori | Known for its beautiful long beach and well-preserved medieval architecture, it attracts visitors looking for a beach getaway. | Maiori Beach, Castle of San Nicola de Thoro-Plano, Church of Santa Maria a Mare, Corso Reginna, Sunset views |
| Cetara | A charming fishing village famous for its anchovies and coastal beauty, offering a more tranquil experience away from tourist crowds. | Cetara Beach, Church of San Pietro Apostolo, Ancient Tuna Fishery, Vietri sul Mare, Scenic coastal trails |
Understanding Airbnb License Requirements & STR Laws in Torre del Greco (2026)
Yes, Torre del Greco, Campania, Italy enforces high STR regulations. Obtaining a license and ensuring compliance is almost certainly required according to current 2026 STR laws. Always verify the latest short term rental regulations and Airbnb license requirements directly with local government authorities for Torre del Greco to ensure full compliance before hosting.
(Source: AirROI data, 2026, based on 88% licensed listings)
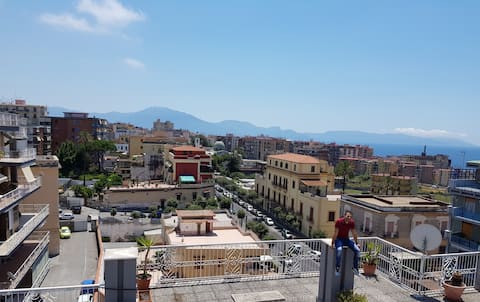
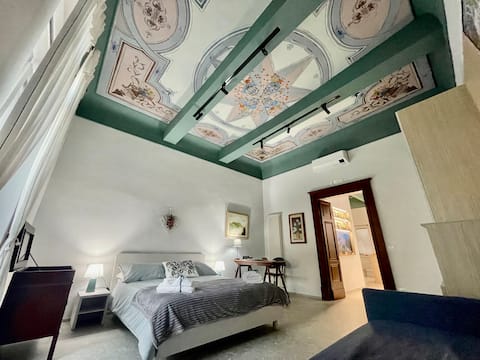
Top Performing Airbnb Properties in Torre del Greco (2026)
Benchmark your potential! Explore examples of top-performing Airbnb properties in Torre del Grecobased on Trailing Twelve Month (TTM) revenue. Analyze their characteristics, revenue, occupancy rate, and ADR to understand what drives success in this market.
3 APT by CasaCondo: 5-Star Stay for 30 in History
Entire Place • 9 bedrooms
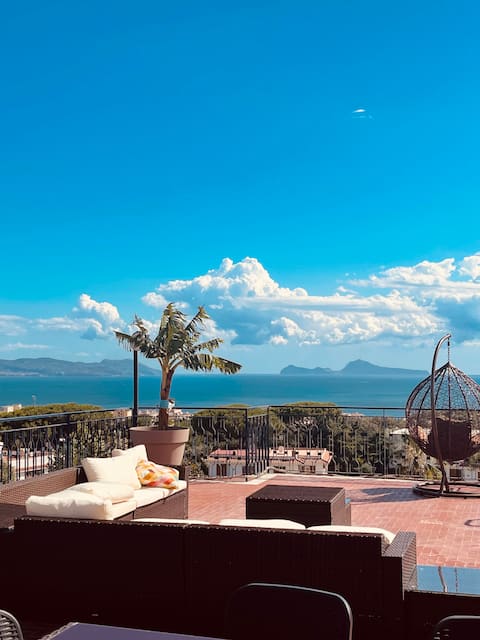
Apartment with Private Terrace Panoramic Sea View
Entire Place • 4 bedrooms
2 APT by CasaCondo: Cosy stay in 20 on Golden Mile
Entire Place • 5 bedrooms

Liza Leopardi and The Volcano Lover-Dimora Storica
Entire Place • 2 bedrooms

CasaCondo Aniello: Dawn over Unesco Golden Mile
Entire Place • 4 bedrooms
Near Pompeii, Vesuvius, Naples, Sorrento, Il Cammeo
Entire Place • 1 bedroom
Note: Performance varies based on location, size, amenities, seasonality, and management quality. Data reflects the past 12 months.
Top Performing Airbnb Hosts in Torre del Greco (2026)
Learn from the best! This table showcases top-performing Airbnb hosts in Torre del Greco based on the number of properties managed and estimated total revenue over the past year. Analyze their scale and performance metrics.
| Host Name | Properties | Grossing Revenue | Stay Reviews | Avg Rating |
|---|---|---|---|---|
| Giuseppe Di Filippo | 5 | $326,324 | 710 | 4.83/5.0 |
| Antonino | 12 | $204,224 | 473 | 4.42/5.0 |
| Panorama Love To Stay | 3 | $135,544 | 112 | 4.73/5.0 |
| Michele | 6 | $98,130 | 14 | 4.82/5.0 |
| Raffaele | 2 | $68,237 | 199 | 4.99/5.0 |
| Ernesto | 3 | $63,485 | 335 | 4.92/5.0 |
| Fabio | 1 | $56,673 | 229 | 4.87/5.0 |
| Francesco | 6 | $49,973 | 115 | 4.75/5.0 |
| CasinadeGoyzueta | 4 | $48,414 | 133 | 4.95/5.0 |
| Stefania | 1 | $31,294 | 30 | 4.53/5.0 |
Analyzing the strategies of top hosts, such as their property selection, pricing, and guest communication, can offer valuable lessons for optimizing your own Airbnb operations in Torre del Greco.
Dive Deeper: Advanced Torre del Greco STR Market Data (2026)
Ready to unlock more insights? AirROI provides access to advanced metrics and comprehensive Airbnb data for Torre del Greco. Explore detailed analytics beyond this report to refine your investment strategy, optimize pricing, and maximize your vacation rental profits.
Explore Advanced MetricsTorre del Greco Short-Term Rental Market Composition (2026): Property & Room Types
Room Type Distribution
Property Type Distribution
Market Composition Insights for Torre del Greco
- The Torre del Greco Airbnb market composition is heavily skewed towards Entire Home/Apt listings, which make up 72.1% of the 122 active rentals. This indicates strong guest preference for privacy and space.
- Looking at the property type distribution in Torre del Greco, Apartment/Condo properties are the most common (50%), reflecting the local real estate landscape.
- Houses represent a significant 27.9% portion, catering likely to families or larger groups.
- The presence of 20.5% Hotel/Boutique listings indicates integration with traditional hospitality.
- Smaller segments like outdoor/unique (combined 1.6%) offer potential for unique stay experiences.
Torre del Greco Airbnb Room Capacity Analysis (2026): Bedroom Distribution
Distribution of Listings by Number of Bedrooms
Room Capacity Insights for Torre del Greco
- The dominant room capacity in Torre del Greco is 1 bedroom listings, making up 48.4% of the market. This suggests a strong demand for properties suitable for couples or solo travelers.
- Together, 1 bedroom and 2 bedrooms properties represent 73.0% of the active Airbnb listings in Torre del Greco, indicating a high concentration in these sizes.
- Listings with 3+ bedrooms (8.1%) represent a smaller niche, potentially indicating an underserved market for larger group accommodations in Torre del Greco.
Torre del Greco Vacation Rental Guest Capacity Trends (2026)
Distribution of Listings by Guest Capacity
Guest Capacity Insights for Torre del Greco
- The most common guest capacity trend in Torre del Greco vacation rentals is listings accommodating 4 guests (32.8%). This suggests the primary traveler segment is likely small families or groups.
- Properties designed for 4 guests and 6 guests dominate the Torre del Greco STR market, accounting for 45.9% of listings.
- 22.1% of properties accommodate 6+ guests, serving the market segment for larger families or group travel in Torre del Greco.
- On average, properties in Torre del Greco are equipped to host 3.7 guests.
Torre del Greco Airbnb Booking Patterns (2026): Available vs. Booked Days
Available Days Distribution
Booked Days Distribution
Booking Pattern Insights for Torre del Greco
- The most common availability pattern in Torre del Greco falls within the 271-366 days range, representing 47.5% of listings. This suggests many properties have significant open periods on their calendars.
- Approximately 81.9% of listings show high availability (181+ days open annually), indicating potential for increased bookings or specific owner usage patterns.
- For booked days, the 91-180 days range is most frequent in Torre del Greco (35.2%), reflecting common guest stay durations or potential owner blocking patterns.
- A notable 19.7% of properties secure long booking periods (181+ days booked per year), highlighting successful long-term rental strategies or significant owner usage.
Torre del Greco Airbnb Minimum Stay Requirements Analysis
Distribution of Listings by Minimum Night Requirement
1 Night
51 listings
41.8% of total
2 Nights
23 listings
18.9% of total
3 Nights
3 listings
2.5% of total
7-29 Nights
5 listings
4.1% of total
30+ Nights
40 listings
32.8% of total
Key Insights
- The most prevalent minimum stay requirement in Torre del Greco is 1 Night, adopted by 41.8% of listings. This highlights the market's preference for shorter, flexible bookings.
- A strong majority (60.7%) of the Torre del Greco Airbnb data shows acceptance of very short stays (1-2 nights), indicating a dynamic, high-turnover market.
- A significant segment (32.8%) caters to monthly stays (30+ nights) in Torre del Greco, pointing to opportunities in the extended-stay market.
Recommendations
- Align with the market by considering a 1 Night minimum stay, as 41.8% of Torre del Greco hosts use this setting.
- Explore offering discounts for stays of 30+ nights to attract the 32.8% of the market seeking extended stays.
- Adjust minimum nights based on seasonality – potentially shorter during low season and longer during peak demand periods in Torre del Greco.
Torre del Greco Airbnb Cancellation Policy Trends Analysis (2026)
Super Strict 60 Days
1 listings
0.8% of total
Flexible
31 listings
25.4% of total
Moderate
66 listings
54.1% of total
Firm
23 listings
18.9% of total
Strict
1 listings
0.8% of total
Cancellation Policy Insights for Torre del Greco
- The prevailing Airbnb cancellation policy trend in Torre del Greco is Moderate, used by 54.1% of listings.
- The market strongly favors guest-friendly terms, with 79.5% of listings offering Flexible or Moderate policies. This suggests guests in Torre del Greco may expect booking flexibility.
- Strict cancellation policies are quite rare (0.8%), potentially making listings with this policy less competitive unless justified by high demand or property type.
Recommendations for Hosts
- Consider adopting a Moderate policy to align with the 54.1% market standard in Torre del Greco.
- Using a Strict policy might deter some guests, as only 0.8% of listings use it. Evaluate if potential revenue protection outweighs possible lower booking rates.
- Regularly review your cancellation policy against competitors and market demand shifts in Torre del Greco.
Torre del Greco STR Booking Lead Time Analysis (2026)
Average Booking Lead Time by Month
Booking Lead Time Insights for Torre del Greco
- The overall average booking lead time for vacation rentals in Torre del Greco is 56 days.
- Guests book furthest in advance for stays during August (average 81 days), likely coinciding with peak travel demand or local events.
- The shortest booking windows occur for stays in January (average 25 days), indicating more last-minute travel plans during this time.
- Seasonally, Summer (72 days avg.) sees the longest lead times, while Winter (37 days avg.) has the shortest, reflecting typical travel planning cycles.
Recommendations for Hosts
- Use the overall average lead time (56 days) as a baseline for your pricing and availability strategy in Torre del Greco.
- For August stays, consider implementing length-of-stay discounts or slightly higher rates for bookings made less than 81 days out to capitalize on advance planning.
- Target marketing efforts for the Summer season well in advance (at least 72 days) to capture early planners.
- Monitor your own booking lead times against these Torre del Greco averages to identify opportunities for dynamic pricing adjustments.
Popular & Essential Airbnb Amenities in Torre del Greco (2026)
Amenity Prevalence
Amenity Insights for Torre del Greco
- Essential amenities in Torre del Greco that guests expect include: Wifi. Lacking these (this) could significantly impact bookings.
- Popular amenities like TV, Hair dryer, Hot water are common but not universal. Offering these can provide a competitive edge.
Recommendations for Hosts
- Ensure your listing includes all essential amenities for Torre del Greco: Wifi.
- Prioritize adding missing essentials: Wifi.
- Consider adding popular differentiators like TV or Hair dryer to increase appeal.
- Highlight unique or less common amenities you offer (e.g., hot tub, dedicated workspace, EV charger) in your listing description and photos.
- Regularly check competitor amenities in Torre del Greco to stay competitive.
Torre del Greco Airbnb Guest Demographics & Profile Analysis (2026)
Guest Profile Summary for Torre del Greco
- The typical guest profile for Airbnb in Torre del Greco consists of predominantly international visitors (92%), with top international origins including United States, typically belonging to the Post-2000s (Gen Z/Alpha) group (50%), primarily speaking English or French.
- Domestic travelers account for 8.5% of guests.
- Key international markets include France (18.2%) and United States (15.2%).
- Top languages spoken are English (39.7%) followed by French (14.9%).
- A significant demographic segment is the Post-2000s (Gen Z/Alpha) group, representing 50% of guests.
Recommendations for Hosts
- Focus marketing internationally, particularly towards travelers from United States.
- Tailor amenities and listing descriptions to appeal to the dominant Post-2000s (Gen Z/Alpha) demographic (e.g., highlight fast WiFi, smart home features, local guides).
- Highlight unique local experiences or amenities relevant to the primary guest profile.
- Consider seasonal promotions aligned with peak travel times for key origin markets.
Nearby Short-Term Rental Market Comparison
How does the Torre del Greco Airbnb market stack up against its neighbors? Compare key performance metrics like average monthly revenue, ADR, and occupancy rates in surrounding areas to understand the broader regional STR landscape.
| Market | Active Properties | Monthly Revenue | Daily Rate | Avg. Occupancy |
|---|---|---|---|---|
| Positano | 740 | $6,727 | $653.26 | 52% |
| Praiano | 365 | $4,340 | $447.02 | 50% |
| Capri | 424 | $3,912 | $586.24 | 37% |
| Conca dei Marini | 132 | $3,899 | $417.87 | 45% |
| Sorrento | 1,606 | $3,821 | $344.29 | 48% |
| Massa Lubrense | 813 | $3,392 | $408.38 | 42% |
| Furore | 149 | $3,226 | $353.64 | 52% |
| Amalfi | 506 | $3,135 | $319.20 | 45% |
| Ravello | 256 | $3,119 | $333.17 | 42% |
| Atrani | 130 | $2,702 | $224.39 | 50% |