Meta Airbnb Market Analysis 2026: Short Term Rental Data & Vacation Rental Statistics in Campania, Italy
Is Airbnb profitable in Meta in 2026? Explore comprehensive Airbnb analytics for Meta, Campania, Italy to uncover income potential. This 2026 STR market report for Meta, based on AirROI data from February 2025 to January 2026, reveals key trends in the market of 221 active listings.
Whether you're considering an Airbnb investment in Meta, optimizing your existing vacation rental, or exploring rental arbitrage opportunities, understanding the Meta Airbnb data is crucial. Navigating the high regulation landscape is key to maximizing your short term rental income potential. Let's dive into the specifics.
Key Meta Airbnb Performance Metrics Overview
Monthly Airbnb Revenue Variations & Income Potential in Meta (2026)
Understanding the monthly revenue variations for Airbnb listings in Meta is key to maximizing your short term rental income potential. Seasonality significantly impacts earnings. Our analysis, based on data from the past 12 months, shows that the peak revenue month for STRs in Meta is typically August, while January often presents the lowest earnings, highlighting opportunities for strategic pricing adjustments during shoulder and low seasons. Explore the typical Airbnb income in Meta across different performance tiers:
- Best-in-class properties (Top 10%) achieve $4,603+ monthly, often utilizing dynamic pricing and superior guest experiences.
- Strong performing properties (Top 25%) earn $2,894 or more, indicating effective management and desirable locations/amenities.
- Typical properties (Median) generate around $1,889 per month, representing the average market performance.
- Entry-level properties (Bottom 25%) see earnings around $1,054, often with potential for optimization.
Average Monthly Airbnb Earnings Trend in Meta
Meta Airbnb Occupancy Rate Trends (2026)
Maximize your bookings by understanding the Meta STR occupancy trends. Seasonal demand shifts significantly influence how often properties are booked. Typically, Septembersees the highest demand (peak season occupancy), while January experiences the lowest (low season). Effective strategies, like adjusting minimum stays or offering promotions, can boost occupancy during slower periods. Here's how different property tiers perform in Meta:
- Best-in-class properties (Top 10%) achieve 75%+ occupancy, indicating high desirability and potentially optimized availability.
- Strong performing properties (Top 25%) maintain 61% or higher occupancy, suggesting good market fit and guest satisfaction.
- Typical properties (Median) have an occupancy rate around 42%.
- Entry-level properties (Bottom 25%) average 22% occupancy, potentially facing higher vacancy.
Average Monthly Occupancy Rate Trend in Meta
Average Daily Rate (ADR) Airbnb Trends in Meta (2026)
Effective short term rental pricing strategy in Meta involves understanding monthly ADR fluctuations. The Average Daily Rate (ADR) for Airbnb in Meta typically peaks in August and dips lowest during March. Leveraging Airbnb dynamic pricing tools or strategies based on this seasonality can significantly boost revenue. Here's a look at the typical nightly rates achieved:
- Best-in-class properties (Top 10%) command rates of $286+ per night, often due to premium features or locations.
- Strong performing properties (Top 25%) achieve nightly rates of $202 or more.
- Typical properties (Median) charge around $144 per night.
- Entry-level properties (Bottom 25%) earn around $114 per night.
Average Daily Rate (ADR) Trend by Month in Meta
Get Live Meta Market Intelligence 👇

Explore Real-time Analytics
Airbnb Seasonality Analysis & Trends in Meta (2026)
Peak Season (August, September, June)
- Revenue averages $3,777 per month
- Occupancy rates average 61.9%
- Daily rates average $194
Shoulder Season
- Revenue averages $2,183 per month
- Occupancy maintains around 42.8%
- Daily rates hold near $168
Low Season (January, February, December)
- Revenue drops to average $1,065 per month
- Occupancy decreases to average 24.1%
- Daily rates adjust to average $163
Seasonality Insights for Meta
- The Airbnb seasonality in Meta shows highly seasonal trends requiring careful strategy. While the sections above show seasonal averages, it's also insightful to look at the extremes:
- During the high season, the absolute peak month showcases Meta's highest earning potential, with monthly revenues capable of climbing to $4,040, occupancy reaching a high of 65.1%, and ADRs peaking at $199.
- Conversely, the slowest single month of the year, typically falling within the low season, marks the market's lowest point. In this month, revenue might dip to $955, occupancy could drop to 18.7%, and ADRs may adjust down to $155.
- Understanding both the seasonal averages and these monthly peaks and troughs in revenue, occupancy, and ADR is crucial for maximizing your Airbnb profit potential in Meta.
Seasonal Strategies for Maximizing Profit
- Peak Season: Maximize revenue through premium pricing and potentially longer minimum stays. Ensure high availability.
- Low Season: Offer competitive pricing, special promotions (e.g., extended stay discounts), and flexible cancellation policies. Target off-season travelers like remote workers or budget-conscious guests.
- Shoulder Seasons: Implement dynamic pricing that balances peak and low rates. Target weekend travelers or specific events. Offer slightly more flexible terms than peak season.
- Regularly analyze your own performance against these Meta seasonality benchmarks and adjust your pricing and availability strategy accordingly.
Best Areas for Airbnb Investment in Meta (2026)
Exploring the top neighborhoods for short-term rentals in Meta? This section highlights key areas, outlining why they are attractive for hosts and guests, along with notable local attractions. Consider these locations based on your target guest profile and investment strategy.
| Neighborhood / Area | Why Host Here? (Target Guests & Appeal) | Key Attractions & Landmarks |
|---|---|---|
| Positano | Stunning cliffside village famous for its picturesque views, vibrant colors, and beautiful beaches. A top destination for luxury travelers seeking romance and natural beauty. | Spiaggia Grande, Path of the Gods, Fornillo Beach, Positano Church, Shop local boutiques |
| Amalfi | Historical coastal town known for its beautiful cathedral and rich maritime history. A great location for those exploring the Amalfi Coast. | Amalfi Cathedral, Villa Rufolo, Amalfi Coast Drive, Beaches of Amalfi, Paper Museum of Amalfi |
| Sorrento | Charming town with stunning views of the Bay of Naples, famous for its limoncello. Ideal for tourists wanting to explore both the coast and nearby attractions. | Piazza Tasso, Marina Grande, Sedil Dominova, Sorrento Cathedral, Cloister of San Francesco |
| Capri | Luxurious island known for its breathtaking landscapes and high-end shopping. Popular among celebrities and tourists seeking exclusivity and natural beauty. | Blue Grotto, Faraglioni Rocks, Villa Jovis, Piazzetta di Capri, Gardens of Augustus |
| Ravello | Known for its stunning gardens and views, it's a perfect retreat for those seeking tranquility and breathtaking panoramas. | Villa Cimbrone, Villa Rufolo, Ravello's Belvedere, Ravello Festival, San Giovanni del Toro |
| Salerno | Lively coastal city with a picturesque waterfront and rich history. Great for those wanting a mix of culture and beach life without the larger tourist crowds. | Salerno Cathedral, Minerva's Garden, Castello di Arechi, Historic center, Sea promenade |
| Praiano | Less crowded than Positano, this quaint village offers breathtaking views and a more intimate atmosphere for travelers looking for peace and beauty. | Marina di Praia, Sentiero degli Dei, Church of San Gennaro, Torre di Grado, Scalinatella |
| Pompeii | Famous for its archaeological site, Pompeii attracts history enthusiasts and tourists keen on exploring ancient Roman life. A must-visit for those near Naples. | Pompeii Archaeological Park, Villa of the Mysteries, Pompeii Amphitheatre, Forum, Temple of Apollo |
Understanding Airbnb License Requirements & STR Laws in Meta (2026)
Yes, Meta, Campania, Italy enforces high STR regulations. Obtaining a license and ensuring compliance is almost certainly required according to current 2026 STR laws. Always verify the latest short term rental regulations and Airbnb license requirements directly with local government authorities for Meta to ensure full compliance before hosting.
(Source: AirROI data, 2026, based on 89% licensed listings)
Top Performing Airbnb Properties in Meta (2026)
Benchmark your potential! Explore examples of top-performing Airbnb properties in Metabased on Trailing Twelve Month (TTM) revenue. Analyze their characteristics, revenue, occupancy rate, and ADR to understand what drives success in this market.

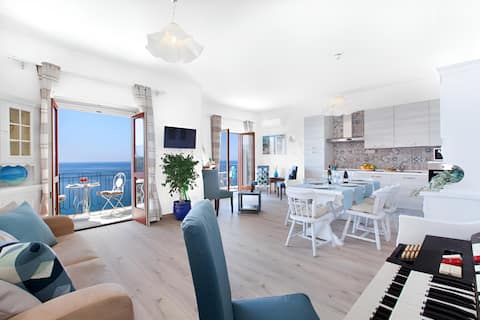
Spacious&Elegant 3 bedroom apartment near Sorrento
Entire Place • 3 bedrooms
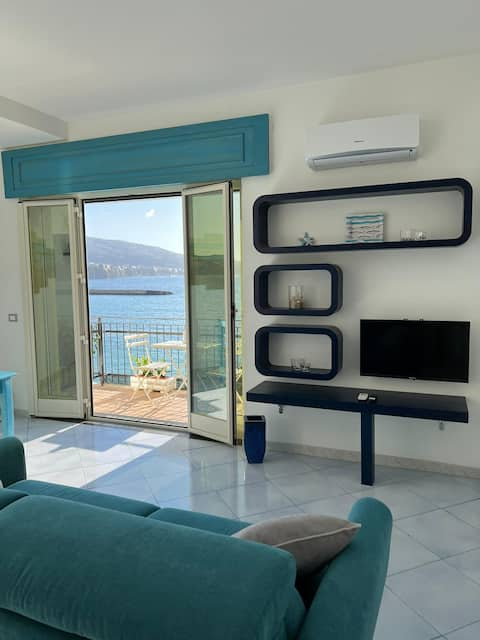
Maré Sunset & Relax
Entire Place • 2 bedrooms
Casa Vittoria
Entire Place • 3 bedrooms
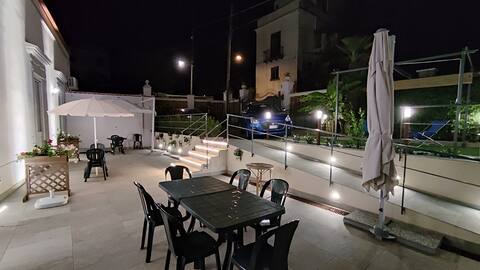
Residence Mare di Sotto Sorrento Conca Beach
Entire Place • 1 bedroom
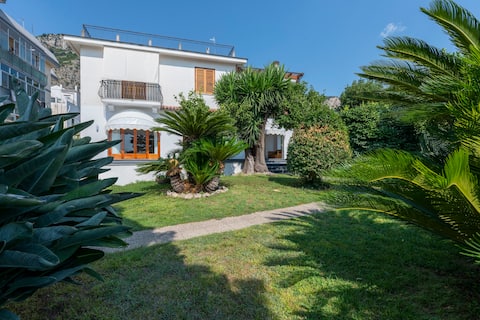
Villino Campagna
Entire Place • 4 bedrooms

Antico Casale Sorrentino + Suite (Independent Villa)
Entire Place • 3 bedrooms
Note: Performance varies based on location, size, amenities, seasonality, and management quality. Data reflects the past 12 months.
Top Performing Airbnb Hosts in Meta (2026)
Learn from the best! This table showcases top-performing Airbnb hosts in Meta based on the number of properties managed and estimated total revenue over the past year. Analyze their scale and performance metrics.
| Host Name | Properties | Grossing Revenue | Stay Reviews | Avg Rating |
|---|---|---|---|---|
| Francesco | 15 | $361,446 | 458 | 4.76/5.0 |
| Maria | 10 | $208,785 | 143 | 4.55/5.0 |
| Andrea | 9 | $191,484 | 125 | 4.52/5.0 |
| Smart Holiday Sorrento | 9 | $138,973 | 129 | 4.68/5.0 |
| Rosalia | 7 | $134,438 | 43 | 4.87/5.0 |
| Antonino | 3 | $133,358 | 66 | 4.69/5.0 |
| Mariangela | 3 | $122,891 | 413 | 4.84/5.0 |
| Giuliana | 2 | $121,831 | 107 | 4.91/5.0 |
| Bed And Breakfast | 6 | $121,585 | 204 | 4.86/5.0 |
| Viviana | 6 | $113,615 | 96 | 4.91/5.0 |
Analyzing the strategies of top hosts, such as their property selection, pricing, and guest communication, can offer valuable lessons for optimizing your own Airbnb operations in Meta.
Dive Deeper: Advanced Meta STR Market Data (2026)
Ready to unlock more insights? AirROI provides access to advanced metrics and comprehensive Airbnb data for Meta. Explore detailed analytics beyond this report to refine your investment strategy, optimize pricing, and maximize your vacation rental profits.
Explore Advanced MetricsMeta Short-Term Rental Market Composition (2026): Property & Room Types
Room Type Distribution
Property Type Distribution
Market Composition Insights for Meta
- The Meta Airbnb market composition is heavily skewed towards Entire Home/Apt listings, which make up 65.6% of the 221 active rentals. This indicates strong guest preference for privacy and space.
- However, a notable 31.7% share for Private Rooms suggests opportunities for budget-conscious travelers or hosts renting out spare rooms.
- Looking at the property type distribution in Meta, Apartment/Condo properties are the most common (47.5%), reflecting the local real estate landscape.
- Houses represent a significant 31.2% portion, catering likely to families or larger groups.
- The presence of 19.5% Hotel/Boutique listings indicates integration with traditional hospitality.
- Smaller segments like others (combined 1.8%) offer potential for unique stay experiences.
Meta Airbnb Room Capacity Analysis (2026): Bedroom Distribution
Distribution of Listings by Number of Bedrooms
Room Capacity Insights for Meta
- The dominant room capacity in Meta is 1 bedroom listings, making up 42.5% of the market. This suggests a strong demand for properties suitable for couples or solo travelers.
- Together, 1 bedroom and 2 bedrooms properties represent 61.1% of the active Airbnb listings in Meta, indicating a high concentration in these sizes.
- Listings with 3+ bedrooms (8.2%) represent a smaller niche, potentially indicating an underserved market for larger group accommodations in Meta.
Meta Vacation Rental Guest Capacity Trends (2026)
Distribution of Listings by Guest Capacity
Guest Capacity Insights for Meta
- The most common guest capacity trend in Meta vacation rentals is listings accommodating 4 guests (23.1%). This suggests the primary traveler segment is likely small families or groups.
- Properties designed for 4 guests and 2 guests dominate the Meta STR market, accounting for 43.5% of listings.
- 13.1% of properties accommodate 6+ guests, serving the market segment for larger families or group travel in Meta.
- On average, properties in Meta are equipped to host 2.8 guests.
Meta Airbnb Booking Patterns (2026): Available vs. Booked Days
Available Days Distribution
Booked Days Distribution
Booking Pattern Insights for Meta
- The most common availability pattern in Meta falls within the 271-366 days range, representing 41.2% of listings. This suggests many properties have significant open periods on their calendars.
- Approximately 81.5% of listings show high availability (181+ days open annually), indicating potential for increased bookings or specific owner usage patterns.
- For booked days, the 91-180 days range is most frequent in Meta (39.8%), reflecting common guest stay durations or potential owner blocking patterns.
- A notable 20.4% of properties secure long booking periods (181+ days booked per year), highlighting successful long-term rental strategies or significant owner usage.
Meta Airbnb Minimum Stay Requirements Analysis
Distribution of Listings by Minimum Night Requirement
1 Night
14 listings
6.3% of total
2 Nights
37 listings
16.7% of total
3 Nights
35 listings
15.8% of total
4-6 Nights
8 listings
3.6% of total
7-29 Nights
4 listings
1.8% of total
30+ Nights
123 listings
55.7% of total
Key Insights
- The most prevalent minimum stay requirement in Meta is 30+ Nights, adopted by 55.7% of listings. This highlights the market's preference for longer commitments.
- A significant segment (55.7%) caters to monthly stays (30+ nights) in Meta, pointing to opportunities in the extended-stay market.
Recommendations
- Align with the market by considering a 30+ Nights minimum stay, as 55.7% of Meta hosts use this setting.
- If feasible, allowing 1-night stays, especially midweek or during low season, could capture last-minute bookings, as only 6.3% currently do.
- Explore offering discounts for stays of 30+ nights to attract the 55.7% of the market seeking extended stays.
- Adjust minimum nights based on seasonality – potentially shorter during low season and longer during peak demand periods in Meta.
Meta Airbnb Cancellation Policy Trends Analysis (2026)
Super Strict 30 Days
32 listings
14.5% of total
Limited
9 listings
4.1% of total
Flexible
22 listings
10% of total
Moderate
107 listings
48.4% of total
Firm
49 listings
22.2% of total
Strict
2 listings
0.9% of total
Cancellation Policy Insights for Meta
- The prevailing Airbnb cancellation policy trend in Meta is Moderate, used by 48.4% of listings.
- There's a relatively balanced mix between guest-friendly (58.4%) and stricter (23.1%) policies, offering choices for different guest needs.
- Strict cancellation policies are quite rare (0.9%), potentially making listings with this policy less competitive unless justified by high demand or property type.
Recommendations for Hosts
- Consider adopting a Moderate policy to align with the 48.4% market standard in Meta.
- Using a Strict policy might deter some guests, as only 0.9% of listings use it. Evaluate if potential revenue protection outweighs possible lower booking rates.
- Regularly review your cancellation policy against competitors and market demand shifts in Meta.
Meta STR Booking Lead Time Analysis (2026)
Average Booking Lead Time by Month
Booking Lead Time Insights for Meta
- The overall average booking lead time for vacation rentals in Meta is 52 days.
- Guests book furthest in advance for stays during August (average 64 days), likely coinciding with peak travel demand or local events.
- The shortest booking windows occur for stays in January (average 27 days), indicating more last-minute travel plans during this time.
- Seasonally, Summer (57 days avg.) sees the longest lead times, while Winter (37 days avg.) has the shortest, reflecting typical travel planning cycles.
Recommendations for Hosts
- Use the overall average lead time (52 days) as a baseline for your pricing and availability strategy in Meta.
- For August stays, consider implementing length-of-stay discounts or slightly higher rates for bookings made less than 64 days out to capitalize on advance planning.
- Target marketing efforts for the Summer season well in advance (at least 57 days) to capture early planners.
- Monitor your own booking lead times against these Meta averages to identify opportunities for dynamic pricing adjustments.
Popular & Essential Airbnb Amenities in Meta (2026)
Amenity Prevalence
Amenity Insights for Meta
- Essential amenities in Meta that guests expect include: Wifi, Air conditioning, Hair dryer. Lacking these (any) could significantly impact bookings.
- Popular amenities like TV, Heating, Hot water are common but not universal. Offering these can provide a competitive edge.
Recommendations for Hosts
- Ensure your listing includes all essential amenities for Meta: Wifi, Air conditioning, Hair dryer.
- Prioritize adding missing essentials: Wifi, Air conditioning, Hair dryer.
- Consider adding popular differentiators like TV or Heating to increase appeal.
- Highlight unique or less common amenities you offer (e.g., hot tub, dedicated workspace, EV charger) in your listing description and photos.
- Regularly check competitor amenities in Meta to stay competitive.
Meta Airbnb Guest Demographics & Profile Analysis (2026)
Guest Profile Summary for Meta
- The typical guest profile for Airbnb in Meta consists of predominantly international visitors (97%), with top international origins including United Kingdom, typically belonging to the Post-2000s (Gen Z/Alpha) group (50%), primarily speaking English or Spanish.
- Domestic travelers account for 3.0% of guests.
- Key international markets include United States (20.5%) and United Kingdom (17.4%).
- Top languages spoken are English (46%) followed by Spanish (13.6%).
- A significant demographic segment is the Post-2000s (Gen Z/Alpha) group, representing 50% of guests.
Recommendations for Hosts
- Focus marketing internationally, particularly towards travelers from United Kingdom.
- Tailor amenities and listing descriptions to appeal to the dominant Post-2000s (Gen Z/Alpha) demographic (e.g., highlight fast WiFi, smart home features, local guides).
- Highlight unique local experiences or amenities relevant to the primary guest profile.
- Consider seasonal promotions aligned with peak travel times for key origin markets.
Nearby Short-Term Rental Market Comparison
How does the Meta Airbnb market stack up against its neighbors? Compare key performance metrics like average monthly revenue, ADR, and occupancy rates in surrounding areas to understand the broader regional STR landscape.
| Market | Active Properties | Monthly Revenue | Daily Rate | Avg. Occupancy |
|---|---|---|---|---|
| Positano | 740 | $6,727 | $653.26 | 52% |
| Praiano | 365 | $4,340 | $447.02 | 50% |
| Capri | 424 | $3,912 | $586.24 | 37% |
| Conca dei Marini | 132 | $3,899 | $417.87 | 45% |
| Sorrento | 1,606 | $3,821 | $344.29 | 48% |
| Massa Lubrense | 813 | $3,392 | $408.38 | 42% |
| Furore | 149 | $3,226 | $353.64 | 52% |
| Amalfi | 506 | $3,135 | $319.20 | 45% |
| Ravello | 256 | $3,119 | $333.17 | 42% |
| Atrani | 130 | $2,702 | $224.39 | 50% |