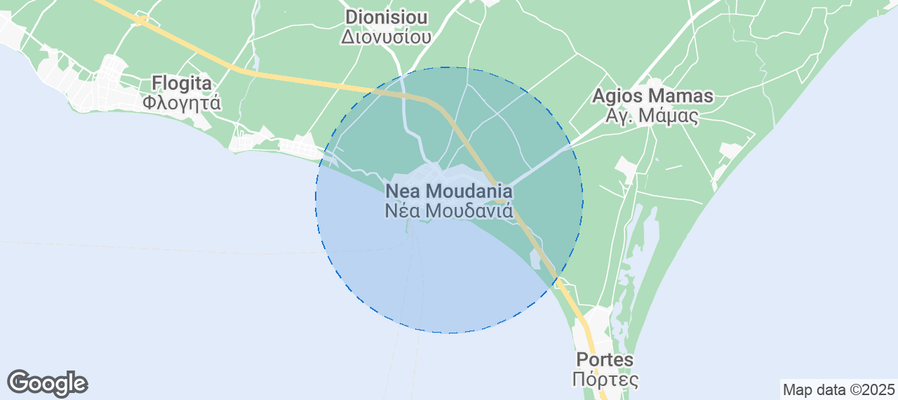
Nea Moudania Airbnb Market Analysis 2026: Short Term Rental Data & Vacation Rental Statistics in Macedonia and Thrace, Greece
Is Airbnb profitable in Nea Moudania in 2026? Explore comprehensive Airbnb analytics for Nea Moudania, Macedonia and Thrace, Greece to uncover income potential. This 2026 STR market report for Nea Moudania, based on AirROI data from February 2025 to January 2026, reveals key trends in the niche market of 66 active listings.
Whether you're considering an Airbnb investment in Nea Moudania, optimizing your existing vacation rental, or exploring rental arbitrage opportunities, understanding the Nea Moudania Airbnb data is crucial. Navigating the high regulation landscape is key to maximizing your short term rental income potential. Let's dive into the specifics.
Key Nea Moudania Airbnb Performance Metrics Overview
Monthly Airbnb Revenue Variations & Income Potential in Nea Moudania (2026)
Understanding the monthly revenue variations for Airbnb listings in Nea Moudania is key to maximizing your short term rental income potential. Seasonality significantly impacts earnings. Our analysis, based on data from the past 12 months, shows that the peak revenue month for STRs in Nea Moudania is typically July, while February often presents the lowest earnings, highlighting opportunities for strategic pricing adjustments during shoulder and low seasons. Explore the typical Airbnb income in Nea Moudania across different performance tiers:
- Best-in-class properties (Top 10%) achieve $5,211+ monthly, often utilizing dynamic pricing and superior guest experiences.
- Strong performing properties (Top 25%) earn $2,072 or more, indicating effective management and desirable locations/amenities.
- Typical properties (Median) generate around $1,021 per month, representing the average market performance.
- Entry-level properties (Bottom 25%) see earnings around $541, often with potential for optimization.
Average Monthly Airbnb Earnings Trend in Nea Moudania
Nea Moudania Airbnb Occupancy Rate Trends (2026)
Maximize your bookings by understanding the Nea Moudania STR occupancy trends. Seasonal demand shifts significantly influence how often properties are booked. Typically, Augustsees the highest demand (peak season occupancy), while February experiences the lowest (low season). Effective strategies, like adjusting minimum stays or offering promotions, can boost occupancy during slower periods. Here's how different property tiers perform in Nea Moudania:
- Best-in-class properties (Top 10%) achieve 55%+ occupancy, indicating high desirability and potentially optimized availability.
- Strong performing properties (Top 25%) maintain 39% or higher occupancy, suggesting good market fit and guest satisfaction.
- Typical properties (Median) have an occupancy rate around 26%.
- Entry-level properties (Bottom 25%) average 13% occupancy, potentially facing higher vacancy.
Average Monthly Occupancy Rate Trend in Nea Moudania
Average Daily Rate (ADR) Airbnb Trends in Nea Moudania (2026)
Effective short term rental pricing strategy in Nea Moudania involves understanding monthly ADR fluctuations. The Average Daily Rate (ADR) for Airbnb in Nea Moudania typically peaks in August and dips lowest during February. Leveraging Airbnb dynamic pricing tools or strategies based on this seasonality can significantly boost revenue. Here's a look at the typical nightly rates achieved:
- Best-in-class properties (Top 10%) command rates of $302+ per night, often due to premium features or locations.
- Strong performing properties (Top 25%) achieve nightly rates of $167 or more.
- Typical properties (Median) charge around $123 per night.
- Entry-level properties (Bottom 25%) earn around $95 per night.
Average Daily Rate (ADR) Trend by Month in Nea Moudania
Get Live Nea Moudania Market Intelligence 👇
Explore Real-time Analytics
Airbnb Seasonality Analysis & Trends in Nea Moudania (2026)
Peak Season (July, August, November)
- Revenue averages $3,170 per month
- Occupancy rates average 42.1%
- Daily rates average $184
Shoulder Season
- Revenue averages $1,928 per month
- Occupancy maintains around 25.2%
- Daily rates hold near $170
Low Season (February, March, April)
- Revenue drops to average $822 per month
- Occupancy decreases to average 20.1%
- Daily rates adjust to average $160
Seasonality Insights for Nea Moudania
- The Airbnb seasonality in Nea Moudania shows highly seasonal trends requiring careful strategy. While the sections above show seasonal averages, it's also insightful to look at the extremes:
- During the high season, the absolute peak month showcases Nea Moudania's highest earning potential, with monthly revenues capable of climbing to $3,600, occupancy reaching a high of 59.6%, and ADRs peaking at $201.
- Conversely, the slowest single month of the year, typically falling within the low season, marks the market's lowest point. In this month, revenue might dip to $278, occupancy could drop to 13.9%, and ADRs may adjust down to $158.
- Understanding both the seasonal averages and these monthly peaks and troughs in revenue, occupancy, and ADR is crucial for maximizing your Airbnb profit potential in Nea Moudania.
Seasonal Strategies for Maximizing Profit
- Peak Season: Maximize revenue through premium pricing and potentially longer minimum stays. Ensure high availability.
- Low Season: Offer competitive pricing, special promotions (e.g., extended stay discounts), and flexible cancellation policies. Target off-season travelers like remote workers or budget-conscious guests.
- Shoulder Seasons: Implement dynamic pricing that balances peak and low rates. Target weekend travelers or specific events. Offer slightly more flexible terms than peak season.
- Regularly analyze your own performance against these Nea Moudania seasonality benchmarks and adjust your pricing and availability strategy accordingly.
Best Areas for Airbnb Investment in Nea Moudania (2026)
Exploring the top neighborhoods for short-term rentals in Nea Moudania? This section highlights key areas, outlining why they are attractive for hosts and guests, along with notable local attractions. Consider these locations based on your target guest profile and investment strategy.
| Neighborhood / Area | Why Host Here? (Target Guests & Appeal) | Key Attractions & Landmarks |
|---|---|---|
| Nea Moudania Beach | Popular seaside destination known for its beautiful beach, relaxed ambiance, and family-friendly atmosphere. Ideal for tourists looking for a serene beach vacation with convenient access to local amenities. | Nea Moudania Beach, Beach bars and cafes, Local taverns, Sunsets at the beach, Nearby archaeological sites |
| Kassandra Peninsula | Famous for its stunning coastlines and vibrant nightlife, Kassandra Peninsula attracts a diverse crowd from families to party-goers. Perfect for hosting guests seeking variety in leisure and entertainment. | Sani Beach, Halkidiki nightlife, Water sports activities, Local wineries, Scenic villages |
| Halkidiki | Renowned for its three-pronged peninsula, this area is known for azure waters, lush landscapes, and luxury resorts. A prime spot for tourists seeking both relaxation and adventure. | Mount Athos, Scuba diving spots, Hiking trails, Traditional villages, Cultural festivals |
| Agios Nikolaos | Charming coastal village with picturesque views, known for its warm hospitality. A great area for guests seeking authentic Greek experiences and local cuisine. | Agios Nikolaos Port, Local markets, Cultural events, Beaches and coves, Traditional taverns |
| Vourvourou | A hidden gem famous for its turquoise waters and small islands. Popular with nature lovers and families looking for tranquil holidays in a stunning environment. | Blue Lagoon Beach, Agios Ioannis Beach, Boat rentals, Nature trails, Camping spots |
| Kallithea | A lively town known for its vibrant nightlife and beach clubs. Attracts younger crowds and those looking for an energetic beach getaway. | Kallithea Beach, Nightclubs and beach parties, Local dining options, Water activities, Shopping |
| Fourka | A more serene location known for its beautiful landscapes and quiet beaches. Attracts families and those seeking relaxation away from the crowds. | Fourka Beach, Nature walks, Local agricultural tours, Tranquil settings, Family-friendly activities |
| Siviri | Known for its relaxing beaches and scenic surroundings. A great destination for families and couples looking for a laid-back vacation. | Siviri Beach, Local nightlife, Outdoor activities, Cultural festivals, Beautiful forest trails |
Understanding Airbnb License Requirements & STR Laws in Nea Moudania (2026)
Yes, Nea Moudania, Macedonia and Thrace, Greece enforces high STR regulations. Obtaining a license and ensuring compliance is almost certainly required according to current 2026 STR laws. Always verify the latest short term rental regulations and Airbnb license requirements directly with local government authorities for Nea Moudania to ensure full compliance before hosting.
(Source: AirROI data, 2026, based on 86% licensed listings)
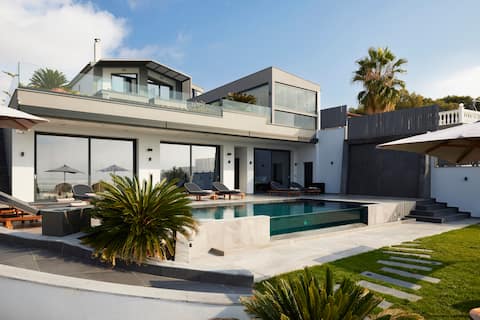
Top Performing Airbnb Properties in Nea Moudania (2026)
Benchmark your potential! Explore examples of top-performing Airbnb properties in Nea Moudaniabased on Trailing Twelve Month (TTM) revenue. Analyze their characteristics, revenue, occupancy rate, and ADR to understand what drives success in this market.
Villa OMNIA - Luxury Bound on Earth
Entire Place • 7 bedrooms

Elia Luxury Villa B3 by EliaMare
Entire Place • 3 bedrooms

Avocetta Villa Oros by Travel Pro - Nea Moudania
Entire Place • 2 bedrooms

Avocetta Villa Alos by Travel Pro - Nea Moudania
Entire Place • 2 bedrooms

Villa Nefeli
Entire Place • 4 bedrooms

Villa Amelia by Travel Pro - Mouries Halkidiki
Entire Place • 2 bedrooms
Note: Performance varies based on location, size, amenities, seasonality, and management quality. Data reflects the past 12 months.
Top Performing Airbnb Hosts in Nea Moudania (2026)
Learn from the best! This table showcases top-performing Airbnb hosts in Nea Moudania based on the number of properties managed and estimated total revenue over the past year. Analyze their scale and performance metrics.
| Host Name | Properties | Grossing Revenue | Stay Reviews | Avg Rating |
|---|---|---|---|---|
| Halkidiki TravelPro Services | 12 | $155,484 | 24 | 4.75/5.0 |
| Alexandros | 1 | $117,155 | 7 | 5.00/5.0 |
| Babis | 1 | $43,955 | 3 | 5.00/5.0 |
| Zoi | 2 | $31,185 | 3 | Not Rated |
| Diomedes | 1 | $28,905 | 9 | 4.22/5.0 |
| Booking | 2 | $24,032 | 10 | 5.00/5.0 |
| Ζωη | 1 | $18,863 | 27 | 4.48/5.0 |
| Konstantinos | 1 | $17,982 | 39 | 4.97/5.0 |
| Konstantinos | 2 | $16,589 | 120 | 4.96/5.0 |
| Halkidiki Hospitality | 1 | $15,887 | 13 | 4.85/5.0 |
Analyzing the strategies of top hosts, such as their property selection, pricing, and guest communication, can offer valuable lessons for optimizing your own Airbnb operations in Nea Moudania.
Dive Deeper: Advanced Nea Moudania STR Market Data (2026)
Ready to unlock more insights? AirROI provides access to advanced metrics and comprehensive Airbnb data for Nea Moudania. Explore detailed analytics beyond this report to refine your investment strategy, optimize pricing, and maximize your vacation rental profits.
Explore Advanced MetricsNea Moudania Short-Term Rental Market Composition (2026): Property & Room Types
Room Type Distribution
Property Type Distribution
Market Composition Insights for Nea Moudania
- The Nea Moudania Airbnb market composition is heavily skewed towards Entire Home/Apt listings, which make up 100% of the 66 active rentals. This indicates strong guest preference for privacy and space.
- Looking at the property type distribution in Nea Moudania, Apartment/Condo properties are the most common (69.7%), reflecting the local real estate landscape.
- Houses represent a significant 30.3% portion, catering likely to families or larger groups.
Nea Moudania Airbnb Room Capacity Analysis (2026): Bedroom Distribution
Distribution of Listings by Number of Bedrooms
Room Capacity Insights for Nea Moudania
- The dominant room capacity in Nea Moudania is 2 bedrooms listings, making up 42.4% of the market. This suggests a strong demand for properties suitable for couples or solo travelers.
- Together, 2 bedrooms and 1 bedroom properties represent 74.2% of the active Airbnb listings in Nea Moudania, indicating a high concentration in these sizes.
- A significant 24.2% of listings offer 3+ bedrooms, catering to larger groups and families seeking more space in Nea Moudania.
Nea Moudania Vacation Rental Guest Capacity Trends (2026)
Distribution of Listings by Guest Capacity
Guest Capacity Insights for Nea Moudania
- The most common guest capacity trend in Nea Moudania vacation rentals is listings accommodating 4 guests (24.2%). This suggests the primary traveler segment is likely small families or groups.
- Properties designed for 4 guests and 5 guests dominate the Nea Moudania STR market, accounting for 48.4% of listings.
- 33.3% of properties accommodate 6+ guests, serving the market segment for larger families or group travel in Nea Moudania.
- On average, properties in Nea Moudania are equipped to host 5.0 guests.
Nea Moudania Airbnb Booking Patterns (2026): Available vs. Booked Days
Available Days Distribution
Booked Days Distribution
Booking Pattern Insights for Nea Moudania
- The most common availability pattern in Nea Moudania falls within the 271-366 days range, representing 92.4% of listings. This suggests many properties have significant open periods on their calendars.
- Approximately 100.0% of listings show high availability (181+ days open annually), indicating potential for increased bookings or specific owner usage patterns.
- For booked days, the 31-90 days range is most frequent in Nea Moudania (59.1%), reflecting common guest stay durations or potential owner blocking patterns.
Nea Moudania Airbnb Minimum Stay Requirements Analysis
Distribution of Listings by Minimum Night Requirement
1 Night
1 listings
1.5% of total
2 Nights
7 listings
10.6% of total
3 Nights
9 listings
13.6% of total
4-6 Nights
22 listings
33.3% of total
7-29 Nights
3 listings
4.5% of total
30+ Nights
24 listings
36.4% of total
Key Insights
- The most prevalent minimum stay requirement in Nea Moudania is 30+ Nights, adopted by 36.4% of listings. This highlights the market's preference for longer commitments.
- Very short stays (1-2 nights) are less common (12.1%), suggesting hosts prefer slightly longer bookings to optimize turnover.
- A significant segment (36.4%) caters to monthly stays (30+ nights) in Nea Moudania, pointing to opportunities in the extended-stay market.
Recommendations
- Align with the market by considering a 30+ Nights minimum stay, as 36.4% of Nea Moudania hosts use this setting.
- If feasible, allowing 1-night stays, especially midweek or during low season, could capture last-minute bookings, as only 1.5% currently do.
- Explore offering discounts for stays of 30+ nights to attract the 36.4% of the market seeking extended stays.
- Adjust minimum nights based on seasonality – potentially shorter during low season and longer during peak demand periods in Nea Moudania.
Nea Moudania Airbnb Cancellation Policy Trends Analysis (2026)
Super Strict 30 Days
13 listings
19.7% of total
Flexible
6 listings
9.1% of total
Moderate
10 listings
15.2% of total
Firm
25 listings
37.9% of total
Strict
12 listings
18.2% of total
Cancellation Policy Insights for Nea Moudania
- The prevailing Airbnb cancellation policy trend in Nea Moudania is Firm, used by 37.9% of listings.
- A majority (56.1%) of hosts in Nea Moudania utilize Firm or Strict policies, indicating a market where hosts prioritize booking security.
Recommendations for Hosts
- Consider adopting a Firm policy to align with the 37.9% market standard in Nea Moudania.
- Regularly review your cancellation policy against competitors and market demand shifts in Nea Moudania.
Nea Moudania STR Booking Lead Time Analysis (2026)
Average Booking Lead Time by Month
Booking Lead Time Insights for Nea Moudania
- The overall average booking lead time for vacation rentals in Nea Moudania is 44 days.
- Guests book furthest in advance for stays during November (average 162 days), likely coinciding with peak travel demand or local events.
- The shortest booking windows occur for stays in February (average 9 days), indicating more last-minute travel plans during this time.
- Seasonally, Fall (84 days avg.) sees the longest lead times, while Winter (22 days avg.) has the shortest, reflecting typical travel planning cycles.
Recommendations for Hosts
- Use the overall average lead time (44 days) as a baseline for your pricing and availability strategy in Nea Moudania.
- For November stays, consider implementing length-of-stay discounts or slightly higher rates for bookings made less than 162 days out to capitalize on advance planning.
- During February, focus on last-minute booking availability and promotions, as guests book with very short notice (9 days avg.).
- Target marketing efforts for the Fall season well in advance (at least 84 days) to capture early planners.
- Monitor your own booking lead times against these Nea Moudania averages to identify opportunities for dynamic pricing adjustments.
Popular & Essential Airbnb Amenities in Nea Moudania (2026)
Amenity Prevalence
Amenity Insights for Nea Moudania
- Essential amenities in Nea Moudania that guests expect include: TV, Air conditioning, Wifi, Kitchen. Lacking these (any) could significantly impact bookings.
- Popular amenities like Hair dryer, Refrigerator, Cooking basics are common but not universal. Offering these can provide a competitive edge.
Recommendations for Hosts
- Ensure your listing includes all essential amenities for Nea Moudania: TV, Air conditioning, Wifi, Kitchen.
- Prioritize adding missing essentials: Kitchen.
- Consider adding popular differentiators like Hair dryer or Refrigerator to increase appeal.
- Highlight unique or less common amenities you offer (e.g., hot tub, dedicated workspace, EV charger) in your listing description and photos.
- Regularly check competitor amenities in Nea Moudania to stay competitive.
Nea Moudania Airbnb Guest Demographics & Profile Analysis (2026)
Guest Profile Summary for Nea Moudania
- The typical guest profile for Airbnb in Nea Moudania consists of predominantly international visitors (91%), with top international origins including Bulgaria, typically belonging to the Post-2000s (Gen Z/Alpha) group (50%), primarily speaking English or German.
- Domestic travelers account for 8.8% of guests.
- Key international markets include Germany (24.6%) and Bulgaria (10.5%).
- Top languages spoken are English (40.7%) followed by German (14%).
- A significant demographic segment is the Post-2000s (Gen Z/Alpha) group, representing 50% of guests.
Recommendations for Hosts
- Focus marketing internationally, particularly towards travelers from Bulgaria.
- Tailor amenities and listing descriptions to appeal to the dominant Post-2000s (Gen Z/Alpha) demographic (e.g., highlight fast WiFi, smart home features, local guides).
- Highlight unique local experiences or amenities relevant to the primary guest profile.
- Consider seasonal promotions aligned with peak travel times for key origin markets.
Nearby Short-Term Rental Market Comparison
How does the Nea Moudania Airbnb market stack up against its neighbors? Compare key performance metrics like average monthly revenue, ADR, and occupancy rates in surrounding areas to understand the broader regional STR landscape.
| Market | Active Properties | Monthly Revenue | Daily Rate | Avg. Occupancy |
|---|---|---|---|---|
| Skiathos Municipality | 68 | $2,488 | $456.24 | 48% |
| Achladias | 92 | $2,443 | $360.50 | 47% |
| Sporades | 22 | $2,433 | $326.24 | 53% |
| Klima | 20 | $2,023 | $348.92 | 40% |
| Panorama Municipal Unit | 11 | $1,735 | $285.42 | 36% |
| Kalyvia | 23 | $1,642 | $248.74 | 42% |
| Mourtero | 16 | $1,623 | $226.09 | 46% |
| Thermaikos Municipality | 23 | $1,600 | $193.25 | 45% |
| Myli | 52 | $1,580 | $228.03 | 44% |
| Νέα Μουδανιά | 18 | $1,572 | $193.08 | 46% |