Mülheim an der Ruhr Airbnb Market Analysis 2026: Short Term Rental Data & Vacation Rental Statistics in North Rhine-Westphalia, Germany
Is Airbnb profitable in Mülheim an der Ruhr in 2026? Explore comprehensive Airbnb analytics for Mülheim an der Ruhr, North Rhine-Westphalia, Germany to uncover income potential. This 2026 STR market report for Mülheim an der Ruhr, based on AirROI data from February 2025 to January 2026, reveals key trends in the niche market of 151 active listings.
Whether you're considering an Airbnb investment in Mülheim an der Ruhr, optimizing your existing vacation rental, or exploring rental arbitrage opportunities, understanding the Mülheim an der Ruhr Airbnb data is crucial. Leveraging the low regulation environment is key to maximizing your short term rental income potential. Let's dive into the specifics.
Key Mülheim an der Ruhr Airbnb Performance Metrics Overview
Monthly Airbnb Revenue Variations & Income Potential in Mülheim an der Ruhr (2026)
Understanding the monthly revenue variations for Airbnb listings in Mülheim an der Ruhr is key to maximizing your short term rental income potential. Seasonality significantly impacts earnings. Our analysis, based on data from the past 12 months, shows that the peak revenue month for STRs in Mülheim an der Ruhr is typically October, while January often presents the lowest earnings, highlighting opportunities for strategic pricing adjustments during shoulder and low seasons. Explore the typical Airbnb income in Mülheim an der Ruhr across different performance tiers:
- Best-in-class properties (Top 10%) achieve $2,124+ monthly, often utilizing dynamic pricing and superior guest experiences.
- Strong performing properties (Top 25%) earn $1,529 or more, indicating effective management and desirable locations/amenities.
- Typical properties (Median) generate around $978 per month, representing the average market performance.
- Entry-level properties (Bottom 25%) see earnings around $490, often with potential for optimization.
Average Monthly Airbnb Earnings Trend in Mülheim an der Ruhr
Mülheim an der Ruhr Airbnb Occupancy Rate Trends (2026)
Maximize your bookings by understanding the Mülheim an der Ruhr STR occupancy trends. Seasonal demand shifts significantly influence how often properties are booked. Typically, Octobersees the highest demand (peak season occupancy), while January experiences the lowest (low season). Effective strategies, like adjusting minimum stays or offering promotions, can boost occupancy during slower periods. Here's how different property tiers perform in Mülheim an der Ruhr:
- Best-in-class properties (Top 10%) achieve 80%+ occupancy, indicating high desirability and potentially optimized availability.
- Strong performing properties (Top 25%) maintain 60% or higher occupancy, suggesting good market fit and guest satisfaction.
- Typical properties (Median) have an occupancy rate around 36%.
- Entry-level properties (Bottom 25%) average 19% occupancy, potentially facing higher vacancy.
Average Monthly Occupancy Rate Trend in Mülheim an der Ruhr
Average Daily Rate (ADR) Airbnb Trends in Mülheim an der Ruhr (2026)
Effective short term rental pricing strategy in Mülheim an der Ruhr involves understanding monthly ADR fluctuations. The Average Daily Rate (ADR) for Airbnb in Mülheim an der Ruhr typically peaks in October and dips lowest during March. Leveraging Airbnb dynamic pricing tools or strategies based on this seasonality can significantly boost revenue. Here's a look at the typical nightly rates achieved:
- Best-in-class properties (Top 10%) command rates of $150+ per night, often due to premium features or locations.
- Strong performing properties (Top 25%) achieve nightly rates of $114 or more.
- Typical properties (Median) charge around $86 per night.
- Entry-level properties (Bottom 25%) earn around $63 per night.
Average Daily Rate (ADR) Trend by Month in Mülheim an der Ruhr
Get Live Mülheim an der Ruhr Market Intelligence 👇

Explore Real-time Analytics
Airbnb Seasonality Analysis & Trends in Mülheim an der Ruhr (2026)
Peak Season (October, September, July)
- Revenue averages $1,434 per month
- Occupancy rates average 44.6%
- Daily rates average $107
Shoulder Season
- Revenue averages $1,118 per month
- Occupancy maintains around 40.2%
- Daily rates hold near $97
Low Season (January, February, May)
- Revenue drops to average $950 per month
- Occupancy decreases to average 37.1%
- Daily rates adjust to average $94
Seasonality Insights for Mülheim an der Ruhr
- The Airbnb seasonality in Mülheim an der Ruhr shows highly seasonal trends requiring careful strategy. While the sections above show seasonal averages, it's also insightful to look at the extremes:
- During the high season, the absolute peak month showcases Mülheim an der Ruhr's highest earning potential, with monthly revenues capable of climbing to $1,757, occupancy reaching a high of 47.2%, and ADRs peaking at $113.
- Conversely, the slowest single month of the year, typically falling within the low season, marks the market's lowest point. In this month, revenue might dip to $871, occupancy could drop to 30.2%, and ADRs may adjust down to $87.
- Understanding both the seasonal averages and these monthly peaks and troughs in revenue, occupancy, and ADR is crucial for maximizing your Airbnb profit potential in Mülheim an der Ruhr.
Seasonal Strategies for Maximizing Profit
- Peak Season: Maximize revenue through premium pricing and potentially longer minimum stays. Ensure high availability.
- Low Season: Offer competitive pricing, special promotions (e.g., extended stay discounts), and flexible cancellation policies. Target off-season travelers like remote workers or budget-conscious guests.
- Shoulder Seasons: Implement dynamic pricing that balances peak and low rates. Target weekend travelers or specific events. Offer slightly more flexible terms than peak season.
- Regularly analyze your own performance against these Mülheim an der Ruhr seasonality benchmarks and adjust your pricing and availability strategy accordingly.
Best Areas for Airbnb Investment in Mülheim an der Ruhr (2026)
Exploring the top neighborhoods for short-term rentals in Mülheim an der Ruhr? This section highlights key areas, outlining why they are attractive for hosts and guests, along with notable local attractions. Consider these locations based on your target guest profile and investment strategy.
| Neighborhood / Area | Why Host Here? (Target Guests & Appeal) | Key Attractions & Landmarks |
|---|---|---|
| Stadtmitte | The city center of Mülheim offers a vibrant atmosphere with shops, restaurants, and cultural attractions. Ideal for tourists looking for convenience and access to facilities. | Mülheim Town Hall, Mülheim Castle, Forum City Mülheim, Rhein-Ruhr-Zentrum, Mülheim an der Ruhr Botanical Garden |
| Saarn | A picturesque district known for its historical buildings and proximity to nature. Great for guests seeking a quieter stay with scenic surroundings. | Schloss Broich, Schlosspark, Saarn's old town, Mülheimer Stadtpark, Ruhr River paths |
| Dümpten | Residential area that offers a mix of local charm and accessibility to neighboring cities, attractive for families or long-term stays. | Mülheim Golf Club, Mülheim's local markets, Nearby parks, Local eateries and cafes |
| Menden | A growing neighborhood with excellent family-friendly amenities and parks. Ideal for visitors looking for a suburban retreat. | Berthold Brecht Park, Local playgrounds, Dümptener Weiher, Community festivals |
| Broich | Broich is known for its historical significance and tranquil environment. Great for history enthusiasts and those looking to relax. | Museum zur Vorgeschichte, Ruins of Broich Castle, Historic town center, Local art installations |
| Eppinghofen | This area combines residential comfort with access to local shops and parks, suitable for visitors wanting a homely experience. | Nearby nature trails, Community events, Local dining options, Parks |
| Heissen | A scenic and quiet neighborhood, Heissen is perfect for guests seeking a peaceful retreat away from the hustle and bustle of the city. | Heissener Strasse with local shops, Parks and green spaces, Scenic views of the Ruhr, Historical sites |
| Windows of Mülheim | A unique outdoor space with art installations that attracts visitors. Ideal for tourists interested in modern culture and art. | Art installations, Outdoor events, Street food markets, Cultural festivals |
Understanding Airbnb License Requirements & STR Laws in Mülheim an der Ruhr (2026)
While Mülheim an der Ruhr, North Rhine-Westphalia, Germany currently shows low STR regulations, specific Airbnb license requirements might still exist or change. Always verify the latest short term rental regulations and Airbnb license requirements directly with local government authorities for Mülheim an der Ruhr to ensure full compliance before hosting.
(Source: AirROI data, 2026, based on 1% licensed listings)
Top Performing Airbnb Properties in Mülheim an der Ruhr (2026)
Benchmark your potential! Explore examples of top-performing Airbnb properties in Mülheim an der Ruhrbased on Trailing Twelve Month (TTM) revenue. Analyze their characteristics, revenue, occupancy rate, and ADR to understand what drives success in this market.

Penthouse*Luxus*Sauna*Nesspresso
Entire Place • 3 bedrooms

T&K Apartments-Mühlheim a.d.R-3 Rooms Apt-1OG
Entire Place • 3 bedrooms
T&K Apartments-Mühlheim a.d.R-3 Rooms Apt-3OG
Entire Place • 3 bedrooms
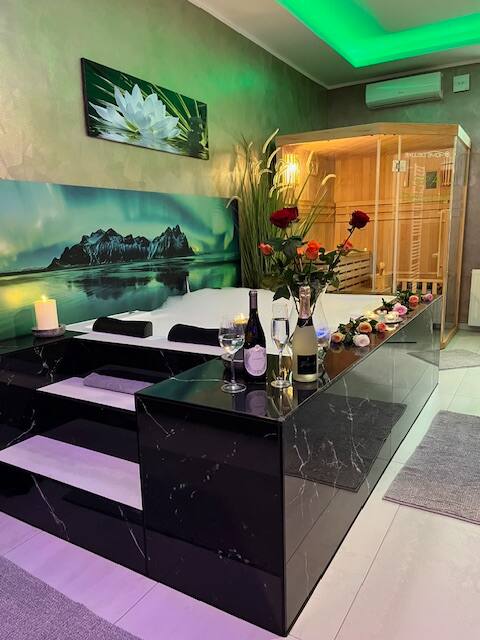
Spa Delluxe
Entire Place • 1 bedroom

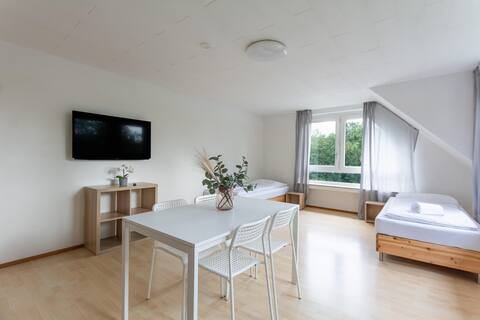
3-room apartment, 6-7 people, balcony, parking
Entire Place • 3 bedrooms

Charming and newly renovated penthouse
Entire Place • 1 bedroom
Note: Performance varies based on location, size, amenities, seasonality, and management quality. Data reflects the past 12 months.
Top Performing Airbnb Hosts in Mülheim an der Ruhr (2026)
Learn from the best! This table showcases top-performing Airbnb hosts in Mülheim an der Ruhr based on the number of properties managed and estimated total revenue over the past year. Analyze their scale and performance metrics.
| Host Name | Properties | Grossing Revenue | Stay Reviews | Avg Rating |
|---|---|---|---|---|
| Eugen | 11 | $97,888 | 119 | 4.59/5.0 |
| Ivan | 2 | $72,871 | 41 | 4.26/5.0 |
| Axel | 6 | $55,305 | 438 | 4.82/5.0 |
| Irene | 2 | $41,681 | 71 | 4.99/5.0 |
| Manfred Und Markus | 1 | $39,794 | 9 | 4.00/5.0 |
| Edin | 3 | $35,777 | 47 | 4.50/5.0 |
| Nicolai | 3 | $35,380 | 78 | 4.33/5.0 |
| Dietmar | 2 | $34,701 | 293 | 4.91/5.0 |
| Lars | 3 | $34,528 | 132 | 4.57/5.0 |
| Katrin | 3 | $32,259 | 548 | 4.91/5.0 |
Analyzing the strategies of top hosts, such as their property selection, pricing, and guest communication, can offer valuable lessons for optimizing your own Airbnb operations in Mülheim an der Ruhr.
Dive Deeper: Advanced Mülheim an der Ruhr STR Market Data (2026)
Ready to unlock more insights? AirROI provides access to advanced metrics and comprehensive Airbnb data for Mülheim an der Ruhr. Explore detailed analytics beyond this report to refine your investment strategy, optimize pricing, and maximize your vacation rental profits.
Explore Advanced MetricsMülheim an der Ruhr Short-Term Rental Market Composition (2026): Property & Room Types
Room Type Distribution
Property Type Distribution
Market Composition Insights for Mülheim an der Ruhr
- The Mülheim an der Ruhr Airbnb market composition is heavily skewed towards Entire Home/Apt listings, which make up 92.7% of the 151 active rentals. This indicates strong guest preference for privacy and space.
- Looking at the property type distribution in Mülheim an der Ruhr, Apartment/Condo properties are the most common (92.1%), reflecting the local real estate landscape.
- Smaller segments like house, hotel/boutique, others (combined 7.9%) offer potential for unique stay experiences.
Mülheim an der Ruhr Airbnb Room Capacity Analysis (2026): Bedroom Distribution
Distribution of Listings by Number of Bedrooms
Room Capacity Insights for Mülheim an der Ruhr
- The dominant room capacity in Mülheim an der Ruhr is 1 bedroom listings, making up 55.6% of the market. This suggests a strong demand for properties suitable for couples or solo travelers.
- Together, 1 bedroom and 2 bedrooms properties represent 76.8% of the active Airbnb listings in Mülheim an der Ruhr, indicating a high concentration in these sizes.
- With over half the market (55.6%) consisting of studios or 1-bedroom units, Mülheim an der Ruhr is particularly well-suited for individuals or couples.
- Listings with 3+ bedrooms (8.6%) represent a smaller niche, potentially indicating an underserved market for larger group accommodations in Mülheim an der Ruhr.
Mülheim an der Ruhr Vacation Rental Guest Capacity Trends (2026)
Distribution of Listings by Guest Capacity
Guest Capacity Insights for Mülheim an der Ruhr
- The most common guest capacity trend in Mülheim an der Ruhr vacation rentals is listings accommodating 2 guests (41.1%). This suggests the primary traveler segment is likely couples or solo travelers.
- Properties designed for 2 guests and 4 guests dominate the Mülheim an der Ruhr STR market, accounting for 65.6% of listings.
- A significant 45.1% of listings cater specifically to 1-2 guests, highlighting strong demand from couples and solo travelers in Mülheim an der Ruhr.
- On average, properties in Mülheim an der Ruhr are equipped to host 3.0 guests.
Mülheim an der Ruhr Airbnb Booking Patterns (2026): Available vs. Booked Days
Available Days Distribution
Booked Days Distribution
Booking Pattern Insights for Mülheim an der Ruhr
- The most common availability pattern in Mülheim an der Ruhr falls within the 271-366 days range, representing 48.3% of listings. This suggests many properties have significant open periods on their calendars.
- Approximately 82.7% of listings show high availability (181+ days open annually), indicating potential for increased bookings or specific owner usage patterns.
- For booked days, the 91-180 days range is most frequent in Mülheim an der Ruhr (34.4%), reflecting common guest stay durations or potential owner blocking patterns.
- A notable 18.6% of properties secure long booking periods (181+ days booked per year), highlighting successful long-term rental strategies or significant owner usage.
Mülheim an der Ruhr Airbnb Minimum Stay Requirements Analysis
Distribution of Listings by Minimum Night Requirement
1 Night
39 listings
25.8% of total
2 Nights
32 listings
21.2% of total
3 Nights
18 listings
11.9% of total
4-6 Nights
12 listings
7.9% of total
7-29 Nights
14 listings
9.3% of total
30+ Nights
36 listings
23.8% of total
Key Insights
- The most prevalent minimum stay requirement in Mülheim an der Ruhr is 1 Night, adopted by 25.8% of listings. This highlights the market's preference for shorter, flexible bookings.
- A significant segment (23.8%) caters to monthly stays (30+ nights) in Mülheim an der Ruhr, pointing to opportunities in the extended-stay market.
Recommendations
- Align with the market by considering a 1 Night minimum stay, as 25.8% of Mülheim an der Ruhr hosts use this setting.
- If feasible, allowing 1-night stays, especially midweek or during low season, could capture last-minute bookings, as only 25.8% currently do.
- Explore offering discounts for stays of 30+ nights to attract the 23.8% of the market seeking extended stays.
- Adjust minimum nights based on seasonality – potentially shorter during low season and longer during peak demand periods in Mülheim an der Ruhr.
Mülheim an der Ruhr Airbnb Cancellation Policy Trends Analysis (2026)
Refundable
1 listings
0.7% of total
Super Strict 60 Days
2 listings
1.3% of total
Non-refundable
1 listings
0.7% of total
Flexible
67 listings
44.7% of total
Moderate
42 listings
28% of total
Firm
34 listings
22.7% of total
Strict
3 listings
2% of total
Cancellation Policy Insights for Mülheim an der Ruhr
- The prevailing Airbnb cancellation policy trend in Mülheim an der Ruhr is Flexible, used by 44.7% of listings.
- The market strongly favors guest-friendly terms, with 72.7% of listings offering Flexible or Moderate policies. This suggests guests in Mülheim an der Ruhr may expect booking flexibility.
- Strict cancellation policies are quite rare (2%), potentially making listings with this policy less competitive unless justified by high demand or property type.
Recommendations for Hosts
- Consider adopting a Flexible policy to align with the 44.7% market standard in Mülheim an der Ruhr.
- Using a Strict policy might deter some guests, as only 2% of listings use it. Evaluate if potential revenue protection outweighs possible lower booking rates.
- Regularly review your cancellation policy against competitors and market demand shifts in Mülheim an der Ruhr.
Mülheim an der Ruhr STR Booking Lead Time Analysis (2026)
Average Booking Lead Time by Month
Booking Lead Time Insights for Mülheim an der Ruhr
- The overall average booking lead time for vacation rentals in Mülheim an der Ruhr is 55 days.
- Guests book furthest in advance for stays during October (average 110 days), likely coinciding with peak travel demand or local events.
- The shortest booking windows occur for stays in March (average 25 days), indicating more last-minute travel plans during this time.
- Seasonally, Fall (70 days avg.) sees the longest lead times, while Winter (32 days avg.) has the shortest, reflecting typical travel planning cycles.
Recommendations for Hosts
- Use the overall average lead time (55 days) as a baseline for your pricing and availability strategy in Mülheim an der Ruhr.
- For October stays, consider implementing length-of-stay discounts or slightly higher rates for bookings made less than 110 days out to capitalize on advance planning.
- Target marketing efforts for the Fall season well in advance (at least 70 days) to capture early planners.
- Monitor your own booking lead times against these Mülheim an der Ruhr averages to identify opportunities for dynamic pricing adjustments.
Popular & Essential Airbnb Amenities in Mülheim an der Ruhr (2026)
Amenity Prevalence
Amenity Insights for Mülheim an der Ruhr
- Essential amenities in Mülheim an der Ruhr that guests expect include: TV, Wifi. Lacking these (any) could significantly impact bookings.
- Popular amenities like Kitchen, Heating, Smoke alarm are common but not universal. Offering these can provide a competitive edge.
Recommendations for Hosts
- Ensure your listing includes all essential amenities for Mülheim an der Ruhr: TV, Wifi.
- Prioritize adding missing essentials: TV, Wifi.
- Consider adding popular differentiators like Kitchen or Heating to increase appeal.
- Highlight unique or less common amenities you offer (e.g., hot tub, dedicated workspace, EV charger) in your listing description and photos.
- Regularly check competitor amenities in Mülheim an der Ruhr to stay competitive.
Mülheim an der Ruhr Airbnb Guest Demographics & Profile Analysis (2026)
Guest Profile Summary for Mülheim an der Ruhr
- The typical guest profile for Airbnb in Mülheim an der Ruhr consists of a mix of domestic (61%) and international guests, often arriving from nearby Berlin, typically belonging to the Post-2000s (Gen Z/Alpha) group (50%), primarily speaking English or German.
- Domestic travelers account for 60.5% of guests.
- Key international markets include Germany (60.5%) and France (7.6%).
- Top languages spoken are English (38.7%) followed by German (31.2%).
- A significant demographic segment is the Post-2000s (Gen Z/Alpha) group, representing 50% of guests.
Recommendations for Hosts
- Target domestic marketing efforts towards travelers from Berlin and Hamburg.
- Tailor amenities and listing descriptions to appeal to the dominant Post-2000s (Gen Z/Alpha) demographic (e.g., highlight fast WiFi, smart home features, local guides).
- Highlight unique local experiences or amenities relevant to the primary guest profile.
- Consider seasonal promotions aligned with peak travel times for key origin markets.
Nearby Short-Term Rental Market Comparison
How does the Mülheim an der Ruhr Airbnb market stack up against its neighbors? Compare key performance metrics like average monthly revenue, ADR, and occupancy rates in surrounding areas to understand the broader regional STR landscape.
| Market | Active Properties | Monthly Revenue | Daily Rate | Avg. Occupancy |
|---|---|---|---|---|
| Losser | 10 | $7,954 | $1060.34 | 27% |
| Haghorst | 11 | $5,995 | $480.40 | 40% |
| Baarlo | 20 | $5,442 | $332.61 | 51% |
| Wellin | 12 | $4,365 | $446.64 | 42% |
| Aubel | 26 | $4,191 | $283.88 | 46% |
| Bertogne | 26 | $3,839 | $325.90 | 42% |
| Kortenhoef | 14 | $3,655 | $255.24 | 55% |
| Samrée | 18 | $3,497 | $375.75 | 31% |
| Zeewolde | 157 | $3,494 | $351.76 | 37% |
| Heers | 30 | $3,405 | $294.43 | 39% |