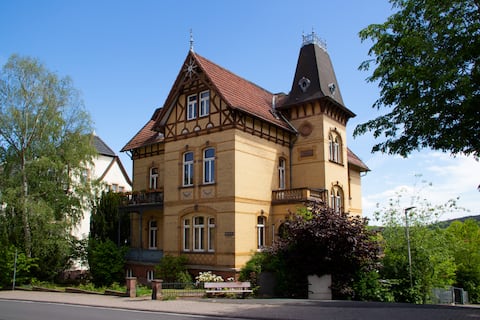
Bad Wildungen Airbnb Market Analysis 2026: Short Term Rental Data & Vacation Rental Statistics in Hesse, Germany
Is Airbnb profitable in Bad Wildungen in 2026? Explore comprehensive Airbnb analytics for Bad Wildungen, Hesse, Germany to uncover income potential. This 2026 STR market report for Bad Wildungen, based on AirROI data from February 2025 to January 2026, reveals key trends in the niche market of 23 active listings.
Whether you're considering an Airbnb investment in Bad Wildungen, optimizing your existing vacation rental, or exploring rental arbitrage opportunities, understanding the Bad Wildungen Airbnb data is crucial. Leveraging the low regulation environment is key to maximizing your short term rental income potential. Let's dive into the specifics.
Key Bad Wildungen Airbnb Performance Metrics Overview
Monthly Airbnb Revenue Variations & Income Potential in Bad Wildungen (2026)
Understanding the monthly revenue variations for Airbnb listings in Bad Wildungen is key to maximizing your short term rental income potential. Seasonality significantly impacts earnings. Our analysis, based on data from the past 12 months, shows that the peak revenue month for STRs in Bad Wildungen is typically August, while February often presents the lowest earnings, highlighting opportunities for strategic pricing adjustments during shoulder and low seasons. Explore the typical Airbnb income in Bad Wildungen across different performance tiers:
- Best-in-class properties (Top 10%) achieve $2,312+ monthly, often utilizing dynamic pricing and superior guest experiences.
- Strong performing properties (Top 25%) earn $1,790 or more, indicating effective management and desirable locations/amenities.
- Typical properties (Median) generate around $1,190 per month, representing the average market performance.
- Entry-level properties (Bottom 25%) see earnings around $571, often with potential for optimization.
Average Monthly Airbnb Earnings Trend in Bad Wildungen
Bad Wildungen Airbnb Occupancy Rate Trends (2026)
Maximize your bookings by understanding the Bad Wildungen STR occupancy trends. Seasonal demand shifts significantly influence how often properties are booked. Typically, Augustsees the highest demand (peak season occupancy), while January experiences the lowest (low season). Effective strategies, like adjusting minimum stays or offering promotions, can boost occupancy during slower periods. Here's how different property tiers perform in Bad Wildungen:
- Best-in-class properties (Top 10%) achieve 82%+ occupancy, indicating high desirability and potentially optimized availability.
- Strong performing properties (Top 25%) maintain 64% or higher occupancy, suggesting good market fit and guest satisfaction.
- Typical properties (Median) have an occupancy rate around 37%.
- Entry-level properties (Bottom 25%) average 18% occupancy, potentially facing higher vacancy.
Average Monthly Occupancy Rate Trend in Bad Wildungen
Average Daily Rate (ADR) Airbnb Trends in Bad Wildungen (2026)
Effective short term rental pricing strategy in Bad Wildungen involves understanding monthly ADR fluctuations. The Average Daily Rate (ADR) for Airbnb in Bad Wildungen typically peaks in October and dips lowest during March. Leveraging Airbnb dynamic pricing tools or strategies based on this seasonality can significantly boost revenue. Here's a look at the typical nightly rates achieved:
- Best-in-class properties (Top 10%) command rates of $210+ per night, often due to premium features or locations.
- Strong performing properties (Top 25%) achieve nightly rates of $130 or more.
- Typical properties (Median) charge around $84 per night.
- Entry-level properties (Bottom 25%) earn around $69 per night.
Average Daily Rate (ADR) Trend by Month in Bad Wildungen
Get Live Bad Wildungen Market Intelligence 👇

Explore Real-time Analytics
Airbnb Seasonality Analysis & Trends in Bad Wildungen (2026)
Peak Season (August, July, May)
- Revenue averages $1,706 per month
- Occupancy rates average 50.1%
- Daily rates average $109
Shoulder Season
- Revenue averages $1,332 per month
- Occupancy maintains around 43.9%
- Daily rates hold near $112
Low Season (January, February, March)
- Revenue drops to average $834 per month
- Occupancy decreases to average 32.0%
- Daily rates adjust to average $101
Seasonality Insights for Bad Wildungen
- The Airbnb seasonality in Bad Wildungen shows highly seasonal trends requiring careful strategy. While the sections above show seasonal averages, it's also insightful to look at the extremes:
- During the high season, the absolute peak month showcases Bad Wildungen's highest earning potential, with monthly revenues capable of climbing to $1,828, occupancy reaching a high of 55.7%, and ADRs peaking at $117.
- Conversely, the slowest single month of the year, typically falling within the low season, marks the market's lowest point. In this month, revenue might dip to $724, occupancy could drop to 30.5%, and ADRs may adjust down to $95.
- Understanding both the seasonal averages and these monthly peaks and troughs in revenue, occupancy, and ADR is crucial for maximizing your Airbnb profit potential in Bad Wildungen.
Seasonal Strategies for Maximizing Profit
- Peak Season: Maximize revenue through premium pricing and potentially longer minimum stays. Ensure high availability.
- Low Season: Offer competitive pricing, special promotions (e.g., extended stay discounts), and flexible cancellation policies. Target off-season travelers like remote workers or budget-conscious guests.
- Shoulder Seasons: Implement dynamic pricing that balances peak and low rates. Target weekend travelers or specific events. Offer slightly more flexible terms than peak season.
- Regularly analyze your own performance against these Bad Wildungen seasonality benchmarks and adjust your pricing and availability strategy accordingly.
Best Areas for Airbnb Investment in Bad Wildungen (2026)
Exploring the top neighborhoods for short-term rentals in Bad Wildungen? This section highlights key areas, outlining why they are attractive for hosts and guests, along with notable local attractions. Consider these locations based on your target guest profile and investment strategy.
| Neighborhood / Area | Why Host Here? (Target Guests & Appeal) | Key Attractions & Landmarks |
|---|---|---|
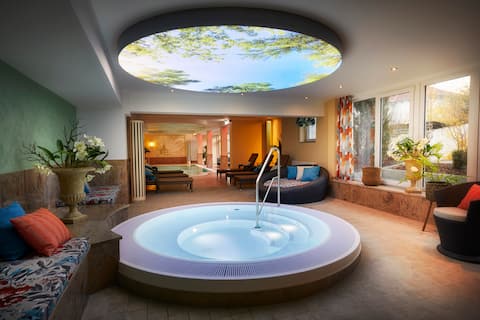
| Therme Bad Wildungen | Popular spa resort known for its thermal baths and wellness centers. Ideal for guests seeking relaxation and rejuvenation in a serene environment. | Therme Bad Wildungen, Kurpark, Heilklimatischer Kurort, Wilde Berg, Schlosspark |
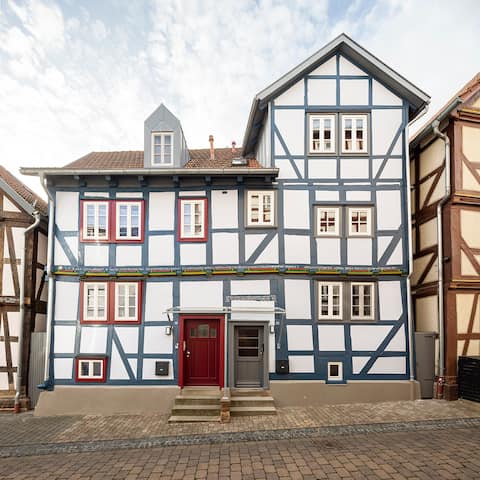
| Old Town (Altstadt) | Charming historic district featuring traditional architecture, local shops, and cafes. A great location for tourists wanting to experience the culture and history of Bad Wildungen. | St. Nikolaus Church, Historic buildings, Local markets, Cafes and restaurants, Old Town Square |
| Kellerwald-Edersee National Park | Natural park offering outdoor activities such as hiking, cycling, and water sports. Attracts nature lovers and adventure seekers looking for a peaceful retreat. | Edersee Lake, Hiking trails, Wildlife watching, Cycling routes, Scenic viewpoints |
| Schloßgarten | A beautiful garden area surrounding the castle, providing an engaging experience for visitors. Perfect for families and couples looking for picturesque scenery. | Wildungen Castle, Schloßgarten Park, Picnic areas, Walking paths, Historical exhibitions |
| Wellness Hotels District | District with various wellness hotels and spa options, catering to guests focused on health and relaxation, ideal for extended stays. | Multiple wellness hotels, Spa services, Health retreats, Relaxation programs, Nature walks |
| Edersee-Seenplatte | Catchment area around Edersee, known for its recreational boating, hiking, and nature activities, attractive to tourists during summer. | Boating activities, Hiking trails around the lake, Fishing spots, Picnic areas, Scenic bicycle paths |
| Café and Restaurant District | Area lined with popular cafes and restaurants, appealing to foodies and visitors wanting to taste local cuisine, enhancing the stay experience. | Local cuisine restaurants, Cafes, Seasonal markets, Food festivals, Plenary events |
| Winter Sports Area | Region for winter sports enthusiasts, such as skiing and snowboarding during the colder months, bringing in seasonal visitors looking for winter fun. | Ski resorts, Snowboarding areas, Winter hiking trails, Local winter events, Fun winter activities |
Understanding Airbnb License Requirements & STR Laws in Bad Wildungen (2026)
While Bad Wildungen, Hesse, Germany currently shows low STR regulations, specific Airbnb license requirements might still exist or change. Always verify the latest short term rental regulations and Airbnb license requirements directly with local government authorities for Bad Wildungen to ensure full compliance before hosting.
(Source: AirROI data, 2026, finding no licensed listings among those analyzed)
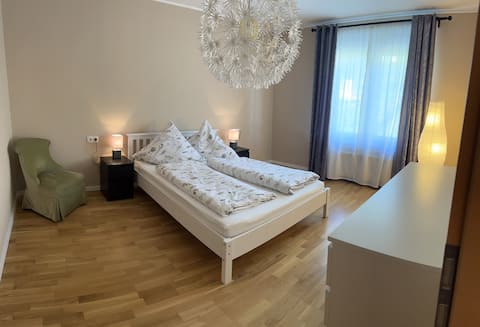
Top Performing Airbnb Properties in Bad Wildungen (2026)
Benchmark your potential! Explore examples of top-performing Airbnb properties in Bad Wildungenbased on Trailing Twelve Month (TTM) revenue. Analyze their characteristics, revenue, occupancy rate, and ADR to understand what drives success in this market.
Central apartment with spa area use
Entire Place • 2 bedrooms
Vacation home Altstadtflair Bad Wildungen up to 8 people.
Entire Place • 4 bedrooms
New apartment in a quiet central location
Entire Place • 1 bedroom
Downtown*Netflix*Parking space
Entire Place • 1 bedroom
Hufelandstern apartment: 7 people, electric charging station
Entire Place • 2 bedrooms
FeWo "Hohenstein" Bad Wildungen
Entire Place • 2 bedrooms
Note: Performance varies based on location, size, amenities, seasonality, and management quality. Data reflects the past 12 months.
Top Performing Airbnb Hosts in Bad Wildungen (2026)
Learn from the best! This table showcases top-performing Airbnb hosts in Bad Wildungen based on the number of properties managed and estimated total revenue over the past year. Analyze their scale and performance metrics.
| Host Name | Properties | Grossing Revenue | Stay Reviews | Avg Rating |
|---|---|---|---|---|
| Hans-Werner | 3 | $47,361 | 52 | 4.90/5.0 |
| Paul | 2 | $40,725 | 30 | 4.91/5.0 |
| Simon | 2 | $28,691 | 49 | 4.94/5.0 |
| Lisa | 1 | $26,843 | 149 | 4.91/5.0 |
| Johann | 3 | $24,798 | 25 | 4.86/5.0 |
| Kerstin | 1 | $18,564 | 46 | 4.89/5.0 |
| Manfred | 1 | $17,797 | 39 | 4.87/5.0 |
| Christa | 1 | $13,912 | 131 | 4.91/5.0 |
| Matthias | 1 | $11,048 | 22 | 4.91/5.0 |
| Daniela | 1 | $8,306 | 25 | 4.72/5.0 |
Analyzing the strategies of top hosts, such as their property selection, pricing, and guest communication, can offer valuable lessons for optimizing your own Airbnb operations in Bad Wildungen.
Dive Deeper: Advanced Bad Wildungen STR Market Data (2026)
Ready to unlock more insights? AirROI provides access to advanced metrics and comprehensive Airbnb data for Bad Wildungen. Explore detailed analytics beyond this report to refine your investment strategy, optimize pricing, and maximize your vacation rental profits.
Explore Advanced MetricsBad Wildungen Short-Term Rental Market Composition (2026): Property & Room Types
Room Type Distribution
Property Type Distribution
Market Composition Insights for Bad Wildungen
- The Bad Wildungen Airbnb market composition is heavily skewed towards Entire Home/Apt listings, which make up 91.3% of the 23 active rentals. This indicates strong guest preference for privacy and space.
- Looking at the property type distribution in Bad Wildungen, Apartment/Condo properties are the most common (65.2%), reflecting the local real estate landscape.
- Houses represent a significant 30.4% portion, catering likely to families or larger groups.
- Smaller segments like unique stays (combined 4.3%) offer potential for unique stay experiences.
Bad Wildungen Airbnb Room Capacity Analysis (2026): Bedroom Distribution
Distribution of Listings by Number of Bedrooms
Room Capacity Insights for Bad Wildungen
- The dominant room capacity in Bad Wildungen is 1 bedroom listings, making up 52.2% of the market. This suggests a strong demand for properties suitable for couples or solo travelers.
- Together, 1 bedroom and 2 bedrooms properties represent 78.3% of the active Airbnb listings in Bad Wildungen, indicating a high concentration in these sizes.
- With over half the market (52.2%) consisting of studios or 1-bedroom units, Bad Wildungen is particularly well-suited for individuals or couples.
Bad Wildungen Vacation Rental Guest Capacity Trends (2026)
Distribution of Listings by Guest Capacity
Guest Capacity Insights for Bad Wildungen
- The most common guest capacity trend in Bad Wildungen vacation rentals is listings accommodating 4 guests (34.8%). This suggests the primary traveler segment is likely small families or groups.
- Properties designed for 4 guests and 3 guests dominate the Bad Wildungen STR market, accounting for 52.2% of listings.
- 17.3% of properties accommodate 6+ guests, serving the market segment for larger families or group travel in Bad Wildungen.
- On average, properties in Bad Wildungen are equipped to host 3.7 guests.
Bad Wildungen Airbnb Booking Patterns (2026): Available vs. Booked Days
Available Days Distribution
Booked Days Distribution
Booking Pattern Insights for Bad Wildungen
- The most common availability pattern in Bad Wildungen falls within the 271-366 days range, representing 56.5% of listings. This suggests many properties have significant open periods on their calendars.
- Approximately 78.2% of listings show high availability (181+ days open annually), indicating potential for increased bookings or specific owner usage patterns.
- For booked days, the 31-90 days range is most frequent in Bad Wildungen (47.8%), reflecting common guest stay durations or potential owner blocking patterns.
- A notable 21.7% of properties secure long booking periods (181+ days booked per year), highlighting successful long-term rental strategies or significant owner usage.
Bad Wildungen Airbnb Minimum Stay Requirements Analysis
Distribution of Listings by Minimum Night Requirement
1 Night
5 listings
22.7% of total
2 Nights
6 listings
27.3% of total
3 Nights
3 listings
13.6% of total
4-6 Nights
2 listings
9.1% of total
30+ Nights
6 listings
27.3% of total
Key Insights
- The most prevalent minimum stay requirement in Bad Wildungen is 2 Nights, adopted by 27.3% of listings. This highlights the market's preference for shorter, flexible bookings.
- A significant segment (27.3%) caters to monthly stays (30+ nights) in Bad Wildungen, pointing to opportunities in the extended-stay market.
Recommendations
- Align with the market by considering a 2 Nights minimum stay, as 27.3% of Bad Wildungen hosts use this setting.
- If feasible, allowing 1-night stays, especially midweek or during low season, could capture last-minute bookings, as only 22.7% currently do.
- Explore offering discounts for stays of 30+ nights to attract the 27.3% of the market seeking extended stays.
- Adjust minimum nights based on seasonality – potentially shorter during low season and longer during peak demand periods in Bad Wildungen.
Bad Wildungen Airbnb Cancellation Policy Trends Analysis (2026)
Flexible
12 listings
54.5% of total
Moderate
4 listings
18.2% of total
Firm
6 listings
27.3% of total
Cancellation Policy Insights for Bad Wildungen
- The prevailing Airbnb cancellation policy trend in Bad Wildungen is Flexible, used by 54.5% of listings.
- The market strongly favors guest-friendly terms, with 72.7% of listings offering Flexible or Moderate policies. This suggests guests in Bad Wildungen may expect booking flexibility.
Recommendations for Hosts
- Consider adopting a Flexible policy to align with the 54.5% market standard in Bad Wildungen.
- Given the high prevalence of Flexible policies (54.5%), offering this can enhance booking appeal, especially during shoulder seasons.
- Regularly review your cancellation policy against competitors and market demand shifts in Bad Wildungen.
Bad Wildungen STR Booking Lead Time Analysis (2026)
Average Booking Lead Time by Month
Booking Lead Time Insights for Bad Wildungen
- The overall average booking lead time for vacation rentals in Bad Wildungen is 64 days.
- Guests book furthest in advance for stays during June (average 93 days), likely coinciding with peak travel demand or local events.
- The shortest booking windows occur for stays in February (average 36 days), indicating more last-minute travel plans during this time.
- Seasonally, Fall (79 days avg.) sees the longest lead times, while Winter (43 days avg.) has the shortest, reflecting typical travel planning cycles.
Recommendations for Hosts
- Use the overall average lead time (64 days) as a baseline for your pricing and availability strategy in Bad Wildungen.
- For June stays, consider implementing length-of-stay discounts or slightly higher rates for bookings made less than 93 days out to capitalize on advance planning.
- Target marketing efforts for the Fall season well in advance (at least 79 days) to capture early planners.
- Monitor your own booking lead times against these Bad Wildungen averages to identify opportunities for dynamic pricing adjustments.
Popular & Essential Airbnb Amenities in Bad Wildungen (2026)
Amenity Prevalence
Amenity Insights for Bad Wildungen
- Essential amenities in Bad Wildungen that guests expect include: Kitchen, Smoke alarm, TV, Wifi, Dishes and silverware. Lacking these (any) could significantly impact bookings.
- Popular amenities like Cooking basics, Heating, Free parking on premises are common but not universal. Offering these can provide a competitive edge.
Recommendations for Hosts
- Ensure your listing includes all essential amenities for Bad Wildungen: Kitchen, Smoke alarm, TV, Wifi, Dishes and silverware.
- Prioritize adding missing essentials: Smoke alarm, TV, Wifi, Dishes and silverware.
- Consider adding popular differentiators like Cooking basics or Heating to increase appeal.
- Highlight unique or less common amenities you offer (e.g., hot tub, dedicated workspace, EV charger) in your listing description and photos.
- Regularly check competitor amenities in Bad Wildungen to stay competitive.
Bad Wildungen Airbnb Guest Demographics & Profile Analysis (2026)
Guest Profile Summary for Bad Wildungen
- The typical guest profile for Airbnb in Bad Wildungen consists of primarily domestic travelers (84%), often arriving from nearby Berlin, typically belonging to the Post-2000s (Gen Z/Alpha) group (50%), primarily speaking English or German.
- Domestic travelers account for 83.8% of guests.
- Key international markets include Germany (83.8%) and Netherlands (9.1%).
- Top languages spoken are English (36.1%) followed by German (34.2%).
- A significant demographic segment is the Post-2000s (Gen Z/Alpha) group, representing 50% of guests.
Recommendations for Hosts
- Target domestic marketing efforts towards travelers from Berlin and Bremen.
- Tailor amenities and listing descriptions to appeal to the dominant Post-2000s (Gen Z/Alpha) demographic (e.g., highlight fast WiFi, smart home features, local guides).
- Highlight unique local experiences or amenities relevant to the primary guest profile.
- Consider seasonal promotions aligned with peak travel times for key origin markets.
Nearby Short-Term Rental Market Comparison
How does the Bad Wildungen Airbnb market stack up against its neighbors? Compare key performance metrics like average monthly revenue, ADR, and occupancy rates in surrounding areas to understand the broader regional STR landscape.
| Market | Active Properties | Monthly Revenue | Daily Rate | Avg. Occupancy |
|---|---|---|---|---|
| Schwalefeld | 37 | $2,350 | $281.62 | 32% |
| Runkel | 12 | $2,036 | $221.40 | 42% |
| Eslohe | 26 | $2,024 | $230.66 | 37% |
| Rietberg | 14 | $1,889 | $122.21 | 50% |
| Herzberg | 18 | $1,879 | $193.86 | 38% |
| Hofheim am Taunus | 14 | $1,824 | $223.25 | 41% |
| Sehnde | 16 | $1,820 | $148.37 | 41% |
| Bad Fallingbostel | 21 | $1,746 | $178.72 | 40% |
| Elgershausen | 12 | $1,683 | $103.45 | 49% |
| Usseln | 24 | $1,631 | $179.52 | 33% |