Wemding Airbnb Market Analysis 2026: Short Term Rental Data & Vacation Rental Statistics in Bavaria, Germany
Is Airbnb profitable in Wemding in 2026? Explore comprehensive Airbnb analytics for Wemding, Bavaria, Germany to uncover income potential. This 2026 STR market report for Wemding, based on AirROI data from February 2025 to January 2026, reveals key trends in the niche market of 21 active listings.
Whether you're considering an Airbnb investment in Wemding, optimizing your existing vacation rental, or exploring rental arbitrage opportunities, understanding the Wemding Airbnb data is crucial. Leveraging the low regulation environment is key to maximizing your short term rental income potential. Let's dive into the specifics.
Key Wemding Airbnb Performance Metrics Overview
Monthly Airbnb Revenue Variations & Income Potential in Wemding (2026)
Understanding the monthly revenue variations for Airbnb listings in Wemding is key to maximizing your short term rental income potential. Seasonality significantly impacts earnings. Our analysis, based on data from the past 12 months, shows that the peak revenue month for STRs in Wemding is typically August, while November often presents the lowest earnings, highlighting opportunities for strategic pricing adjustments during shoulder and low seasons. Explore the typical Airbnb income in Wemding across different performance tiers:
- Best-in-class properties (Top 10%) achieve $2,234+ monthly, often utilizing dynamic pricing and superior guest experiences.
- Strong performing properties (Top 25%) earn $1,359 or more, indicating effective management and desirable locations/amenities.
- Typical properties (Median) generate around $788 per month, representing the average market performance.
- Entry-level properties (Bottom 25%) see earnings around $393, often with potential for optimization.
Average Monthly Airbnb Earnings Trend in Wemding
Wemding Airbnb Occupancy Rate Trends (2026)
Maximize your bookings by understanding the Wemding STR occupancy trends. Seasonal demand shifts significantly influence how often properties are booked. Typically, Augustsees the highest demand (peak season occupancy), while January experiences the lowest (low season). Effective strategies, like adjusting minimum stays or offering promotions, can boost occupancy during slower periods. Here's how different property tiers perform in Wemding:
- Best-in-class properties (Top 10%) achieve 49%+ occupancy, indicating high desirability and potentially optimized availability.
- Strong performing properties (Top 25%) maintain 32% or higher occupancy, suggesting good market fit and guest satisfaction.
- Typical properties (Median) have an occupancy rate around 18%.
- Entry-level properties (Bottom 25%) average 10% occupancy, potentially facing higher vacancy.
Average Monthly Occupancy Rate Trend in Wemding
Average Daily Rate (ADR) Airbnb Trends in Wemding (2026)
Effective short term rental pricing strategy in Wemding involves understanding monthly ADR fluctuations. The Average Daily Rate (ADR) for Airbnb in Wemding typically peaks in January and dips lowest during March. Leveraging Airbnb dynamic pricing tools or strategies based on this seasonality can significantly boost revenue. Here's a look at the typical nightly rates achieved:
- Best-in-class properties (Top 10%) command rates of $169+ per night, often due to premium features or locations.
- Strong performing properties (Top 25%) achieve nightly rates of $150 or more.
- Typical properties (Median) charge around $130 per night.
- Entry-level properties (Bottom 25%) earn around $111 per night.
Average Daily Rate (ADR) Trend by Month in Wemding
Get Live Wemding Market Intelligence 👇
Explore Real-time Analytics
Airbnb Seasonality Analysis & Trends in Wemding (2026)
Peak Season (August, July, March)
- Revenue averages $1,386 per month
- Occupancy rates average 34.3%
- Daily rates average $126
Shoulder Season
- Revenue averages $1,017 per month
- Occupancy maintains around 23.9%
- Daily rates hold near $131
Low Season (January, October, November)
- Revenue drops to average $551 per month
- Occupancy decreases to average 11.1%
- Daily rates adjust to average $151
Seasonality Insights for Wemding
- The Airbnb seasonality in Wemding shows highly seasonal trends requiring careful strategy. While the sections above show seasonal averages, it's also insightful to look at the extremes:
- During the high season, the absolute peak month showcases Wemding's highest earning potential, with monthly revenues capable of climbing to $1,506, occupancy reaching a high of 36.9%, and ADRs peaking at $159.
- Conversely, the slowest single month of the year, typically falling within the low season, marks the market's lowest point. In this month, revenue might dip to $348, occupancy could drop to 7.5%, and ADRs may adjust down to $120.
- Understanding both the seasonal averages and these monthly peaks and troughs in revenue, occupancy, and ADR is crucial for maximizing your Airbnb profit potential in Wemding.
Seasonal Strategies for Maximizing Profit
- Peak Season: Maximize revenue through premium pricing and potentially longer minimum stays. Ensure high availability.
- Low Season: Offer competitive pricing, special promotions (e.g., extended stay discounts), and flexible cancellation policies. Target off-season travelers like remote workers or budget-conscious guests.
- Shoulder Seasons: Implement dynamic pricing that balances peak and low rates. Target weekend travelers or specific events. Offer slightly more flexible terms than peak season.
- Regularly analyze your own performance against these Wemding seasonality benchmarks and adjust your pricing and availability strategy accordingly.
Best Areas for Airbnb Investment in Wemding (2026)
Exploring the top neighborhoods for short-term rentals in Wemding? This section highlights key areas, outlining why they are attractive for hosts and guests, along with notable local attractions. Consider these locations based on your target guest profile and investment strategy.
| Neighborhood / Area | Why Host Here? (Target Guests & Appeal) | Key Attractions & Landmarks |
|---|---|---|
| Historic Town Center | Wemding's historic town center features well-preserved medieval architecture and local charm, making it a popular spot for tourists interested in history and culture. | St. John's Church, Historical Town Hall, The Old Bridge, Wemding Castle, City Wall, Local Markets |
| Sauerstock | Nearby Sauerstock offers a more rural setting with beautiful landscapes, appealing to nature lovers and those seeking peace and tranquility during their stay. | Hiking Trails, Natural Reserves, Scenic Views, Bavarian Countryside, Cycling Routes |
| Wemding Open Air Museum | This cultural site showcases traditional Bavarian life and attracts tourists interested in learning about the region’s history and craftsmanship. | Open Air Exhibits, Craft Demonstrations, Historical Workshops, Seasonal Events, Picnic Areas |
| Local Wineries | The outskirts are known for their picturesque vineyards where visitors can enjoy wine tastings and tours, ideal for food and wine enthusiasts. | Wine Tasting Tours, Vineyard Walks, Local Wine Festivals, Gastronomic Experiences |
| Golf Course Area | The local golf course attracts both golf enthusiasts and those looking for recreational activities in a serene environment. | Golfing Facilities, Clubhouse, Driving Range, Scenic Views |
| Adventure Park | An adventure park nearby provides activities for families and thrill-seekers, making it a great option for those traveling with kids. | Zip-lining, Climbing Walls, Obstacle Courses, Family Activities, Picnic Areas |
| Local Festivals | Wemding hosts various traditional festivals throughout the year, creating unique experiences for visitors. | Historic Celebrations, Cultural Events, Market Days, Bavarian Cuisine Experiences |
| Nearby Towns | Exploring nearby towns like Donauwörth and Augsburg offers guests additional sightseeing opportunities and cultural experiences. | Historic Town Centers, Museums, Shopping Areas, Culinary Experiences |
Understanding Airbnb License Requirements & STR Laws in Wemding (2026)
While Wemding, Bavaria, Germany currently shows low STR regulations, specific Airbnb license requirements might still exist or change. Always verify the latest short term rental regulations and Airbnb license requirements directly with local government authorities for Wemding to ensure full compliance before hosting.
(Source: AirROI data, 2026, based on 10% licensed listings)
Top Performing Airbnb Properties in Wemding (2026)
Benchmark your potential! Explore examples of top-performing Airbnb properties in Wemdingbased on Trailing Twelve Month (TTM) revenue. Analyze their characteristics, revenue, occupancy rate, and ADR to understand what drives success in this market.

Waldseechalet Julius - Wemding
Entire Place • 2 bedrooms

Tiny Haus Seeblick by Interhome
Entire Place • 2 bedrooms
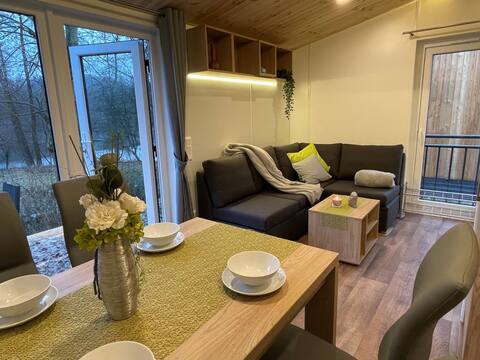
Tiny Haus Heike by Interhome
Entire Place • 2 bedrooms

Tiny house by the lake
Entire Place • 1 bedroom

Apartment Zum Dondl (Wemding)
Entire Place • 3 bedrooms

Tiny Haus Waldsee Lodge by Interhome
Entire Place • 1 bedroom
Note: Performance varies based on location, size, amenities, seasonality, and management quality. Data reflects the past 12 months.
Top Performing Airbnb Hosts in Wemding (2026)
Learn from the best! This table showcases top-performing Airbnb hosts in Wemding based on the number of properties managed and estimated total revenue over the past year. Analyze their scale and performance metrics.
| Host Name | Properties | Grossing Revenue | Stay Reviews | Avg Rating |
|---|---|---|---|---|
| Eva - Interhome | 16 | $124,518 | 28 | 4.54/5.0 |
| Tanja | 1 | $22,451 | 5 | 4.60/5.0 |
| Nadine | 2 | $15,674 | 6 | 5.00/5.0 |
| Raphael Martin | 1 | $13,945 | 5 | 5.00/5.0 |
| Valery | 1 | $8,362 | 21 | 4.90/5.0 |
Analyzing the strategies of top hosts, such as their property selection, pricing, and guest communication, can offer valuable lessons for optimizing your own Airbnb operations in Wemding.
Dive Deeper: Advanced Wemding STR Market Data (2026)
Ready to unlock more insights? AirROI provides access to advanced metrics and comprehensive Airbnb data for Wemding. Explore detailed analytics beyond this report to refine your investment strategy, optimize pricing, and maximize your vacation rental profits.
Explore Advanced MetricsWemding Short-Term Rental Market Composition (2026): Property & Room Types
Room Type Distribution
Property Type Distribution
Market Composition Insights for Wemding
- The Wemding Airbnb market composition is heavily skewed towards Entire Home/Apt listings, which make up 100% of the 21 active rentals. This indicates strong guest preference for privacy and space.
- Looking at the property type distribution in Wemding, House properties are the most common (90.5%), reflecting the local real estate landscape.
- Houses represent a significant 90.5% portion, catering likely to families or larger groups.
- Smaller segments like apartment/condo, hotel/boutique (combined 9.6%) offer potential for unique stay experiences.
Wemding Airbnb Room Capacity Analysis (2026): Bedroom Distribution
Distribution of Listings by Number of Bedrooms
Room Capacity Insights for Wemding
- The dominant room capacity in Wemding is 1 bedroom listings, making up 61.9% of the market. This suggests a strong demand for properties suitable for couples or solo travelers.
- Together, 1 bedroom and 2 bedrooms properties represent 95.2% of the active Airbnb listings in Wemding, indicating a high concentration in these sizes.
- With over half the market (61.9%) consisting of studios or 1-bedroom units, Wemding is particularly well-suited for individuals or couples.
- Listings with 3+ bedrooms (4.8%) represent a smaller niche, potentially indicating an underserved market for larger group accommodations in Wemding.
Wemding Vacation Rental Guest Capacity Trends (2026)
Distribution of Listings by Guest Capacity
Guest Capacity Insights for Wemding
- The most common guest capacity trend in Wemding vacation rentals is listings accommodating 4 guests (76.2%). This suggests the primary traveler segment is likely small families or groups.
- Properties designed for 4 guests and 3 guests dominate the Wemding STR market, accounting for 85.7% of listings.
- On average, properties in Wemding are equipped to host 3.9 guests.
Wemding Airbnb Booking Patterns (2026): Available vs. Booked Days
Available Days Distribution
Booked Days Distribution
Booking Pattern Insights for Wemding
- The most common availability pattern in Wemding falls within the 271-366 days range, representing 76.2% of listings. This suggests many properties have significant open periods on their calendars.
- Approximately 100.0% of listings show high availability (181+ days open annually), indicating potential for increased bookings or specific owner usage patterns.
- For booked days, the 31-90 days range is most frequent in Wemding (61.9%), reflecting common guest stay durations or potential owner blocking patterns.
Wemding Airbnb Minimum Stay Requirements Analysis
Distribution of Listings by Minimum Night Requirement
1 Night
2 listings
9.5% of total
2 Nights
2 listings
9.5% of total
30+ Nights
17 listings
81% of total
Key Insights
- The most prevalent minimum stay requirement in Wemding is 30+ Nights, adopted by 81% of listings. This highlights the market's preference for longer commitments.
- Very short stays (1-2 nights) are less common (19.0%), suggesting hosts prefer slightly longer bookings to optimize turnover.
- A significant segment (81%) caters to monthly stays (30+ nights) in Wemding, pointing to opportunities in the extended-stay market.
Recommendations
- Align with the market by considering a 30+ Nights minimum stay, as 81% of Wemding hosts use this setting.
- If feasible, allowing 1-night stays, especially midweek or during low season, could capture last-minute bookings, as only 9.5% currently do.
- Explore offering discounts for stays of 30+ nights to attract the 81% of the market seeking extended stays.
- Adjust minimum nights based on seasonality – potentially shorter during low season and longer during peak demand periods in Wemding.
Wemding Airbnb Cancellation Policy Trends Analysis (2026)
Moderate
2 listings
9.5% of total
Firm
19 listings
90.5% of total
Cancellation Policy Insights for Wemding
- The prevailing Airbnb cancellation policy trend in Wemding is Firm, used by 90.5% of listings.
- A majority (90.5%) of hosts in Wemding utilize Firm or Strict policies, indicating a market where hosts prioritize booking security.
Recommendations for Hosts
- Consider adopting a Firm policy to align with the 90.5% market standard in Wemding.
- Regularly review your cancellation policy against competitors and market demand shifts in Wemding.
Wemding STR Booking Lead Time Analysis (2026)
Average Booking Lead Time by Month
Booking Lead Time Insights for Wemding
- The overall average booking lead time for vacation rentals in Wemding is 30 days.
- Guests book furthest in advance for stays during May (average 56 days), likely coinciding with peak travel demand or local events.
- The shortest booking windows occur for stays in March (average 3 days), indicating more last-minute travel plans during this time.
- Seasonally, Summer (44 days avg.) sees the longest lead times, while Winter (20 days avg.) has the shortest, reflecting typical travel planning cycles.
Recommendations for Hosts
- Use the overall average lead time (30 days) as a baseline for your pricing and availability strategy in Wemding.
- For May stays, consider implementing length-of-stay discounts or slightly higher rates for bookings made less than 56 days out to capitalize on advance planning.
- During March, focus on last-minute booking availability and promotions, as guests book with very short notice (3 days avg.).
- Target marketing efforts for the Summer season well in advance (at least 44 days) to capture early planners.
- Monitor your own booking lead times against these Wemding averages to identify opportunities for dynamic pricing adjustments.
Popular & Essential Airbnb Amenities in Wemding (2026)
Amenity Prevalence
Amenity Insights for Wemding
- Essential amenities in Wemding that guests expect include: Wifi, TV, Patio or balcony, Hot water, Hot water kettle, Dishes and silverware, Refrigerator, Stove, Cooking basics, Hangers. Lacking these (any) could significantly impact bookings.
Recommendations for Hosts
- Ensure your listing includes all essential amenities for Wemding: Wifi, TV, Patio or balcony, Hot water, Hot water kettle, Dishes and silverware, Refrigerator, Stove, Cooking basics, Hangers.
- Prioritize adding missing essentials: Patio or balcony, Hot water, Hot water kettle, Dishes and silverware, Refrigerator, Stove, Cooking basics, Hangers.
- Highlight unique or less common amenities you offer (e.g., hot tub, dedicated workspace, EV charger) in your listing description and photos.
- Regularly check competitor amenities in Wemding to stay competitive.
Wemding Airbnb Guest Demographics & Profile Analysis (2026)
Guest Profile Summary for Wemding
- The typical guest profile for Airbnb in Wemding consists of predominantly international visitors (69%), with top international origins including Germany, typically belonging to the 1990s (Older Gen Z) group (50%), primarily speaking English or German.
- Domestic travelers account for 31.3% of guests.
- Key international markets include Poland (56.3%) and Germany (31.3%).
- Top languages spoken are English (44.4%) followed by German (44.4%).
- A significant demographic segment is the Post-2000s (Gen Z/Alpha) group, representing 50% of guests.
Recommendations for Hosts
- Focus marketing internationally, particularly towards travelers from Germany.
- Tailor amenities and listing descriptions to appeal to the dominant 1990s (Older Gen Z) demographic (e.g., highlight fast WiFi, smart home features, local guides).
- Highlight unique local experiences or amenities relevant to the primary guest profile.
- Consider seasonal promotions aligned with peak travel times for key origin markets.
Nearby Short-Term Rental Market Comparison
How does the Wemding Airbnb market stack up against its neighbors? Compare key performance metrics like average monthly revenue, ADR, and occupancy rates in surrounding areas to understand the broader regional STR landscape.
| Market | Active Properties | Monthly Revenue | Daily Rate | Avg. Occupancy |
|---|---|---|---|---|
| Balderschwang | 10 | $5,253 | $304.03 | 58% |
| Bürserberg | 45 | $3,783 | $331.48 | 40% |
| Brand | 63 | $3,714 | $522.47 | 31% |
| Kramsach | 12 | $3,573 | $272.32 | 48% |
| Kusterdingen | 10 | $3,119 | $229.94 | 43% |
| Stans | 12 | $3,115 | $255.48 | 43% |
| Pfafflar | 11 | $3,053 | $255.26 | 50% |
| Thaur | 12 | $2,954 | $152.36 | 69% |
| Scharnitz | 52 | $2,952 | $329.93 | 36% |
| Poing | 16 | $2,939 | $162.94 | 57% |