Starnberg Airbnb Market Analysis 2026: Short Term Rental Data & Vacation Rental Statistics in Bavaria, Germany
Is Airbnb profitable in Starnberg in 2026? Explore comprehensive Airbnb analytics for Starnberg, Bavaria, Germany to uncover income potential. This 2026 STR market report for Starnberg, based on AirROI data from February 2025 to January 2026, reveals key trends in the niche market of 63 active listings.
Whether you're considering an Airbnb investment in Starnberg, optimizing your existing vacation rental, or exploring rental arbitrage opportunities, understanding the Starnberg Airbnb data is crucial. Leveraging the low regulation environment is key to maximizing your short term rental income potential. Let's dive into the specifics.
Key Starnberg Airbnb Performance Metrics Overview
Monthly Airbnb Revenue Variations & Income Potential in Starnberg (2026)
Understanding the monthly revenue variations for Airbnb listings in Starnberg is key to maximizing your short term rental income potential. Seasonality significantly impacts earnings. Our analysis, based on data from the past 12 months, shows that the peak revenue month for STRs in Starnberg is typically August, while January often presents the lowest earnings, highlighting opportunities for strategic pricing adjustments during shoulder and low seasons. Explore the typical Airbnb income in Starnberg across different performance tiers:
- Best-in-class properties (Top 10%) achieve $5,389+ monthly, often utilizing dynamic pricing and superior guest experiences.
- Strong performing properties (Top 25%) earn $3,360 or more, indicating effective management and desirable locations/amenities.
- Typical properties (Median) generate around $1,872 per month, representing the average market performance.
- Entry-level properties (Bottom 25%) see earnings around $983, often with potential for optimization.
Average Monthly Airbnb Earnings Trend in Starnberg
Starnberg Airbnb Occupancy Rate Trends (2026)
Maximize your bookings by understanding the Starnberg STR occupancy trends. Seasonal demand shifts significantly influence how often properties are booked. Typically, Augustsees the highest demand (peak season occupancy), while January experiences the lowest (low season). Effective strategies, like adjusting minimum stays or offering promotions, can boost occupancy during slower periods. Here's how different property tiers perform in Starnberg:
- Best-in-class properties (Top 10%) achieve 83%+ occupancy, indicating high desirability and potentially optimized availability.
- Strong performing properties (Top 25%) maintain 69% or higher occupancy, suggesting good market fit and guest satisfaction.
- Typical properties (Median) have an occupancy rate around 46%.
- Entry-level properties (Bottom 25%) average 24% occupancy, potentially facing higher vacancy.
Average Monthly Occupancy Rate Trend in Starnberg
Average Daily Rate (ADR) Airbnb Trends in Starnberg (2026)
Effective short term rental pricing strategy in Starnberg involves understanding monthly ADR fluctuations. The Average Daily Rate (ADR) for Airbnb in Starnberg typically peaks in September and dips lowest during February. Leveraging Airbnb dynamic pricing tools or strategies based on this seasonality can significantly boost revenue. Here's a look at the typical nightly rates achieved:
- Best-in-class properties (Top 10%) command rates of $269+ per night, often due to premium features or locations.
- Strong performing properties (Top 25%) achieve nightly rates of $186 or more.
- Typical properties (Median) charge around $130 per night.
- Entry-level properties (Bottom 25%) earn around $85 per night.
Average Daily Rate (ADR) Trend by Month in Starnberg
Get Live Starnberg Market Intelligence 👇

Explore Real-time Analytics
Airbnb Seasonality Analysis & Trends in Starnberg (2026)
Peak Season (August, July, September)
- Revenue averages $3,716 per month
- Occupancy rates average 61.7%
- Daily rates average $167
Shoulder Season
- Revenue averages $2,347 per month
- Occupancy maintains around 45.5%
- Daily rates hold near $156
Low Season (January, February, March)
- Revenue drops to average $1,552 per month
- Occupancy decreases to average 36.2%
- Daily rates adjust to average $144
Seasonality Insights for Starnberg
- The Airbnb seasonality in Starnberg shows highly seasonal trends requiring careful strategy. While the sections above show seasonal averages, it's also insightful to look at the extremes:
- During the high season, the absolute peak month showcases Starnberg's highest earning potential, with monthly revenues capable of climbing to $3,938, occupancy reaching a high of 65.9%, and ADRs peaking at $187.
- Conversely, the slowest single month of the year, typically falling within the low season, marks the market's lowest point. In this month, revenue might dip to $1,205, occupancy could drop to 20.8%, and ADRs may adjust down to $139.
- Understanding both the seasonal averages and these monthly peaks and troughs in revenue, occupancy, and ADR is crucial for maximizing your Airbnb profit potential in Starnberg.
Seasonal Strategies for Maximizing Profit
- Peak Season: Maximize revenue through premium pricing and potentially longer minimum stays. Ensure high availability.
- Low Season: Offer competitive pricing, special promotions (e.g., extended stay discounts), and flexible cancellation policies. Target off-season travelers like remote workers or budget-conscious guests.
- Shoulder Seasons: Implement dynamic pricing that balances peak and low rates. Target weekend travelers or specific events. Offer slightly more flexible terms than peak season.
- Regularly analyze your own performance against these Starnberg seasonality benchmarks and adjust your pricing and availability strategy accordingly.
Best Areas for Airbnb Investment in Starnberg (2026)
Exploring the top neighborhoods for short-term rentals in Starnberg? This section highlights key areas, outlining why they are attractive for hosts and guests, along with notable local attractions. Consider these locations based on your target guest profile and investment strategy.
| Neighborhood / Area | Why Host Here? (Target Guests & Appeal) | Key Attractions & Landmarks |
|---|---|---|
| Starnberger See | A picturesque lake area known for its stunning views and recreational activities. Ideal for tourists looking for nature and relaxation, with opportunities for swimming, sailing, and hiking. | Starnberger See, Votivkapelle, Rose Island, Museum Starnberger See, Tutzinger Kloster |
| Bernried | A charming village located on the shores of Lake Starnberg, offering a serene atmosphere and beautiful landscapes. Popular with visitors seeking tranquility and nature. | Bernried Monastery, Buchheim Museum, Seeshaupt Beach, Hiking Trails, Scenic Lake Views |
| Feldafing | Known for its lovely beaches and parks along the lake, Feldafing is a great destination for families and nature lovers looking to escape the city. | Feldafing Beach, Golfclub Bergenza, Manor House, Hiking Trails, Lakeside Promenade |
| Possenhofen | A picturesque town famous for its historical significance and natural beauty, attracting visitors interested in culture and outdoor activities. | Possenhofen Castle, Auer Mühlbach, Historical Walking Trails, Local Vineyards, Scenic Lake Views |
| Wörthsee | A beautiful lakeside area that is perfect for summer vacations, offering many water sports and leisure activities for both families and couples. | Wörthsee Lake, Lakeside Restaurants, Water Sports, Hiking Trails, Picnic Areas |
| Tutzing | A vibrant town with a strong cultural scene and direct access to the lake, making it a popular choice for visitors looking for a blend of activity and relaxation. | Tutzing Beach, Tutzing Harbor, Cultural Events, Historical Sites, Marina |
| Andechs | Famous for the Andechs Monastery, this area attracts both religious tourists and those looking for beautiful hiking trails and lake views. | Andechs Monastery, Hiking Trails, Brewery, Lake Views, Picnic Areas |
| Starnberg Town Center | The bustling heart of Starnberg with shops, restaurants, and cafes. Excellent for guests who want to experience local life and have easy access to transportation. | Starnberg Market Square, Local Shops, Cafe Culture, Public Transport Access, Restaurants |
Understanding Airbnb License Requirements & STR Laws in Starnberg (2026)
While Starnberg, Bavaria, Germany currently shows low STR regulations, specific Airbnb license requirements might still exist or change. Always verify the latest short term rental regulations and Airbnb license requirements directly with local government authorities for Starnberg to ensure full compliance before hosting.
(Source: AirROI data, 2026, finding no licensed listings among those analyzed)
Top Performing Airbnb Properties in Starnberg (2026)
Benchmark your potential! Explore examples of top-performing Airbnb properties in Starnbergbased on Trailing Twelve Month (TTM) revenue. Analyze their characteristics, revenue, occupancy rate, and ADR to understand what drives success in this market.

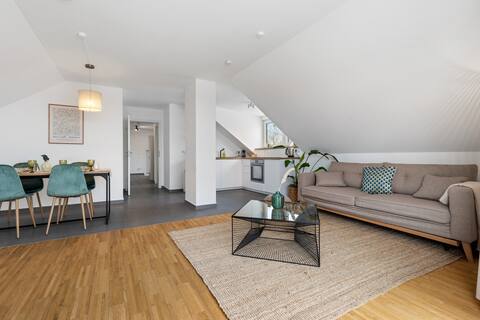
liBORIA: Stylish house | Sauna | 5min to the lake
Entire Place • 4 bedrooms
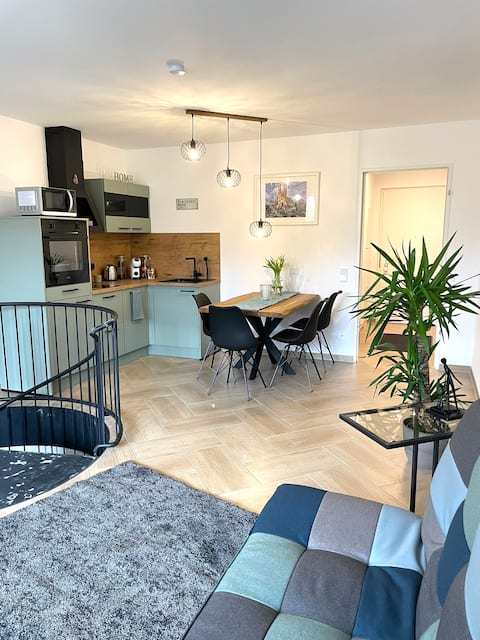
Casa Verde: TV/Nespresso, Design, in the midst of Nature
Entire Place • 2 bedrooms

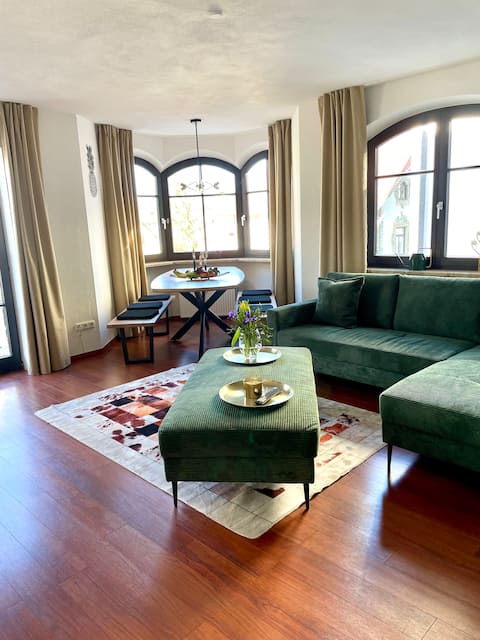
Holiday House Casa Mantini Hanfeld
Entire Place • 5 bedrooms

Elegant terrace house for children from 6 years
Entire Place • 4 bedrooms
2-room apartment with terrace, Starnberg lake nearby
Entire Place • 1 bedroom
Boutique bnb, Starnberg-Lake nearby
Entire Place • 2 bedrooms
Note: Performance varies based on location, size, amenities, seasonality, and management quality. Data reflects the past 12 months.
Top Performing Airbnb Hosts in Starnberg (2026)
Learn from the best! This table showcases top-performing Airbnb hosts in Starnberg based on the number of properties managed and estimated total revenue over the past year. Analyze their scale and performance metrics.
| Host Name | Properties | Grossing Revenue | Stay Reviews | Avg Rating |
|---|---|---|---|---|
| Frank | 4 | $150,229 | 273 | 4.96/5.0 |
| Ralph Und Bine | 5 | $124,825 | 652 | 4.56/5.0 |
| Jomo | 1 | $104,783 | 34 | 4.79/5.0 |
| Lukas | 1 | $81,370 | 68 | 4.90/5.0 |
| Annika | 2 | $67,792 | 21 | 4.92/5.0 |
| Cornelia | 1 | $66,406 | 26 | 4.92/5.0 |
| Stycoz | 2 | $54,850 | 51 | 4.69/5.0 |
| Johanna | 2 | $45,561 | 270 | 4.94/5.0 |
| Thomas | 1 | $43,756 | 26 | 5.00/5.0 |
| Bianca | 1 | $42,211 | 40 | 4.83/5.0 |
Analyzing the strategies of top hosts, such as their property selection, pricing, and guest communication, can offer valuable lessons for optimizing your own Airbnb operations in Starnberg.
Dive Deeper: Advanced Starnberg STR Market Data (2026)
Ready to unlock more insights? AirROI provides access to advanced metrics and comprehensive Airbnb data for Starnberg. Explore detailed analytics beyond this report to refine your investment strategy, optimize pricing, and maximize your vacation rental profits.
Explore Advanced MetricsStarnberg Short-Term Rental Market Composition (2026): Property & Room Types
Room Type Distribution
Property Type Distribution
Market Composition Insights for Starnberg
- The Starnberg Airbnb market composition is heavily skewed towards Entire Home/Apt listings, which make up 77.8% of the 63 active rentals. This indicates strong guest preference for privacy and space.
- Looking at the property type distribution in Starnberg, Apartment/Condo properties are the most common (63.5%), reflecting the local real estate landscape.
- Houses represent a significant 33.3% portion, catering likely to families or larger groups.
- Smaller segments like hotel/boutique (combined 3.2%) offer potential for unique stay experiences.
Starnberg Airbnb Room Capacity Analysis (2026): Bedroom Distribution
Distribution of Listings by Number of Bedrooms
Room Capacity Insights for Starnberg
- The dominant room capacity in Starnberg is 1 bedroom listings, making up 42.9% of the market. This suggests a strong demand for properties suitable for couples or solo travelers.
- Together, 1 bedroom and 2 bedrooms properties represent 68.3% of the active Airbnb listings in Starnberg, indicating a high concentration in these sizes.
Starnberg Vacation Rental Guest Capacity Trends (2026)
Distribution of Listings by Guest Capacity
Guest Capacity Insights for Starnberg
- The most common guest capacity trend in Starnberg vacation rentals is listings accommodating 4 guests (22.2%). This suggests the primary traveler segment is likely small families or groups.
- Properties designed for 4 guests and 2 guests dominate the Starnberg STR market, accounting for 41.2% of listings.
- 19.0% of properties accommodate 6+ guests, serving the market segment for larger families or group travel in Starnberg.
- On average, properties in Starnberg are equipped to host 3.5 guests.
Starnberg Airbnb Booking Patterns (2026): Available vs. Booked Days
Available Days Distribution
Booked Days Distribution
Booking Pattern Insights for Starnberg
- The most common availability pattern in Starnberg falls within the 181-270 days range, representing 42.9% of listings. This suggests many properties have significant open periods on their calendars.
- Approximately 73.1% of listings show high availability (181+ days open annually), indicating potential for increased bookings or specific owner usage patterns.
- For booked days, the 91-180 days range is most frequent in Starnberg (42.9%), reflecting common guest stay durations or potential owner blocking patterns.
- A notable 28.5% of properties secure long booking periods (181+ days booked per year), highlighting successful long-term rental strategies or significant owner usage.
Starnberg Airbnb Minimum Stay Requirements Analysis
Distribution of Listings by Minimum Night Requirement
1 Night
6 listings
9.5% of total
2 Nights
9 listings
14.3% of total
3 Nights
9 listings
14.3% of total
4-6 Nights
12 listings
19% of total
7-29 Nights
3 listings
4.8% of total
30+ Nights
24 listings
38.1% of total
Key Insights
- The most prevalent minimum stay requirement in Starnberg is 30+ Nights, adopted by 38.1% of listings. This highlights the market's preference for longer commitments.
- A significant segment (38.1%) caters to monthly stays (30+ nights) in Starnberg, pointing to opportunities in the extended-stay market.
Recommendations
- Align with the market by considering a 30+ Nights minimum stay, as 38.1% of Starnberg hosts use this setting.
- If feasible, allowing 1-night stays, especially midweek or during low season, could capture last-minute bookings, as only 9.5% currently do.
- Explore offering discounts for stays of 30+ nights to attract the 38.1% of the market seeking extended stays.
- Adjust minimum nights based on seasonality – potentially shorter during low season and longer during peak demand periods in Starnberg.
Starnberg Airbnb Cancellation Policy Trends Analysis (2026)
Flexible
9 listings
14.3% of total
Moderate
30 listings
47.6% of total
Firm
13 listings
20.6% of total
Strict
11 listings
17.5% of total
Cancellation Policy Insights for Starnberg
- The prevailing Airbnb cancellation policy trend in Starnberg is Moderate, used by 47.6% of listings.
- There's a relatively balanced mix between guest-friendly (61.9%) and stricter (38.1%) policies, offering choices for different guest needs.
Recommendations for Hosts
- Consider adopting a Moderate policy to align with the 47.6% market standard in Starnberg.
- Regularly review your cancellation policy against competitors and market demand shifts in Starnberg.
Starnberg STR Booking Lead Time Analysis (2026)
Average Booking Lead Time by Month
Booking Lead Time Insights for Starnberg
- The overall average booking lead time for vacation rentals in Starnberg is 53 days.
- Guests book furthest in advance for stays during September (average 73 days), likely coinciding with peak travel demand or local events.
- The shortest booking windows occur for stays in November (average 33 days), indicating more last-minute travel plans during this time.
- Seasonally, Summer (64 days avg.) sees the longest lead times, while Winter (38 days avg.) has the shortest, reflecting typical travel planning cycles.
Recommendations for Hosts
- Use the overall average lead time (53 days) as a baseline for your pricing and availability strategy in Starnberg.
- For September stays, consider implementing length-of-stay discounts or slightly higher rates for bookings made less than 73 days out to capitalize on advance planning.
- Target marketing efforts for the Summer season well in advance (at least 64 days) to capture early planners.
- Monitor your own booking lead times against these Starnberg averages to identify opportunities for dynamic pricing adjustments.
Popular & Essential Airbnb Amenities in Starnberg (2026)
Amenity Prevalence
Amenity Insights for Starnberg
- Essential amenities in Starnberg that guests expect include: Wifi, Heating. Lacking these (any) could significantly impact bookings.
- Popular amenities like Smoke alarm, Hot water, Hair dryer are common but not universal. Offering these can provide a competitive edge.
Recommendations for Hosts
- Ensure your listing includes all essential amenities for Starnberg: Wifi, Heating.
- Prioritize adding missing essentials: Heating.
- Consider adding popular differentiators like Smoke alarm or Hot water to increase appeal.
- Highlight unique or less common amenities you offer (e.g., hot tub, dedicated workspace, EV charger) in your listing description and photos.
- Regularly check competitor amenities in Starnberg to stay competitive.
Starnberg Airbnb Guest Demographics & Profile Analysis (2026)
Guest Profile Summary for Starnberg
- The typical guest profile for Airbnb in Starnberg consists of a mix of domestic (57%) and international guests, often arriving from nearby Munich, typically belonging to the Post-2000s (Gen Z/Alpha) group (50%), primarily speaking English or German.
- Domestic travelers account for 56.9% of guests.
- Key international markets include Germany (56.9%) and United States (11.3%).
- Top languages spoken are English (40.4%) followed by German (28.4%).
- A significant demographic segment is the Post-2000s (Gen Z/Alpha) group, representing 50% of guests.
Recommendations for Hosts
- Balance marketing efforts between domestic and international channels based on the guest mix.
- Tailor amenities and listing descriptions to appeal to the dominant Post-2000s (Gen Z/Alpha) demographic (e.g., highlight fast WiFi, smart home features, local guides).
- Highlight unique local experiences or amenities relevant to the primary guest profile.
- Consider seasonal promotions aligned with peak travel times for key origin markets.
Nearby Short-Term Rental Market Comparison
How does the Starnberg Airbnb market stack up against its neighbors? Compare key performance metrics like average monthly revenue, ADR, and occupancy rates in surrounding areas to understand the broader regional STR landscape.
| Market | Active Properties | Monthly Revenue | Daily Rate | Avg. Occupancy |
|---|---|---|---|---|
| Scheffau am Wilden Kaiser | 12 | $6,669 | $906.83 | 30% |
| Balderschwang | 10 | $5,253 | $304.03 | 58% |
| Going am Wilden Kaiser | 27 | $3,596 | $406.50 | 37% |
| Kramsach | 12 | $3,573 | $272.32 | 48% |
| Bayrischzell | 41 | $3,550 | $389.91 | 33% |
| Krimml | 53 | $3,544 | $359.14 | 41% |
| Reith bei Kitzbühel | 49 | $3,385 | $356.25 | 34% |
| Stans | 12 | $3,115 | $255.48 | 43% |
| Pfafflar | 11 | $3,053 | $255.26 | 50% |
| Thaur | 12 | $2,954 | $152.36 | 69% |