Oberhaching Airbnb Market Analysis 2026: Short Term Rental Data & Vacation Rental Statistics in Bavaria, Germany
Is Airbnb profitable in Oberhaching in 2026? Explore comprehensive Airbnb analytics for Oberhaching, Bavaria, Germany to uncover income potential. This 2026 STR market report for Oberhaching, based on AirROI data from February 2025 to January 2026, reveals key trends in the niche market of 25 active listings.
Whether you're considering an Airbnb investment in Oberhaching, optimizing your existing vacation rental, or exploring rental arbitrage opportunities, understanding the Oberhaching Airbnb data is crucial. Leveraging the low regulation environment is key to maximizing your short term rental income potential. Let's dive into the specifics.
Key Oberhaching Airbnb Performance Metrics Overview
Monthly Airbnb Revenue Variations & Income Potential in Oberhaching (2026)
Understanding the monthly revenue variations for Airbnb listings in Oberhaching is key to maximizing your short term rental income potential. Seasonality significantly impacts earnings. Our analysis, based on data from the past 12 months, shows that the peak revenue month for STRs in Oberhaching is typically September, while January often presents the lowest earnings, highlighting opportunities for strategic pricing adjustments during shoulder and low seasons. Explore the typical Airbnb income in Oberhaching across different performance tiers:
- Best-in-class properties (Top 10%) achieve $4,261+ monthly, often utilizing dynamic pricing and superior guest experiences.
- Strong performing properties (Top 25%) earn $2,558 or more, indicating effective management and desirable locations/amenities.
- Typical properties (Median) generate around $1,740 per month, representing the average market performance.
- Entry-level properties (Bottom 25%) see earnings around $1,062, often with potential for optimization.
Average Monthly Airbnb Earnings Trend in Oberhaching
Oberhaching Airbnb Occupancy Rate Trends (2026)
Maximize your bookings by understanding the Oberhaching STR occupancy trends. Seasonal demand shifts significantly influence how often properties are booked. Typically, Septembersees the highest demand (peak season occupancy), while January experiences the lowest (low season). Effective strategies, like adjusting minimum stays or offering promotions, can boost occupancy during slower periods. Here's how different property tiers perform in Oberhaching:
- Best-in-class properties (Top 10%) achieve 88%+ occupancy, indicating high desirability and potentially optimized availability.
- Strong performing properties (Top 25%) maintain 76% or higher occupancy, suggesting good market fit and guest satisfaction.
- Typical properties (Median) have an occupancy rate around 53%.
- Entry-level properties (Bottom 25%) average 35% occupancy, potentially facing higher vacancy.
Average Monthly Occupancy Rate Trend in Oberhaching
Average Daily Rate (ADR) Airbnb Trends in Oberhaching (2026)
Effective short term rental pricing strategy in Oberhaching involves understanding monthly ADR fluctuations. The Average Daily Rate (ADR) for Airbnb in Oberhaching typically peaks in September and dips lowest during February. Leveraging Airbnb dynamic pricing tools or strategies based on this seasonality can significantly boost revenue. Here's a look at the typical nightly rates achieved:
- Best-in-class properties (Top 10%) command rates of $242+ per night, often due to premium features or locations.
- Strong performing properties (Top 25%) achieve nightly rates of $132 or more.
- Typical properties (Median) charge around $90 per night.
- Entry-level properties (Bottom 25%) earn around $65 per night.
Average Daily Rate (ADR) Trend by Month in Oberhaching
Get Live Oberhaching Market Intelligence 👇

Explore Real-time Analytics
Airbnb Seasonality Analysis & Trends in Oberhaching (2026)
Peak Season (September, October, June)
- Revenue averages $2,981 per month
- Occupancy rates average 68.8%
- Daily rates average $147
Shoulder Season
- Revenue averages $2,297 per month
- Occupancy maintains around 55.5%
- Daily rates hold near $127
Low Season (January, February, March)
- Revenue drops to average $1,360 per month
- Occupancy decreases to average 40.6%
- Daily rates adjust to average $117
Seasonality Insights for Oberhaching
- The Airbnb seasonality in Oberhaching shows highly seasonal trends requiring careful strategy. While the sections above show seasonal averages, it's also insightful to look at the extremes:
- During the high season, the absolute peak month showcases Oberhaching's highest earning potential, with monthly revenues capable of climbing to $3,421, occupancy reaching a high of 73.0%, and ADRs peaking at $171.
- Conversely, the slowest single month of the year, typically falling within the low season, marks the market's lowest point. In this month, revenue might dip to $1,244, occupancy could drop to 31.5%, and ADRs may adjust down to $109.
- Understanding both the seasonal averages and these monthly peaks and troughs in revenue, occupancy, and ADR is crucial for maximizing your Airbnb profit potential in Oberhaching.
Seasonal Strategies for Maximizing Profit
- Peak Season: Maximize revenue through premium pricing and potentially longer minimum stays. Ensure high availability.
- Low Season: Offer competitive pricing, special promotions (e.g., extended stay discounts), and flexible cancellation policies. Target off-season travelers like remote workers or budget-conscious guests.
- Shoulder Seasons: Implement dynamic pricing that balances peak and low rates. Target weekend travelers or specific events. Offer slightly more flexible terms than peak season.
- Regularly analyze your own performance against these Oberhaching seasonality benchmarks and adjust your pricing and availability strategy accordingly.
Best Areas for Airbnb Investment in Oberhaching (2026)
Exploring the top neighborhoods for short-term rentals in Oberhaching? This section highlights key areas, outlining why they are attractive for hosts and guests, along with notable local attractions. Consider these locations based on your target guest profile and investment strategy.
| Neighborhood / Area | Why Host Here? (Target Guests & Appeal) | Key Attractions & Landmarks |
|---|---|---|
| Oberhaching Center | The heart of Oberhaching with charming local shops, cafes, and restaurants. This area attracts both leisure and business travelers looking for a cozy suburban feel with easy access to Munich. | Oberhaching Town Hall, local parks, café culture, nearby S-Bahn stations to Munich |
| Haching Sports Park | A family-friendly area with ample recreational opportunities like sports fields, picnic areas, and playgrounds. Appeals to families and active travelers looking for outdoor activities. | Haching Sports Park, walking and cycling trails, playgrounds, community events |
| München Haching | Close proximity to Munich city limits, this area benefits from urban conveniences while maintaining a quieter atmosphere. Perfect for guests needing quick access to Munich while enjoying a peaceful retreat. | S-Bahn connections to Munich, local shops, parks, residential tranquility |
| Waldheim | A scenic neighborhood known for its natural beauty and parks. Ideal for nature lovers looking to enjoy the local flora and outdoor experiences. | Waldheim Park, hiking trails, nature reserves, local wildlife |
| Baumgarten | A quaint residential area that features picturesque homes and a strong community spirit. Attractive for visitors wanting a taste of local Bavarian life. | traditional Bavarian architecture, local cafes, community events |
| Oberhaching Palace | Rich in history, this area features the historic Oberhaching Palace. Captivates guests with its historical significance and charming surroundings. | Oberhaching Palace, historical tours, enjoyable gardens |
| Rotbuchenstraße | A sought-after area with newer developments and modern amenities. Appeals to young professionals and business travelers who prefer contemporary living spaces. | modern apartments, local amenities, nearby transport links |
| Oberhaching Nature Trails | Perfect for outdoor enthusiasts, this area offers beautiful trails for hiking and biking, attracting those who prioritize an active lifestyle during their stay. | scenic nature trails, biking paths, outdoor activities |
Understanding Airbnb License Requirements & STR Laws in Oberhaching (2026)
While Oberhaching, Bavaria, Germany currently shows low STR regulations, specific Airbnb license requirements might still exist or change. Always verify the latest short term rental regulations and Airbnb license requirements directly with local government authorities for Oberhaching to ensure full compliance before hosting.
(Source: AirROI data, 2026, finding no licensed listings among those analyzed)
Top Performing Airbnb Properties in Oberhaching (2026)
Benchmark your potential! Explore examples of top-performing Airbnb properties in Oberhachingbased on Trailing Twelve Month (TTM) revenue. Analyze their characteristics, revenue, occupancy rate, and ADR to understand what drives success in this market.
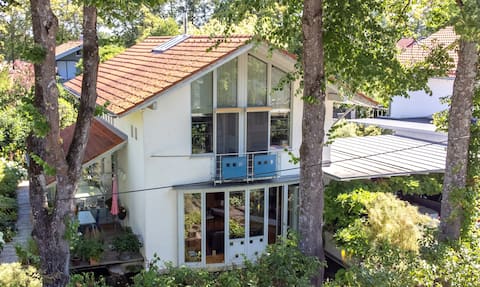
25 min to the center: 220 m² artist's house 4 rooms - 3 bedrooms
Entire Place • 4 bedrooms
Country house in the south of Munich by the forest
Entire Place • 4 bedrooms
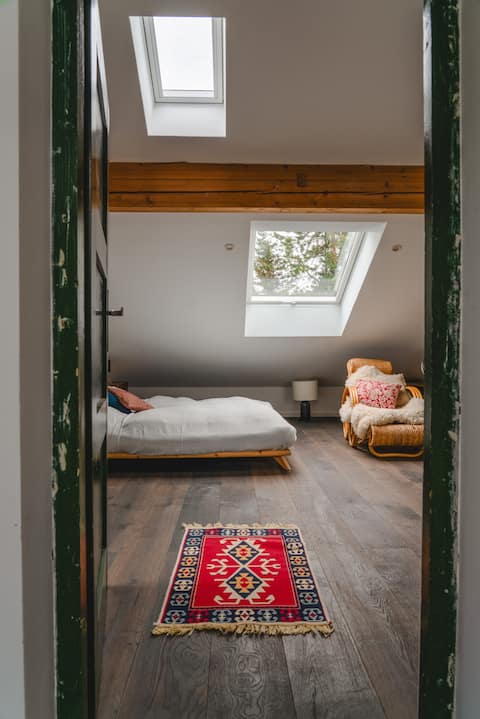
Rustic hideout near Munich
Entire Place • 1 bedroom
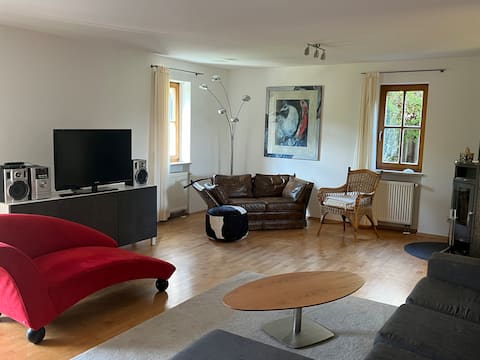
Lovely 2-room apartment with balcony / garden
Entire Place • 1 bedroom
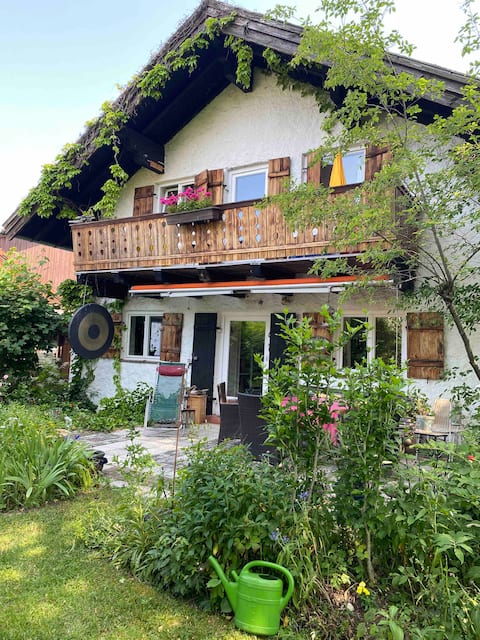
MUNICH! In the countryside/in the city: Alpine landscape
Entire Place • 1 bedroom
1-Zimmer-Apartment Oberhaching
Entire Place • 1 bedroom
Note: Performance varies based on location, size, amenities, seasonality, and management quality. Data reflects the past 12 months.
Top Performing Airbnb Hosts in Oberhaching (2026)
Learn from the best! This table showcases top-performing Airbnb hosts in Oberhaching based on the number of properties managed and estimated total revenue over the past year. Analyze their scale and performance metrics.
| Host Name | Properties | Grossing Revenue | Stay Reviews | Avg Rating |
|---|---|---|---|---|
| Madsen | 1 | $103,009 | 63 | 4.92/5.0 |
| Monika | 2 | $74,530 | 19 | 4.96/5.0 |
| Katharina | 4 | $65,322 | 1088 | 4.83/5.0 |
| Conie | 1 | $42,902 | 34 | 4.94/5.0 |
| Christine | 1 | $30,230 | 116 | 4.97/5.0 |
| Claudia | 1 | $29,499 | 129 | 4.85/5.0 |
| Marianne | 1 | $26,570 | 53 | 4.94/5.0 |
| Thomas Und Julia | 1 | $22,726 | 161 | 4.91/5.0 |
| Ann-Marie | 1 | $21,125 | 60 | 4.90/5.0 |
| Heike | 1 | $19,537 | 391 | 4.88/5.0 |
Analyzing the strategies of top hosts, such as their property selection, pricing, and guest communication, can offer valuable lessons for optimizing your own Airbnb operations in Oberhaching.
Dive Deeper: Advanced Oberhaching STR Market Data (2026)
Ready to unlock more insights? AirROI provides access to advanced metrics and comprehensive Airbnb data for Oberhaching. Explore detailed analytics beyond this report to refine your investment strategy, optimize pricing, and maximize your vacation rental profits.
Explore Advanced MetricsOberhaching Short-Term Rental Market Composition (2026): Property & Room Types
Room Type Distribution
Property Type Distribution
Market Composition Insights for Oberhaching
- The Oberhaching Airbnb market composition is heavily skewed towards Entire Home/Apt listings, which make up 84% of the 25 active rentals. This indicates strong guest preference for privacy and space.
- Looking at the property type distribution in Oberhaching, Apartment/Condo properties are the most common (64%), reflecting the local real estate landscape.
- Houses represent a significant 32% portion, catering likely to families or larger groups.
- Smaller segments like hotel/boutique (combined 4.0%) offer potential for unique stay experiences.
Oberhaching Airbnb Room Capacity Analysis (2026): Bedroom Distribution
Distribution of Listings by Number of Bedrooms
Room Capacity Insights for Oberhaching
- The dominant room capacity in Oberhaching is 1 bedroom listings, making up 60% of the market. This suggests a strong demand for properties suitable for couples or solo travelers.
- Together, 1 bedroom and 2 bedrooms properties represent 72.0% of the active Airbnb listings in Oberhaching, indicating a high concentration in these sizes.
- With over half the market (60%) consisting of studios or 1-bedroom units, Oberhaching is particularly well-suited for individuals or couples.
- Listings with 3+ bedrooms (8.0%) represent a smaller niche, potentially indicating an underserved market for larger group accommodations in Oberhaching.
Oberhaching Vacation Rental Guest Capacity Trends (2026)
Distribution of Listings by Guest Capacity
Guest Capacity Insights for Oberhaching
- The most common guest capacity trend in Oberhaching vacation rentals is listings accommodating 2 guests (40%). This suggests the primary traveler segment is likely couples or solo travelers.
- Properties designed for 2 guests and 4 guests dominate the Oberhaching STR market, accounting for 64.0% of listings.
- 12.0% of properties accommodate 6+ guests, serving the market segment for larger families or group travel in Oberhaching.
- On average, properties in Oberhaching are equipped to host 2.9 guests.
Oberhaching Airbnb Booking Patterns (2026): Available vs. Booked Days
Available Days Distribution
Booked Days Distribution
Booking Pattern Insights for Oberhaching
- The most common availability pattern in Oberhaching falls within the 91-180 days range, representing 36% of listings. This suggests many properties have significant open periods on their calendars.
- Approximately 52.0% of listings show high availability (181+ days open annually), indicating potential for increased bookings or specific owner usage patterns.
- For booked days, the 181-270 days range is most frequent in Oberhaching (36%), reflecting common guest stay durations or potential owner blocking patterns.
- A notable 48.0% of properties secure long booking periods (181+ days booked per year), highlighting successful long-term rental strategies or significant owner usage.
Oberhaching Airbnb Minimum Stay Requirements Analysis
Distribution of Listings by Minimum Night Requirement
1 Night
8 listings
32% of total
2 Nights
4 listings
16% of total
4-6 Nights
1 listings
4% of total
7-29 Nights
3 listings
12% of total
30+ Nights
9 listings
36% of total
Key Insights
- The most prevalent minimum stay requirement in Oberhaching is 30+ Nights, adopted by 36% of listings. This highlights the market's preference for longer commitments.
- A significant segment (36%) caters to monthly stays (30+ nights) in Oberhaching, pointing to opportunities in the extended-stay market.
Recommendations
- Align with the market by considering a 30+ Nights minimum stay, as 36% of Oberhaching hosts use this setting.
- Explore offering discounts for stays of 30+ nights to attract the 36% of the market seeking extended stays.
- Adjust minimum nights based on seasonality – potentially shorter during low season and longer during peak demand periods in Oberhaching.
Oberhaching Airbnb Cancellation Policy Trends Analysis (2026)
Limited
1 listings
4% of total
Flexible
3 listings
12% of total
Moderate
9 listings
36% of total
Firm
9 listings
36% of total
Strict
3 listings
12% of total
Cancellation Policy Insights for Oberhaching
- The prevailing Airbnb cancellation policy trend in Oberhaching is Moderate, used by 36% of listings.
- There's a relatively balanced mix between guest-friendly (48.0%) and stricter (48.0%) policies, offering choices for different guest needs.
Recommendations for Hosts
- Consider adopting a Moderate policy to align with the 36% market standard in Oberhaching.
- Using a Strict policy might deter some guests, as only 12% of listings use it. Evaluate if potential revenue protection outweighs possible lower booking rates.
- Regularly review your cancellation policy against competitors and market demand shifts in Oberhaching.
Oberhaching STR Booking Lead Time Analysis (2026)
Average Booking Lead Time by Month
Booking Lead Time Insights for Oberhaching
- The overall average booking lead time for vacation rentals in Oberhaching is 57 days.
- Guests book furthest in advance for stays during September (average 111 days), likely coinciding with peak travel demand or local events.
- The shortest booking windows occur for stays in March (average 17 days), indicating more last-minute travel plans during this time.
- Seasonally, Fall (79 days avg.) sees the longest lead times, while Winter (34 days avg.) has the shortest, reflecting typical travel planning cycles.
Recommendations for Hosts
- Use the overall average lead time (57 days) as a baseline for your pricing and availability strategy in Oberhaching.
- For September stays, consider implementing length-of-stay discounts or slightly higher rates for bookings made less than 111 days out to capitalize on advance planning.
- Target marketing efforts for the Fall season well in advance (at least 79 days) to capture early planners.
- Monitor your own booking lead times against these Oberhaching averages to identify opportunities for dynamic pricing adjustments.
Popular & Essential Airbnb Amenities in Oberhaching (2026)
Amenity Prevalence
Amenity Insights for Oberhaching
- Essential amenities in Oberhaching that guests expect include: Wifi, Heating. Lacking these (any) could significantly impact bookings.
- Popular amenities like Kitchen, Hot water, Hair dryer are common but not universal. Offering these can provide a competitive edge.
Recommendations for Hosts
- Ensure your listing includes all essential amenities for Oberhaching: Wifi, Heating.
- Consider adding popular differentiators like Kitchen or Hot water to increase appeal.
- Highlight unique or less common amenities you offer (e.g., hot tub, dedicated workspace, EV charger) in your listing description and photos.
- Regularly check competitor amenities in Oberhaching to stay competitive.
Oberhaching Airbnb Guest Demographics & Profile Analysis (2026)
Guest Profile Summary for Oberhaching
- The typical guest profile for Airbnb in Oberhaching consists of a mix of domestic (39%) and international guests, with top international origins including United States, typically belonging to the Post-2000s (Gen Z/Alpha) group (50%), primarily speaking English or German.
- Domestic travelers account for 38.7% of guests.
- Key international markets include Germany (38.7%) and United States (18.1%).
- Top languages spoken are English (39.9%) followed by German (23.6%).
- A significant demographic segment is the Post-2000s (Gen Z/Alpha) group, representing 50% of guests.
Recommendations for Hosts
- Focus marketing internationally, particularly towards travelers from United States.
- Tailor amenities and listing descriptions to appeal to the dominant Post-2000s (Gen Z/Alpha) demographic (e.g., highlight fast WiFi, smart home features, local guides).
- Highlight unique local experiences or amenities relevant to the primary guest profile.
- Consider seasonal promotions aligned with peak travel times for key origin markets.
Nearby Short-Term Rental Market Comparison
How does the Oberhaching Airbnb market stack up against its neighbors? Compare key performance metrics like average monthly revenue, ADR, and occupancy rates in surrounding areas to understand the broader regional STR landscape.
| Market | Active Properties | Monthly Revenue | Daily Rate | Avg. Occupancy |
|---|---|---|---|---|
| Scheffau am Wilden Kaiser | 12 | $6,669 | $906.83 | 30% |
| Balderschwang | 10 | $5,253 | $304.03 | 58% |
| Going am Wilden Kaiser | 27 | $3,596 | $406.50 | 37% |
| Kramsach | 12 | $3,573 | $272.32 | 48% |
| Bayrischzell | 41 | $3,550 | $389.91 | 33% |
| Krimml | 53 | $3,544 | $359.14 | 41% |
| Reith bei Kitzbühel | 49 | $3,385 | $356.25 | 34% |
| Stans | 12 | $3,115 | $255.48 | 43% |
| Pfafflar | 11 | $3,053 | $255.26 | 50% |
| Thaur | 12 | $2,954 | $152.36 | 69% |