Lindberg Airbnb Market Analysis 2026: Short Term Rental Data & Vacation Rental Statistics in Bavaria, Germany
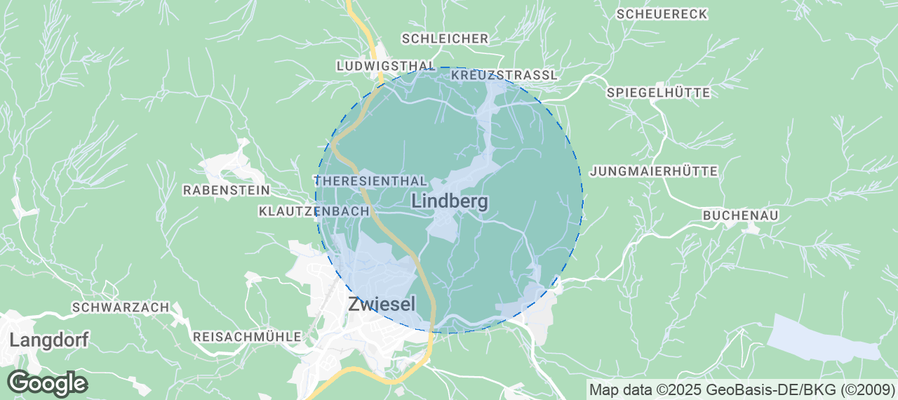
Is Airbnb profitable in Lindberg in 2026? Explore comprehensive Airbnb analytics for Lindberg, Bavaria, Germany to uncover income potential. This 2026 STR market report for Lindberg, based on AirROI data from February 2025 to January 2026, reveals key trends in the niche market of 19 active listings.
Whether you're considering an Airbnb investment in Lindberg, optimizing your existing vacation rental, or exploring rental arbitrage opportunities, understanding the Lindberg Airbnb data is crucial. Leveraging the low regulation environment is key to maximizing your short term rental income potential. Let's dive into the specifics.
Key Lindberg Airbnb Performance Metrics Overview
Monthly Airbnb Revenue Variations & Income Potential in Lindberg (2026)
Understanding the monthly revenue variations for Airbnb listings in Lindberg is key to maximizing your short term rental income potential. Seasonality significantly impacts earnings. Our analysis, based on data from the past 12 months, shows that the peak revenue month for STRs in Lindberg is typically August, while November often presents the lowest earnings, highlighting opportunities for strategic pricing adjustments during shoulder and low seasons. Explore the typical Airbnb income in Lindberg across different performance tiers:
- Best-in-class properties (Top 10%) achieve $2,347+ monthly, often utilizing dynamic pricing and superior guest experiences.
- Strong performing properties (Top 25%) earn $1,268 or more, indicating effective management and desirable locations/amenities.
- Typical properties (Median) generate around $628 per month, representing the average market performance.
- Entry-level properties (Bottom 25%) see earnings around $366, often with potential for optimization.
Average Monthly Airbnb Earnings Trend in Lindberg
Lindberg Airbnb Occupancy Rate Trends (2026)
Maximize your bookings by understanding the Lindberg STR occupancy trends. Seasonal demand shifts significantly influence how often properties are booked. Typically, Augustsees the highest demand (peak season occupancy), while November experiences the lowest (low season). Effective strategies, like adjusting minimum stays or offering promotions, can boost occupancy during slower periods. Here's how different property tiers perform in Lindberg:
- Best-in-class properties (Top 10%) achieve 66%+ occupancy, indicating high desirability and potentially optimized availability.
- Strong performing properties (Top 25%) maintain 41% or higher occupancy, suggesting good market fit and guest satisfaction.
- Typical properties (Median) have an occupancy rate around 26%.
- Entry-level properties (Bottom 25%) average 14% occupancy, potentially facing higher vacancy.
Average Monthly Occupancy Rate Trend in Lindberg
Average Daily Rate (ADR) Airbnb Trends in Lindberg (2026)
Effective short term rental pricing strategy in Lindberg involves understanding monthly ADR fluctuations. The Average Daily Rate (ADR) for Airbnb in Lindberg typically peaks in June and dips lowest during November. Leveraging Airbnb dynamic pricing tools or strategies based on this seasonality can significantly boost revenue. Here's a look at the typical nightly rates achieved:
- Best-in-class properties (Top 10%) command rates of $120+ per night, often due to premium features or locations.
- Strong performing properties (Top 25%) achieve nightly rates of $94 or more.
- Typical properties (Median) charge around $79 per night.
- Entry-level properties (Bottom 25%) earn around $63 per night.
Average Daily Rate (ADR) Trend by Month in Lindberg
Get Live Lindberg Market Intelligence 👇
Explore Real-time Analytics
Airbnb Seasonality Analysis & Trends in Lindberg (2026)
Peak Season (August, July, June)
- Revenue averages $1,363 per month
- Occupancy rates average 45.1%
- Daily rates average $93
Shoulder Season
- Revenue averages $881 per month
- Occupancy maintains around 30.4%
- Daily rates hold near $88
Low Season (January, March, November)
- Revenue drops to average $673 per month
- Occupancy decreases to average 20.5%
- Daily rates adjust to average $86
Seasonality Insights for Lindberg
- The Airbnb seasonality in Lindberg shows highly seasonal trends requiring careful strategy. While the sections above show seasonal averages, it's also insightful to look at the extremes:
- During the high season, the absolute peak month showcases Lindberg's highest earning potential, with monthly revenues capable of climbing to $1,698, occupancy reaching a high of 49.4%, and ADRs peaking at $94.
- Conversely, the slowest single month of the year, typically falling within the low season, marks the market's lowest point. In this month, revenue might dip to $587, occupancy could drop to 13.0%, and ADRs may adjust down to $84.
- Understanding both the seasonal averages and these monthly peaks and troughs in revenue, occupancy, and ADR is crucial for maximizing your Airbnb profit potential in Lindberg.
Seasonal Strategies for Maximizing Profit
- Peak Season: Maximize revenue through premium pricing and potentially longer minimum stays. Ensure high availability.
- Low Season: Offer competitive pricing, special promotions (e.g., extended stay discounts), and flexible cancellation policies. Target off-season travelers like remote workers or budget-conscious guests.
- Shoulder Seasons: Implement dynamic pricing that balances peak and low rates. Target weekend travelers or specific events. Offer slightly more flexible terms than peak season.
- Regularly analyze your own performance against these Lindberg seasonality benchmarks and adjust your pricing and availability strategy accordingly.
Best Areas for Airbnb Investment in Lindberg (2026)
Exploring the top neighborhoods for short-term rentals in Lindberg? This section highlights key areas, outlining why they are attractive for hosts and guests, along with notable local attractions. Consider these locations based on your target guest profile and investment strategy.
| Neighborhood / Area | Why Host Here? (Target Guests & Appeal) | Key Attractions & Landmarks |
|---|---|---|
| Lindberg Village | Charming village atmosphere with beautiful scenic views and a peaceful environment. Ideal for families and tourists seeking a quiet retreat in nature. | Lindberg Castle, Lindberg Forest, Bavarian Forest National Park, Zwenkauer Lake, local hiking trails |
| Bavarian Forest National Park | A UNESCO biosphere reserve known for its stunning landscapes and biodiversity. Popular with nature lovers, hikers, and eco-tourists. | Hiking Trails, Wildlife Watching, Moor Nature Trails, Bavarian Forest Museum, Geißkopf Mountain |
| Grafenau | A vibrant town near the national park, offering a mix of nature and culture. Great for guests looking for both relaxation and adventuring in the outdoors. | Grafenau Town Center, Bavarian Forest Museum, Ski Resort Geißkopf, Local Festivals, Cycle Paths |
| Zenting | A picturesque village surrounded by rolling hills and forests, known for its charming local culture and outdoor activities. Perfect for travelers wanting to explore Bavaria. | Zenting Village Church, Local Farm Tours, Nature Walks, Bicycle Touring, Seasonal Festivals |
| Bodenmais | A popular holiday destination with a rich history in glass-making and skiing. Attracts both winter sports enthusiasts and summer visitors. | Bodenmais Crystal World, Ski Resorts, Hiking Trails, Local Craft Shops, Nature Parks |
| Sankt Oswald-Riedlhütte | A secluded area perfect for those looking to escape the hustle and bustle and enjoy outdoor activities and nature. | Hiking Trails, Nearby Ski Areas, Charming Local Cuisine, Peaceful Retreats |
| Rachel Mountain | Offers breathtaking views and is a favorite for hiking and outdoor sports. Great for adventure seekers throughout the year. | Rachel Mountain Peak, Hiking Trails, Scenic Viewpoints, Nature Reserves, Photography Spots |
| Freyung | A delightful small town with a rich history and access to outdoor adventures in the surrounding forests and hills. | Freyung Town Center, Historic Buildings, Local Markets, Nature Walks, Annual Events |
Understanding Airbnb License Requirements & STR Laws in Lindberg (2026)
While Lindberg, Bavaria, Germany currently shows low STR regulations, specific Airbnb license requirements might still exist or change. Always verify the latest short term rental regulations and Airbnb license requirements directly with local government authorities for Lindberg to ensure full compliance before hosting.
(Source: AirROI data, 2026, finding no licensed listings among those analyzed)
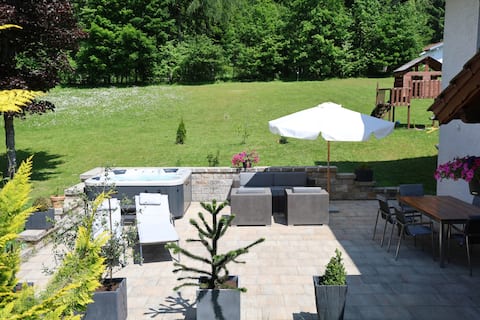
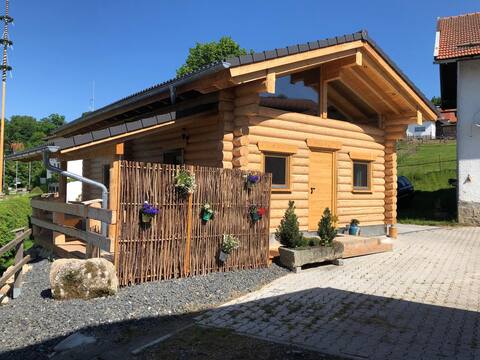
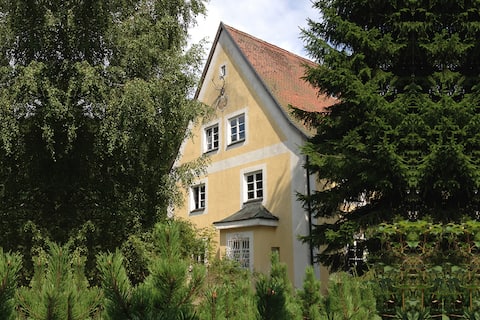
Top Performing Airbnb Properties in Lindberg (2026)
Benchmark your potential! Explore examples of top-performing Airbnb properties in Lindbergbased on Trailing Twelve Month (TTM) revenue. Analyze their characteristics, revenue, occupancy rate, and ADR to understand what drives success in this market.
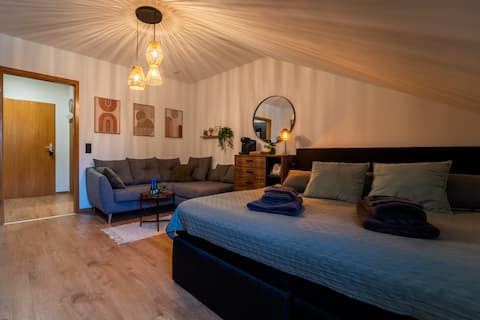
Exclusive apartment at Bayerwald National Park
Entire Place • 2 bedrooms
Chalet Zur Landfrau (Weiderer organic farm)
Private Room • 2 bedrooms
oz4
Entire Place • 1 bedroom
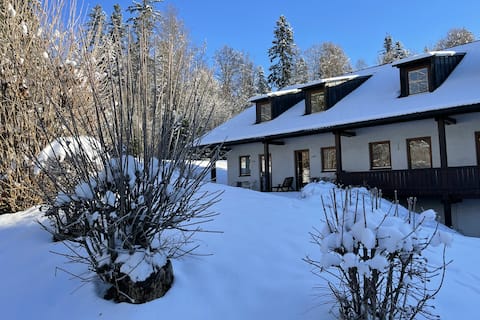
Hiking & sauna, relax in the national park
Entire Place • 1 bedroom
Quiet relaxation in the heart of nature
Entire Place • 1 bedroom
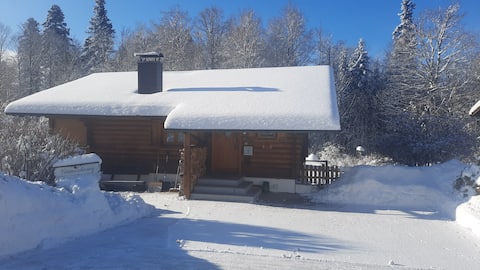
Hüttenzauber Log Cabin apartment in the middle of the national park
Entire Place • 1 bedroom
Note: Performance varies based on location, size, amenities, seasonality, and management quality. Data reflects the past 12 months.
Top Performing Airbnb Hosts in Lindberg (2026)
Learn from the best! This table showcases top-performing Airbnb hosts in Lindberg based on the number of properties managed and estimated total revenue over the past year. Analyze their scale and performance metrics.
| Host Name | Properties | Grossing Revenue | Stay Reviews | Avg Rating |
|---|---|---|---|---|
| Mona | 8 | $52,922 | 28 | 5.00/5.0 |
| Heinz | 5 | $25,937 | 206 | 4.93/5.0 |
| Michael | 1 | $25,612 | 67 | 4.90/5.0 |
| Tom | 1 | $23,391 | 120 | 5.00/5.0 |
| Kacper | 1 | $15,706 | 34 | 4.74/5.0 |
| Michaela A Jakub | 1 | $13,703 | 65 | 4.83/5.0 |
| Michael | 1 | $12,388 | 25 | 5.00/5.0 |
| Michael | 1 | $5,098 | 8 | 4.88/5.0 |
Analyzing the strategies of top hosts, such as their property selection, pricing, and guest communication, can offer valuable lessons for optimizing your own Airbnb operations in Lindberg.
Dive Deeper: Advanced Lindberg STR Market Data (2026)
Ready to unlock more insights? AirROI provides access to advanced metrics and comprehensive Airbnb data for Lindberg. Explore detailed analytics beyond this report to refine your investment strategy, optimize pricing, and maximize your vacation rental profits.
Explore Advanced MetricsLindberg Short-Term Rental Market Composition (2026): Property & Room Types
Room Type Distribution
Property Type Distribution
Market Composition Insights for Lindberg
- The Lindberg Airbnb market composition is heavily skewed towards Entire Home/Apt listings, which make up 89.5% of the 19 active rentals. This indicates strong guest preference for privacy and space.
- Looking at the property type distribution in Lindberg, Apartment/Condo properties are the most common (84.2%), reflecting the local real estate landscape.
- The presence of 10.5% Hotel/Boutique listings indicates integration with traditional hospitality.
Lindberg Airbnb Room Capacity Analysis (2026): Bedroom Distribution
Distribution of Listings by Number of Bedrooms
Room Capacity Insights for Lindberg
- The dominant room capacity in Lindberg is 1 bedroom listings, making up 73.7% of the market. This suggests a strong demand for properties suitable for couples or solo travelers.
- Together, 1 bedroom and 2 bedrooms properties represent 100.0% of the active Airbnb listings in Lindberg, indicating a high concentration in these sizes.
- With over half the market (73.7%) consisting of studios or 1-bedroom units, Lindberg is particularly well-suited for individuals or couples.
Lindberg Vacation Rental Guest Capacity Trends (2026)
Distribution of Listings by Guest Capacity
Guest Capacity Insights for Lindberg
- The most common guest capacity trend in Lindberg vacation rentals is listings accommodating 2 guests (36.8%). This suggests the primary traveler segment is likely couples or solo travelers.
- Properties designed for 2 guests and 4 guests dominate the Lindberg STR market, accounting for 73.6% of listings.
- On average, properties in Lindberg are equipped to host 3.5 guests.
Lindberg Airbnb Booking Patterns (2026): Available vs. Booked Days
Available Days Distribution
Booked Days Distribution
Booking Pattern Insights for Lindberg
- The most common availability pattern in Lindberg falls within the 271-366 days range, representing 68.4% of listings. This suggests many properties have significant open periods on their calendars.
- Approximately 89.5% of listings show high availability (181+ days open annually), indicating potential for increased bookings or specific owner usage patterns.
- For booked days, the 31-90 days range is most frequent in Lindberg (52.6%), reflecting common guest stay durations or potential owner blocking patterns.
- A notable 10.6% of properties secure long booking periods (181+ days booked per year), highlighting successful long-term rental strategies or significant owner usage.
Lindberg Airbnb Minimum Stay Requirements Analysis
Distribution of Listings by Minimum Night Requirement
1 Night
2 listings
10.5% of total
2 Nights
2 listings
10.5% of total
3 Nights
7 listings
36.8% of total
30+ Nights
8 listings
42.1% of total
Key Insights
- The most prevalent minimum stay requirement in Lindberg is 30+ Nights, adopted by 42.1% of listings. This highlights the market's preference for longer commitments.
- A significant segment (42.1%) caters to monthly stays (30+ nights) in Lindberg, pointing to opportunities in the extended-stay market.
Recommendations
- Align with the market by considering a 30+ Nights minimum stay, as 42.1% of Lindberg hosts use this setting.
- If feasible, allowing 1-night stays, especially midweek or during low season, could capture last-minute bookings, as only 10.5% currently do.
- Explore offering discounts for stays of 30+ nights to attract the 42.1% of the market seeking extended stays.
- Adjust minimum nights based on seasonality – potentially shorter during low season and longer during peak demand periods in Lindberg.
Lindberg Airbnb Cancellation Policy Trends Analysis (2026)
Super Strict 60 Days
1 listings
5.3% of total
Limited
6 listings
31.6% of total
Flexible
3 listings
15.8% of total
Moderate
2 listings
10.5% of total
Firm
6 listings
31.6% of total
Strict
1 listings
5.3% of total
Cancellation Policy Insights for Lindberg
- The prevailing Airbnb cancellation policy trend in Lindberg is Limited, used by 31.6% of listings.
- There's a relatively balanced mix between guest-friendly (26.3%) and stricter (36.9%) policies, offering choices for different guest needs.
- Strict cancellation policies are quite rare (5.3%), potentially making listings with this policy less competitive unless justified by high demand or property type.
Recommendations for Hosts
- Consider adopting a Limited policy to align with the 31.6% market standard in Lindberg.
- Using a Strict policy might deter some guests, as only 5.3% of listings use it. Evaluate if potential revenue protection outweighs possible lower booking rates.
- Regularly review your cancellation policy against competitors and market demand shifts in Lindberg.
Lindberg STR Booking Lead Time Analysis (2026)
Average Booking Lead Time by Month
Booking Lead Time Insights for Lindberg
- The overall average booking lead time for vacation rentals in Lindberg is 64 days.
- Guests book furthest in advance for stays during October (average 84 days), likely coinciding with peak travel demand or local events.
- The shortest booking windows occur for stays in November (average 11 days), indicating more last-minute travel plans during this time.
- Seasonally, Summer (69 days avg.) sees the longest lead times, while Spring (40 days avg.) has the shortest, reflecting typical travel planning cycles.
Recommendations for Hosts
- Use the overall average lead time (64 days) as a baseline for your pricing and availability strategy in Lindberg.
- For October stays, consider implementing length-of-stay discounts or slightly higher rates for bookings made less than 84 days out to capitalize on advance planning.
- During November, focus on last-minute booking availability and promotions, as guests book with very short notice (11 days avg.).
- Target marketing efforts for the Summer season well in advance (at least 69 days) to capture early planners.
- Monitor your own booking lead times against these Lindberg averages to identify opportunities for dynamic pricing adjustments.
Popular & Essential Airbnb Amenities in Lindberg (2026)
Amenity Prevalence
Amenity Insights for Lindberg
- Essential amenities in Lindberg that guests expect include: Smoke alarm, TV, Wifi, Heating. Lacking these (any) could significantly impact bookings.
- Popular amenities like Refrigerator, Kitchen, Free parking on premises are common but not universal. Offering these can provide a competitive edge.
Recommendations for Hosts
- Ensure your listing includes all essential amenities for Lindberg: Smoke alarm, TV, Wifi, Heating.
- Consider adding popular differentiators like Refrigerator or Kitchen to increase appeal.
- Highlight unique or less common amenities you offer (e.g., hot tub, dedicated workspace, EV charger) in your listing description and photos.
- Regularly check competitor amenities in Lindberg to stay competitive.
Lindberg Airbnb Guest Demographics & Profile Analysis (2026)
Guest Profile Summary for Lindberg
- The typical guest profile for Airbnb in Lindberg consists of primarily domestic travelers (86%), often arriving from nearby Munich, typically belonging to the Post-2000s (Gen Z/Alpha) group (50%), primarily speaking English or German.
- Domestic travelers account for 86.0% of guests.
- Key international markets include Germany (86%) and Netherlands (5.3%).
- Top languages spoken are English (37.1%) followed by German (32%).
- A significant demographic segment is the Post-2000s (Gen Z/Alpha) group, representing 50% of guests.
Recommendations for Hosts
- Target domestic marketing efforts towards travelers from Munich and Leipzig.
- Tailor amenities and listing descriptions to appeal to the dominant Post-2000s (Gen Z/Alpha) demographic (e.g., highlight fast WiFi, smart home features, local guides).
- Highlight unique local experiences or amenities relevant to the primary guest profile.
- Consider seasonal promotions aligned with peak travel times for key origin markets.
Nearby Short-Term Rental Market Comparison
How does the Lindberg Airbnb market stack up against its neighbors? Compare key performance metrics like average monthly revenue, ADR, and occupancy rates in surrounding areas to understand the broader regional STR landscape.
| Market | Active Properties | Monthly Revenue | Daily Rate | Avg. Occupancy |
|---|---|---|---|---|
| Kollnburg | 12 | $2,526 | $317.10 | 32% |
| Drachselsried | 19 | $2,357 | $280.55 | 29% |
| Capital City of Prague | 7,234 | $2,274 | $154.94 | 54% |
| Tisá | 11 | $2,213 | $183.06 | 39% |
| Jablonné v Podještědí | 17 | $2,187 | $208.35 | 38% |
| Praha 1 | 166 | $2,057 | $170.19 | 55% |
| Rathmannsdorf | 21 | $2,004 | $137.98 | 50% |
| Prague 2 | 65 | $1,974 | $162.14 | 58% |
| Praha 8 | 26 | $1,958 | $157.05 | 58% |
| Tuchoměřice | 17 | $1,938 | $151.99 | 46% |