Leipheim Airbnb Market Analysis 2026: Short Term Rental Data & Vacation Rental Statistics in Bavaria, Germany
Is Airbnb profitable in Leipheim in 2026? Explore comprehensive Airbnb analytics for Leipheim, Bavaria, Germany to uncover income potential. This 2026 STR market report for Leipheim, based on AirROI data from February 2025 to January 2026, reveals key trends in the niche market of 25 active listings.
Whether you're considering an Airbnb investment in Leipheim, optimizing your existing vacation rental, or exploring rental arbitrage opportunities, understanding the Leipheim Airbnb data is crucial. Leveraging the low regulation environment is key to maximizing your short term rental income potential. Let's dive into the specifics.
Key Leipheim Airbnb Performance Metrics Overview
Monthly Airbnb Revenue Variations & Income Potential in Leipheim (2026)
Understanding the monthly revenue variations for Airbnb listings in Leipheim is key to maximizing your short term rental income potential. Seasonality significantly impacts earnings. Our analysis, based on data from the past 12 months, shows that the peak revenue month for STRs in Leipheim is typically April, while January often presents the lowest earnings, highlighting opportunities for strategic pricing adjustments during shoulder and low seasons. Explore the typical Airbnb income in Leipheim across different performance tiers:
- Best-in-class properties (Top 10%) achieve $3,989+ monthly, often utilizing dynamic pricing and superior guest experiences.
- Strong performing properties (Top 25%) earn $2,299 or more, indicating effective management and desirable locations/amenities.
- Typical properties (Median) generate around $1,356 per month, representing the average market performance.
- Entry-level properties (Bottom 25%) see earnings around $697, often with potential for optimization.
Average Monthly Airbnb Earnings Trend in Leipheim
Leipheim Airbnb Occupancy Rate Trends (2026)
Maximize your bookings by understanding the Leipheim STR occupancy trends. Seasonal demand shifts significantly influence how often properties are booked. Typically, Julysees the highest demand (peak season occupancy), while January experiences the lowest (low season). Effective strategies, like adjusting minimum stays or offering promotions, can boost occupancy during slower periods. Here's how different property tiers perform in Leipheim:
- Best-in-class properties (Top 10%) achieve 67%+ occupancy, indicating high desirability and potentially optimized availability.
- Strong performing properties (Top 25%) maintain 51% or higher occupancy, suggesting good market fit and guest satisfaction.
- Typical properties (Median) have an occupancy rate around 33%.
- Entry-level properties (Bottom 25%) average 15% occupancy, potentially facing higher vacancy.
Average Monthly Occupancy Rate Trend in Leipheim
Average Daily Rate (ADR) Airbnb Trends in Leipheim (2026)
Effective short term rental pricing strategy in Leipheim involves understanding monthly ADR fluctuations. The Average Daily Rate (ADR) for Airbnb in Leipheim typically peaks in September and dips lowest during March. Leveraging Airbnb dynamic pricing tools or strategies based on this seasonality can significantly boost revenue. Here's a look at the typical nightly rates achieved:
- Best-in-class properties (Top 10%) command rates of $242+ per night, often due to premium features or locations.
- Strong performing properties (Top 25%) achieve nightly rates of $214 or more.
- Typical properties (Median) charge around $155 per night.
- Entry-level properties (Bottom 25%) earn around $109 per night.
Average Daily Rate (ADR) Trend by Month in Leipheim
Get Live Leipheim Market Intelligence 👇

Explore Real-time Analytics
Airbnb Seasonality Analysis & Trends in Leipheim (2026)
Peak Season (April, July, August)
- Revenue averages $2,563 per month
- Occupancy rates average 51.9%
- Daily rates average $170
Shoulder Season
- Revenue averages $1,689 per month
- Occupancy maintains around 34.0%
- Daily rates hold near $165
Low Season (January, March, December)
- Revenue drops to average $1,166 per month
- Occupancy decreases to average 22.0%
- Daily rates adjust to average $157
Seasonality Insights for Leipheim
- The Airbnb seasonality in Leipheim shows highly seasonal trends requiring careful strategy. While the sections above show seasonal averages, it's also insightful to look at the extremes:
- During the high season, the absolute peak month showcases Leipheim's highest earning potential, with monthly revenues capable of climbing to $2,680, occupancy reaching a high of 53.0%, and ADRs peaking at $178.
- Conversely, the slowest single month of the year, typically falling within the low season, marks the market's lowest point. In this month, revenue might dip to $866, occupancy could drop to 15.2%, and ADRs may adjust down to $148.
- Understanding both the seasonal averages and these monthly peaks and troughs in revenue, occupancy, and ADR is crucial for maximizing your Airbnb profit potential in Leipheim.
Seasonal Strategies for Maximizing Profit
- Peak Season: Maximize revenue through premium pricing and potentially longer minimum stays. Ensure high availability.
- Low Season: Offer competitive pricing, special promotions (e.g., extended stay discounts), and flexible cancellation policies. Target off-season travelers like remote workers or budget-conscious guests.
- Shoulder Seasons: Implement dynamic pricing that balances peak and low rates. Target weekend travelers or specific events. Offer slightly more flexible terms than peak season.
- Regularly analyze your own performance against these Leipheim seasonality benchmarks and adjust your pricing and availability strategy accordingly.
Best Areas for Airbnb Investment in Leipheim (2026)
Exploring the top neighborhoods for short-term rentals in Leipheim? This section highlights key areas, outlining why they are attractive for hosts and guests, along with notable local attractions. Consider these locations based on your target guest profile and investment strategy.
| Neighborhood / Area | Why Host Here? (Target Guests & Appeal) | Key Attractions & Landmarks |
|---|---|---|
| Leipheim Historic Town Center | Charming area with historical architecture and local culture, perfect for tourists interested in history and local eateries. | St. Joseph's Church, Leipheim Castle, Local markets, City parks, Historical walking tours |
| Rebhügel Park | A picturesque park area ideal for families and nature lovers, attracting tourists who seek outdoor activities and relaxation. | Nature trails, Picnic areas, Playgrounds, Scenic views, Bird watching |
| Bavarian Swabia Region | Known for its beautiful landscapes and quaint Bavarian villages, appealing to guests interested in rural tourism and scenic drives. | Traditional Bavarian festivals, Local breweries, Scenic routes, Hiking trails, Cultural heritage sites |
| Shopping Center Leipheim | Convenient area for travelers looking for shopping and dining options, close to the main highways for easy access. | Shopping malls, Restaurants, Cafés, Entertainment facilities, Event spaces |
| Leipheim Business District | Ideal for business travelers due to its proximity to offices and conference centers, making it popular with corporate clients. | Business amenities, Conference centers, Office services, Local eateries, Networking events |
| Fuggerstadt Augsburg | Nearby Augsburg is known for its rich history and attractions, drawing tourists who wish to explore beyond Leipheim. | Augsburg Cathedral, Fugger Family Palace, Augsburg Zoo, Botanical Garden, Local theatres |
| Local Vineyards | Region famous for its wine production, attracting wine enthusiasts and tourists seeking unique culinary experiences. | Winery tours, Wine tasting events, Culinary festivals, Vineyard walks, Local gastronomy |
| Leipheim Aquatic Center | Great for families and kids, this area focuses on recreational activities and leisure, attracting those looking for a fun getaway. | Swimming pools, Water slides, Family-friendly activities, Fitness classes, Community events |
Understanding Airbnb License Requirements & STR Laws in Leipheim (2026)
While Leipheim, Bavaria, Germany currently shows low STR regulations, specific Airbnb license requirements might still exist or change. Always verify the latest short term rental regulations and Airbnb license requirements directly with local government authorities for Leipheim to ensure full compliance before hosting.
(Source: AirROI data, 2026, finding no licensed listings among those analyzed)
Top Performing Airbnb Properties in Leipheim (2026)
Benchmark your potential! Explore examples of top-performing Airbnb properties in Leipheimbased on Trailing Twelve Month (TTM) revenue. Analyze their characteristics, revenue, occupancy rate, and ADR to understand what drives success in this market.
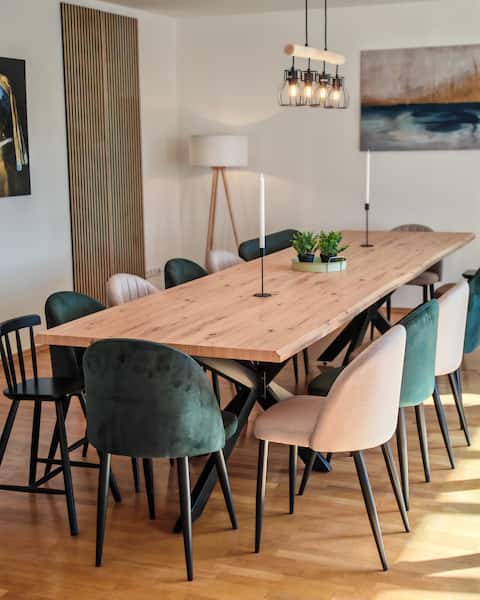
The Familien-Nest by ALA-Living Legoland in 8min
Entire Place • 5 bedrooms

4-h3rOeS
Entire Place • 2 bedrooms

Vacation home near Legoland
Entire Place • 4 bedrooms
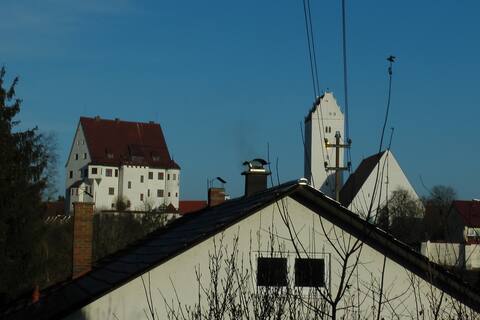
Large apartment with castle view/Legoland/A8/A7
Entire Place • 4 bedrooms
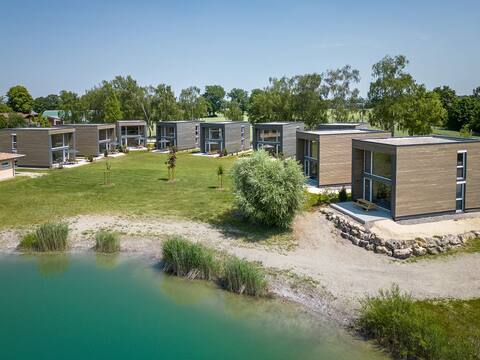
Chalet am Sonnensee 9 (vacation village by Lake Sonnensee)
Entire Place • 2 bedrooms
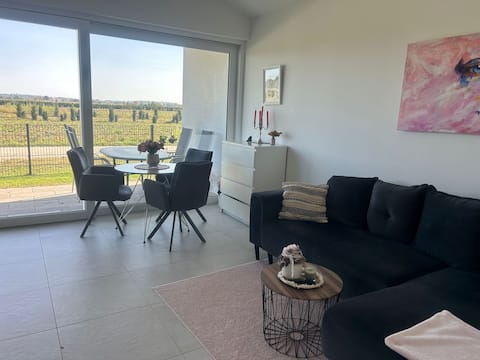
Apartment with garden near Legoland
Entire Place • 1 bedroom
Note: Performance varies based on location, size, amenities, seasonality, and management quality. Data reflects the past 12 months.
Top Performing Airbnb Hosts in Leipheim (2026)
Learn from the best! This table showcases top-performing Airbnb hosts in Leipheim based on the number of properties managed and estimated total revenue over the past year. Analyze their scale and performance metrics.
| Host Name | Properties | Grossing Revenue | Stay Reviews | Avg Rating |
|---|---|---|---|---|
| Nadine | 10 | $107,523 | 25 | 4.95/5.0 |
| Daniel | 3 | $79,757 | 40 | 4.86/5.0 |
| Anna Von ALA LIVING | 1 | $48,050 | 10 | 4.40/5.0 |
| Karin | 1 | $27,048 | 73 | 4.73/5.0 |
| Yvonne | 1 | $22,619 | 75 | 4.97/5.0 |
| Irina | 2 | $16,332 | 40 | 4.95/5.0 |
| Gabi | 2 | $15,784 | 159 | 4.95/5.0 |
| Laura | 1 | $13,953 | 136 | 4.82/5.0 |
| Nebi | 1 | $10,079 | 93 | 4.47/5.0 |
| Annalisa | 1 | $9,452 | 560 | 4.87/5.0 |
Analyzing the strategies of top hosts, such as their property selection, pricing, and guest communication, can offer valuable lessons for optimizing your own Airbnb operations in Leipheim.
Dive Deeper: Advanced Leipheim STR Market Data (2026)
Ready to unlock more insights? AirROI provides access to advanced metrics and comprehensive Airbnb data for Leipheim. Explore detailed analytics beyond this report to refine your investment strategy, optimize pricing, and maximize your vacation rental profits.
Explore Advanced MetricsLeipheim Short-Term Rental Market Composition (2026): Property & Room Types
Room Type Distribution
Property Type Distribution
Market Composition Insights for Leipheim
- The Leipheim Airbnb market composition is heavily skewed towards Entire Home/Apt listings, which make up 92% of the 25 active rentals. This indicates strong guest preference for privacy and space.
- Looking at the property type distribution in Leipheim, Apartment/Condo properties are the most common (44%), reflecting the local real estate landscape.
- The presence of 40% Hotel/Boutique listings indicates integration with traditional hospitality.
Leipheim Airbnb Room Capacity Analysis (2026): Bedroom Distribution
Distribution of Listings by Number of Bedrooms
Room Capacity Insights for Leipheim
- The dominant room capacity in Leipheim is 2 bedrooms listings, making up 52% of the market. This suggests a strong demand for properties suitable for couples or solo travelers.
- Together, 2 bedrooms and 1 bedroom properties represent 72.0% of the active Airbnb listings in Leipheim, indicating a high concentration in these sizes.
Leipheim Vacation Rental Guest Capacity Trends (2026)
Distribution of Listings by Guest Capacity
Guest Capacity Insights for Leipheim
- The most common guest capacity trend in Leipheim vacation rentals is listings accommodating 4 guests (44%). This suggests the primary traveler segment is likely small families or groups.
- Properties designed for 4 guests and 5 guests dominate the Leipheim STR market, accounting for 72.0% of listings.
- 24.0% of properties accommodate 6+ guests, serving the market segment for larger families or group travel in Leipheim.
- On average, properties in Leipheim are equipped to host 4.8 guests.
Leipheim Airbnb Booking Patterns (2026): Available vs. Booked Days
Available Days Distribution
Booked Days Distribution
Booking Pattern Insights for Leipheim
- The most common availability pattern in Leipheim falls within the 271-366 days range, representing 64% of listings. This suggests many properties have significant open periods on their calendars.
- Approximately 88.0% of listings show high availability (181+ days open annually), indicating potential for increased bookings or specific owner usage patterns.
- For booked days, the 31-90 days range is most frequent in Leipheim (36%), reflecting common guest stay durations or potential owner blocking patterns.
- A notable 12.0% of properties secure long booking periods (181+ days booked per year), highlighting successful long-term rental strategies or significant owner usage.
Leipheim Airbnb Minimum Stay Requirements Analysis
Distribution of Listings by Minimum Night Requirement
1 Night
3 listings
12% of total
2 Nights
5 listings
20% of total
3 Nights
1 listings
4% of total
4-6 Nights
2 listings
8% of total
30+ Nights
14 listings
56% of total
Key Insights
- The most prevalent minimum stay requirement in Leipheim is 30+ Nights, adopted by 56% of listings. This highlights the market's preference for longer commitments.
- A significant segment (56%) caters to monthly stays (30+ nights) in Leipheim, pointing to opportunities in the extended-stay market.
Recommendations
- Align with the market by considering a 30+ Nights minimum stay, as 56% of Leipheim hosts use this setting.
- If feasible, allowing 1-night stays, especially midweek or during low season, could capture last-minute bookings, as only 12% currently do.
- Explore offering discounts for stays of 30+ nights to attract the 56% of the market seeking extended stays.
- Adjust minimum nights based on seasonality – potentially shorter during low season and longer during peak demand periods in Leipheim.
Leipheim Airbnb Cancellation Policy Trends Analysis (2026)
Super Strict 60 Days
8 listings
32% of total
Limited
1 listings
4% of total
Flexible
8 listings
32% of total
Moderate
5 listings
20% of total
Firm
2 listings
8% of total
Strict
1 listings
4% of total
Cancellation Policy Insights for Leipheim
- The prevailing Airbnb cancellation policy trend in Leipheim is Super Strict 60 Days, used by 32% of listings.
- There's a relatively balanced mix between guest-friendly (52.0%) and stricter (12.0%) policies, offering choices for different guest needs.
- Strict cancellation policies are quite rare (4%), potentially making listings with this policy less competitive unless justified by high demand or property type.
Recommendations for Hosts
- Consider adopting a Super Strict 60 Days policy to align with the 32% market standard in Leipheim.
- Using a Strict policy might deter some guests, as only 4% of listings use it. Evaluate if potential revenue protection outweighs possible lower booking rates.
- Regularly review your cancellation policy against competitors and market demand shifts in Leipheim.
Leipheim STR Booking Lead Time Analysis (2026)
Average Booking Lead Time by Month
Booking Lead Time Insights for Leipheim
- The overall average booking lead time for vacation rentals in Leipheim is 66 days.
- Guests book furthest in advance for stays during November (average 112 days), likely coinciding with peak travel demand or local events.
- The shortest booking windows occur for stays in March (average 10 days), indicating more last-minute travel plans during this time.
- Seasonally, Summer (85 days avg.) sees the longest lead times, while Winter (45 days avg.) has the shortest, reflecting typical travel planning cycles.
Recommendations for Hosts
- Use the overall average lead time (66 days) as a baseline for your pricing and availability strategy in Leipheim.
- For November stays, consider implementing length-of-stay discounts or slightly higher rates for bookings made less than 112 days out to capitalize on advance planning.
- During March, focus on last-minute booking availability and promotions, as guests book with very short notice (10 days avg.).
- Target marketing efforts for the Summer season well in advance (at least 85 days) to capture early planners.
- Monitor your own booking lead times against these Leipheim averages to identify opportunities for dynamic pricing adjustments.
Popular & Essential Airbnb Amenities in Leipheim (2026)
Amenity Prevalence
Amenity Insights for Leipheim
- Essential amenities in Leipheim that guests expect include: Wifi, Heating, TV, Kitchen, Free parking on premises, Smoke alarm, Essentials, Refrigerator. Lacking these (any) could significantly impact bookings.
- Popular amenities like Dishes and silverware, Coffee maker are common but not universal. Offering these can provide a competitive edge.
Recommendations for Hosts
- Ensure your listing includes all essential amenities for Leipheim: Wifi, Heating, TV, Kitchen, Free parking on premises, Smoke alarm, Essentials, Refrigerator.
- Prioritize adding missing essentials: Kitchen, Free parking on premises, Smoke alarm, Essentials, Refrigerator.
- Consider adding popular differentiators like Dishes and silverware or Coffee maker to increase appeal.
- Highlight unique or less common amenities you offer (e.g., hot tub, dedicated workspace, EV charger) in your listing description and photos.
- Regularly check competitor amenities in Leipheim to stay competitive.
Leipheim Airbnb Guest Demographics & Profile Analysis (2026)
Guest Profile Summary for Leipheim
- The typical guest profile for Airbnb in Leipheim consists of a mix of domestic (52%) and international guests, often arriving from nearby Zürich, typically belonging to the Post-2000s (Gen Z/Alpha) group (50%), primarily speaking English or German.
- Domestic travelers account for 51.7% of guests.
- Key international markets include Germany (51.7%) and Switzerland (11.2%).
- Top languages spoken are English (33.3%) followed by German (28.5%).
- A significant demographic segment is the Post-2000s (Gen Z/Alpha) group, representing 50% of guests.
Recommendations for Hosts
- Balance marketing efforts between domestic and international channels based on the guest mix.
- Tailor amenities and listing descriptions to appeal to the dominant Post-2000s (Gen Z/Alpha) demographic (e.g., highlight fast WiFi, smart home features, local guides).
- Highlight unique local experiences or amenities relevant to the primary guest profile.
- Consider seasonal promotions aligned with peak travel times for key origin markets.
Nearby Short-Term Rental Market Comparison
How does the Leipheim Airbnb market stack up against its neighbors? Compare key performance metrics like average monthly revenue, ADR, and occupancy rates in surrounding areas to understand the broader regional STR landscape.
| Market | Active Properties | Monthly Revenue | Daily Rate | Avg. Occupancy |
|---|---|---|---|---|
| Balderschwang | 10 | $5,253 | $304.03 | 58% |
| Bürserberg | 45 | $3,783 | $331.48 | 40% |
| Brand | 63 | $3,714 | $522.47 | 31% |
| Kramsach | 12 | $3,573 | $272.32 | 48% |
| Kusterdingen | 10 | $3,119 | $229.94 | 43% |
| Stans | 12 | $3,115 | $255.48 | 43% |
| Pfafflar | 11 | $3,053 | $255.26 | 50% |
| Thaur | 12 | $2,954 | $152.36 | 69% |
| Scharnitz | 52 | $2,952 | $329.93 | 36% |
| Poing | 16 | $2,939 | $162.94 | 57% |