Kulmbach Airbnb Market Analysis 2026: Short Term Rental Data & Vacation Rental Statistics in Bavaria, Germany
Is Airbnb profitable in Kulmbach in 2026? Explore comprehensive Airbnb analytics for Kulmbach, Bavaria, Germany to uncover income potential. This 2026 STR market report for Kulmbach, based on AirROI data from February 2025 to January 2026, reveals key trends in the niche market of 42 active listings.
Whether you're considering an Airbnb investment in Kulmbach, optimizing your existing vacation rental, or exploring rental arbitrage opportunities, understanding the Kulmbach Airbnb data is crucial. Leveraging the low regulation environment is key to maximizing your short term rental income potential. Let's dive into the specifics.
Key Kulmbach Airbnb Performance Metrics Overview
Monthly Airbnb Revenue Variations & Income Potential in Kulmbach (2026)
Understanding the monthly revenue variations for Airbnb listings in Kulmbach is key to maximizing your short term rental income potential. Seasonality significantly impacts earnings. Our analysis, based on data from the past 12 months, shows that the peak revenue month for STRs in Kulmbach is typically December, while January often presents the lowest earnings, highlighting opportunities for strategic pricing adjustments during shoulder and low seasons. Explore the typical Airbnb income in Kulmbach across different performance tiers:
- Best-in-class properties (Top 10%) achieve $2,733+ monthly, often utilizing dynamic pricing and superior guest experiences.
- Strong performing properties (Top 25%) earn $1,659 or more, indicating effective management and desirable locations/amenities.
- Typical properties (Median) generate around $1,042 per month, representing the average market performance.
- Entry-level properties (Bottom 25%) see earnings around $435, often with potential for optimization.
Average Monthly Airbnb Earnings Trend in Kulmbach
Kulmbach Airbnb Occupancy Rate Trends (2026)
Maximize your bookings by understanding the Kulmbach STR occupancy trends. Seasonal demand shifts significantly influence how often properties are booked. Typically, Julysees the highest demand (peak season occupancy), while January experiences the lowest (low season). Effective strategies, like adjusting minimum stays or offering promotions, can boost occupancy during slower periods. Here's how different property tiers perform in Kulmbach:
- Best-in-class properties (Top 10%) achieve 77%+ occupancy, indicating high desirability and potentially optimized availability.
- Strong performing properties (Top 25%) maintain 55% or higher occupancy, suggesting good market fit and guest satisfaction.
- Typical properties (Median) have an occupancy rate around 34%.
- Entry-level properties (Bottom 25%) average 17% occupancy, potentially facing higher vacancy.
Average Monthly Occupancy Rate Trend in Kulmbach
Average Daily Rate (ADR) Airbnb Trends in Kulmbach (2026)
Effective short term rental pricing strategy in Kulmbach involves understanding monthly ADR fluctuations. The Average Daily Rate (ADR) for Airbnb in Kulmbach typically peaks in December and dips lowest during April. Leveraging Airbnb dynamic pricing tools or strategies based on this seasonality can significantly boost revenue. Here's a look at the typical nightly rates achieved:
- Best-in-class properties (Top 10%) command rates of $169+ per night, often due to premium features or locations.
- Strong performing properties (Top 25%) achieve nightly rates of $126 or more.
- Typical properties (Median) charge around $87 per night.
- Entry-level properties (Bottom 25%) earn around $49 per night.
Average Daily Rate (ADR) Trend by Month in Kulmbach
Get Live Kulmbach Market Intelligence 👇

Explore Real-time Analytics
Airbnb Seasonality Analysis & Trends in Kulmbach (2026)
Peak Season (December, October, August)
- Revenue averages $1,478 per month
- Occupancy rates average 37.0%
- Daily rates average $109
Shoulder Season
- Revenue averages $1,309 per month
- Occupancy maintains around 41.2%
- Daily rates hold near $96
Low Season (January, February, March)
- Revenue drops to average $912 per month
- Occupancy decreases to average 34.0%
- Daily rates adjust to average $86
Seasonality Insights for Kulmbach
- The Airbnb seasonality in Kulmbach shows moderate seasonality with distinct peak and low periods. While the sections above show seasonal averages, it's also insightful to look at the extremes:
- During the high season, the absolute peak month showcases Kulmbach's highest earning potential, with monthly revenues capable of climbing to $1,492, occupancy reaching a high of 43.6%, and ADRs peaking at $110.
- Conversely, the slowest single month of the year, typically falling within the low season, marks the market's lowest point. In this month, revenue might dip to $711, occupancy could drop to 24.1%, and ADRs may adjust down to $78.
- Understanding both the seasonal averages and these monthly peaks and troughs in revenue, occupancy, and ADR is crucial for maximizing your Airbnb profit potential in Kulmbach.
Seasonal Strategies for Maximizing Profit
- Peak Season: Maximize revenue through premium pricing and potentially longer minimum stays. Ensure high availability.
- Low Season: Offer competitive pricing, special promotions (e.g., extended stay discounts), and flexible cancellation policies. Target off-season travelers like remote workers or budget-conscious guests.
- Shoulder Seasons: Implement dynamic pricing that balances peak and low rates. Target weekend travelers or specific events. Offer slightly more flexible terms than peak season.
- Regularly analyze your own performance against these Kulmbach seasonality benchmarks and adjust your pricing and availability strategy accordingly.
Best Areas for Airbnb Investment in Kulmbach (2026)
Exploring the top neighborhoods for short-term rentals in Kulmbach? This section highlights key areas, outlining why they are attractive for hosts and guests, along with notable local attractions. Consider these locations based on your target guest profile and investment strategy.
| Neighborhood / Area | Why Host Here? (Target Guests & Appeal) | Key Attractions & Landmarks |
|---|---|---|
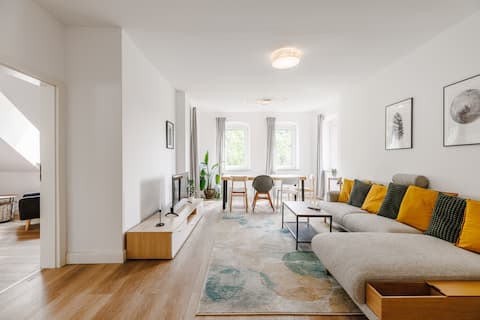
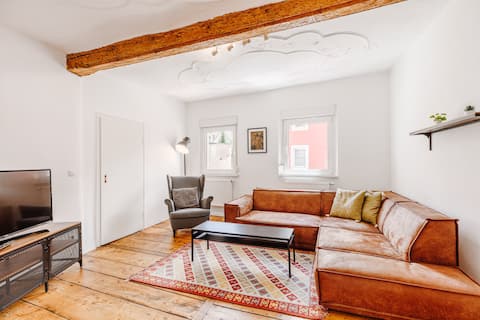
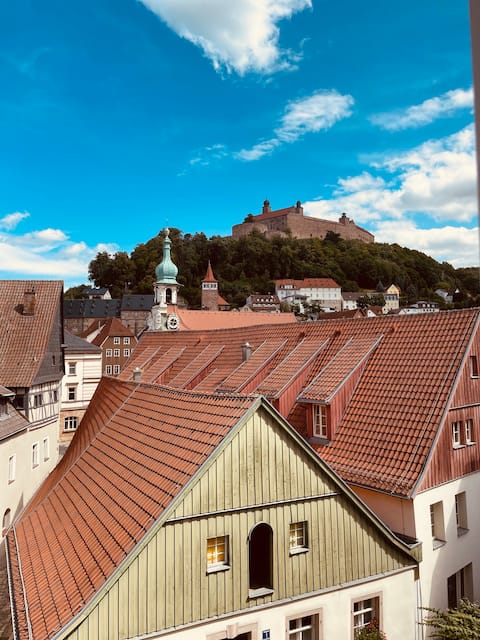
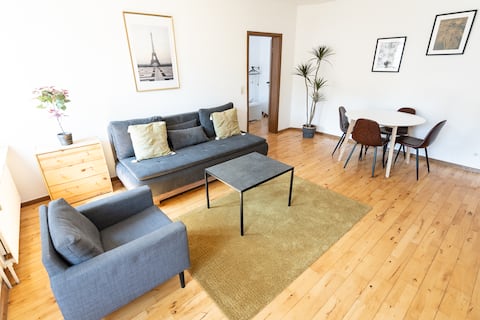
| Old Town Kulmbach | Historic center of Kulmbach with charming medieval architecture and rich history. Attracts tourists for its cultural experiences and beautiful surroundings. | Plassenburg Castle, St. John’s Church, Kulmbach Brewery, Old Market Square, Museum of the German Beer |
| Pond area (Teichgebiet) | A scenic area with ponds and nature trails, perfect for families and nature lovers. Provides a peaceful escape from the city. | Lake Weiher, Nature trails, Picnic areas, Bird watching, Nearby parks |
| Kaiserstraße | Main street of Kulmbach filled with shops, cafes, and local eateries. Popular with visitors looking for dining and shopping experiences. | Local shops, Cafes, Restaurants, Markets, Cultural events |
| Castle Hill | A hillside area offering stunning views of the city and countryside, ideal for outdoor enthusiasts and romantic getaway seekers. | Viewpoints, Hiking trails, Picnic spots, Nearby historic sites |
| Stadion area | Close to the local sports stadium, attracting sports fans during events. Convenient for short-term stays during game days. | Sports events, Local dining, Easy transport to the city |
| Cultural Quarter | Area known for theaters, art galleries, and cultural events. Suitable for tourists interested in arts and entertainment. | Local theaters, Art exhibitions, Music festivals, Workshops |
| Kulmbach vineyards | Grapevine areas around Kulmbach offer wine tasting and tours, attracting wine enthusiasts and those looking for a relaxing experience. | Wine tours, Tasting rooms, Grape harvesting, Scenic views |
| Family-friendly radius | Residences suitable for families with children, near schools and playgrounds, making it ideal for longer-term stays. | Schools, Playgrounds, Family parks, Community events |
Understanding Airbnb License Requirements & STR Laws in Kulmbach (2026)
While Kulmbach, Bavaria, Germany currently shows low STR regulations, specific Airbnb license requirements might still exist or change. Always verify the latest short term rental regulations and Airbnb license requirements directly with local government authorities for Kulmbach to ensure full compliance before hosting.
(Source: AirROI data, 2026, finding no licensed listings among those analyzed)
Top Performing Airbnb Properties in Kulmbach (2026)
Benchmark your potential! Explore examples of top-performing Airbnb properties in Kulmbachbased on Trailing Twelve Month (TTM) revenue. Analyze their characteristics, revenue, occupancy rate, and ADR to understand what drives success in this market.
Fantastic apartment with bathtub
Entire Place • 4 bedrooms
Tower View House Apartment
Entire Place • 4 bedrooms

Sunny flat in Villa near castle and city center -
Entire Place • 3 bedrooms
Old Town Center Apartments - 4 Bedrooms
Entire Place • 4 bedrooms
Charming old building with bathtub
Entire Place • 1 bedroom

Brewer’s Rest 2
Entire Place • 1 bedroom
Note: Performance varies based on location, size, amenities, seasonality, and management quality. Data reflects the past 12 months.
Top Performing Airbnb Hosts in Kulmbach (2026)
Learn from the best! This table showcases top-performing Airbnb hosts in Kulmbach based on the number of properties managed and estimated total revenue over the past year. Analyze their scale and performance metrics.
| Host Name | Properties | Grossing Revenue | Stay Reviews | Avg Rating |
|---|---|---|---|---|
| Alexandre | 10 | $235,825 | 361 | 4.55/5.0 |
| Uwe | 1 | $19,910 | 30 | 4.93/5.0 |
| Christopher | 1 | $19,530 | 22 | 4.95/5.0 |
| Stefan | 2 | $17,925 | 6 | 5.00/5.0 |
| Röhringer Immobilien | 2 | $17,742 | 4 | Not Rated |
| Viktoria | 1 | $17,657 | 4 | 5.00/5.0 |
| Martin | 1 | $14,425 | 20 | 4.90/5.0 |
| Nina | 1 | $13,547 | 35 | 4.91/5.0 |
| Thomas | 1 | $12,785 | 147 | 4.95/5.0 |
| Jan | 1 | $12,145 | 85 | 4.96/5.0 |
Analyzing the strategies of top hosts, such as their property selection, pricing, and guest communication, can offer valuable lessons for optimizing your own Airbnb operations in Kulmbach.
Dive Deeper: Advanced Kulmbach STR Market Data (2026)
Ready to unlock more insights? AirROI provides access to advanced metrics and comprehensive Airbnb data for Kulmbach. Explore detailed analytics beyond this report to refine your investment strategy, optimize pricing, and maximize your vacation rental profits.
Explore Advanced MetricsKulmbach Short-Term Rental Market Composition (2026): Property & Room Types
Room Type Distribution
Property Type Distribution
Market Composition Insights for Kulmbach
- The Kulmbach Airbnb market composition is heavily skewed towards Entire Home/Apt listings, which make up 81% of the 42 active rentals. This indicates strong guest preference for privacy and space.
- Looking at the property type distribution in Kulmbach, Apartment/Condo properties are the most common (76.2%), reflecting the local real estate landscape.
- Houses represent a significant 16.7% portion, catering likely to families or larger groups.
- Smaller segments like unique stays, others (combined 7.2%) offer potential for unique stay experiences.
Kulmbach Airbnb Room Capacity Analysis (2026): Bedroom Distribution
Distribution of Listings by Number of Bedrooms
Room Capacity Insights for Kulmbach
- The dominant room capacity in Kulmbach is 1 bedroom listings, making up 42.9% of the market. This suggests a strong demand for properties suitable for couples or solo travelers.
- Together, 1 bedroom and 2 bedrooms properties represent 59.6% of the active Airbnb listings in Kulmbach, indicating a high concentration in these sizes.
Kulmbach Vacation Rental Guest Capacity Trends (2026)
Distribution of Listings by Guest Capacity
Guest Capacity Insights for Kulmbach
- The most common guest capacity trend in Kulmbach vacation rentals is listings accommodating 2 guests (26.2%). This suggests the primary traveler segment is likely couples or solo travelers.
- Properties designed for 2 guests and 8+ guests dominate the Kulmbach STR market, accounting for 40.5% of listings.
- 21.4% of properties accommodate 6+ guests, serving the market segment for larger families or group travel in Kulmbach.
- On average, properties in Kulmbach are equipped to host 3.4 guests.
Kulmbach Airbnb Booking Patterns (2026): Available vs. Booked Days
Available Days Distribution
Booked Days Distribution
Booking Pattern Insights for Kulmbach
- The most common availability pattern in Kulmbach falls within the 271-366 days range, representing 42.9% of listings. This suggests many properties have significant open periods on their calendars.
- Approximately 78.6% of listings show high availability (181+ days open annually), indicating potential for increased bookings or specific owner usage patterns.
- For booked days, the 91-180 days range is most frequent in Kulmbach (33.3%), reflecting common guest stay durations or potential owner blocking patterns.
- A notable 23.8% of properties secure long booking periods (181+ days booked per year), highlighting successful long-term rental strategies or significant owner usage.
Kulmbach Airbnb Minimum Stay Requirements Analysis
Distribution of Listings by Minimum Night Requirement
1 Night
24 listings
57.1% of total
2 Nights
6 listings
14.3% of total
3 Nights
2 listings
4.8% of total
4-6 Nights
2 listings
4.8% of total
30+ Nights
8 listings
19% of total
Key Insights
- The most prevalent minimum stay requirement in Kulmbach is 1 Night, adopted by 57.1% of listings. This highlights the market's preference for shorter, flexible bookings.
- A strong majority (71.4%) of the Kulmbach Airbnb data shows acceptance of very short stays (1-2 nights), indicating a dynamic, high-turnover market.
- A significant segment (19%) caters to monthly stays (30+ nights) in Kulmbach, pointing to opportunities in the extended-stay market.
Recommendations
- Align with the market by considering a 1 Night minimum stay, as 57.1% of Kulmbach hosts use this setting.
- Explore offering discounts for stays of 30+ nights to attract the 19% of the market seeking extended stays.
- Adjust minimum nights based on seasonality – potentially shorter during low season and longer during peak demand periods in Kulmbach.
Kulmbach Airbnb Cancellation Policy Trends Analysis (2026)
Super Strict 60 Days
2 listings
4.8% of total
Limited
1 listings
2.4% of total
Flexible
22 listings
52.4% of total
Moderate
8 listings
19% of total
Firm
9 listings
21.4% of total
Cancellation Policy Insights for Kulmbach
- The prevailing Airbnb cancellation policy trend in Kulmbach is Flexible, used by 52.4% of listings.
- The market strongly favors guest-friendly terms, with 71.4% of listings offering Flexible or Moderate policies. This suggests guests in Kulmbach may expect booking flexibility.
Recommendations for Hosts
- Consider adopting a Flexible policy to align with the 52.4% market standard in Kulmbach.
- Given the high prevalence of Flexible policies (52.4%), offering this can enhance booking appeal, especially during shoulder seasons.
- Regularly review your cancellation policy against competitors and market demand shifts in Kulmbach.
Kulmbach STR Booking Lead Time Analysis (2026)
Average Booking Lead Time by Month
Booking Lead Time Insights for Kulmbach
- The overall average booking lead time for vacation rentals in Kulmbach is 56 days.
- Guests book furthest in advance for stays during June (average 113 days), likely coinciding with peak travel demand or local events.
- The shortest booking windows occur for stays in January (average 18 days), indicating more last-minute travel plans during this time.
- Seasonally, Summer (89 days avg.) sees the longest lead times, while Winter (23 days avg.) has the shortest, reflecting typical travel planning cycles.
Recommendations for Hosts
- Use the overall average lead time (56 days) as a baseline for your pricing and availability strategy in Kulmbach.
- For June stays, consider implementing length-of-stay discounts or slightly higher rates for bookings made less than 113 days out to capitalize on advance planning.
- Target marketing efforts for the Summer season well in advance (at least 89 days) to capture early planners.
- Monitor your own booking lead times against these Kulmbach averages to identify opportunities for dynamic pricing adjustments.
Popular & Essential Airbnb Amenities in Kulmbach (2026)
Amenity Prevalence
Amenity Insights for Kulmbach
- Popular amenities like Smoke alarm, Bed linens, Dishes and silverware are common but not universal. Offering these can provide a competitive edge.
- Warning: Wifi is not universally provided but is considered essential globally. Ensure reliable Wifi is offered.
Recommendations for Hosts
- Consider adding popular differentiators like Smoke alarm or Bed linens to increase appeal.
- Highlight unique or less common amenities you offer (e.g., hot tub, dedicated workspace, EV charger) in your listing description and photos.
- Regularly check competitor amenities in Kulmbach to stay competitive.
Kulmbach Airbnb Guest Demographics & Profile Analysis (2026)
Guest Profile Summary for Kulmbach
- The typical guest profile for Airbnb in Kulmbach consists of primarily domestic travelers (80%), often arriving from nearby Berlin, typically belonging to the Post-2000s (Gen Z/Alpha) group (50%), primarily speaking English or German.
- Domestic travelers account for 80.0% of guests.
- Key international markets include Germany (80%) and United States (3.6%).
- Top languages spoken are English (42.4%) followed by German (33.8%).
- A significant demographic segment is the Post-2000s (Gen Z/Alpha) group, representing 50% of guests.
Recommendations for Hosts
- Target domestic marketing efforts towards travelers from Berlin and Munich.
- Tailor amenities and listing descriptions to appeal to the dominant Post-2000s (Gen Z/Alpha) demographic (e.g., highlight fast WiFi, smart home features, local guides).
- Highlight unique local experiences or amenities relevant to the primary guest profile.
- Consider seasonal promotions aligned with peak travel times for key origin markets.
Nearby Short-Term Rental Market Comparison
How does the Kulmbach Airbnb market stack up against its neighbors? Compare key performance metrics like average monthly revenue, ADR, and occupancy rates in surrounding areas to understand the broader regional STR landscape.
| Market | Active Properties | Monthly Revenue | Daily Rate | Avg. Occupancy |
|---|---|---|---|---|
| Löbnitz | 10 | $3,243 | $198.55 | 51% |
| Kollnburg | 12 | $2,526 | $317.10 | 32% |
| Allersberg | 10 | $2,041 | $227.55 | 33% |
| Pouch | 12 | $1,972 | $190.12 | 37% |
| Rothenburg ob der Tauber | 47 | $1,879 | $145.18 | 41% |
| Herzberg | 18 | $1,879 | $193.86 | 38% |
| Krummennaab | 12 | $1,755 | $165.49 | 43% |
| Am Ettersberg | 16 | $1,712 | $167.99 | 43% |
| Neukieritzsch | 39 | $1,695 | $141.94 | 42% |
| Gräfenberg | 13 | $1,601 | $145.32 | 43% |