Kitzingen Airbnb Market Analysis 2026: Short Term Rental Data & Vacation Rental Statistics in Bavaria, Germany
Is Airbnb profitable in Kitzingen in 2026? Explore comprehensive Airbnb analytics for Kitzingen, Bavaria, Germany to uncover income potential. This 2026 STR market report for Kitzingen, based on AirROI data from February 2025 to January 2026, reveals key trends in the niche market of 31 active listings.
Whether you're considering an Airbnb investment in Kitzingen, optimizing your existing vacation rental, or exploring rental arbitrage opportunities, understanding the Kitzingen Airbnb data is crucial. Leveraging the low regulation environment is key to maximizing your short term rental income potential. Let's dive into the specifics.
Key Kitzingen Airbnb Performance Metrics Overview
Monthly Airbnb Revenue Variations & Income Potential in Kitzingen (2026)
Understanding the monthly revenue variations for Airbnb listings in Kitzingen is key to maximizing your short term rental income potential. Seasonality significantly impacts earnings. Our analysis, based on data from the past 12 months, shows that the peak revenue month for STRs in Kitzingen is typically July, while January often presents the lowest earnings, highlighting opportunities for strategic pricing adjustments during shoulder and low seasons. Explore the typical Airbnb income in Kitzingen across different performance tiers:
- Best-in-class properties (Top 10%) achieve $3,444+ monthly, often utilizing dynamic pricing and superior guest experiences.
- Strong performing properties (Top 25%) earn $2,204 or more, indicating effective management and desirable locations/amenities.
- Typical properties (Median) generate around $1,234 per month, representing the average market performance.
- Entry-level properties (Bottom 25%) see earnings around $611, often with potential for optimization.
Average Monthly Airbnb Earnings Trend in Kitzingen
Kitzingen Airbnb Occupancy Rate Trends (2026)
Maximize your bookings by understanding the Kitzingen STR occupancy trends. Seasonal demand shifts significantly influence how often properties are booked. Typically, Aprilsees the highest demand (peak season occupancy), while January experiences the lowest (low season). Effective strategies, like adjusting minimum stays or offering promotions, can boost occupancy during slower periods. Here's how different property tiers perform in Kitzingen:
- Best-in-class properties (Top 10%) achieve 66%+ occupancy, indicating high desirability and potentially optimized availability.
- Strong performing properties (Top 25%) maintain 49% or higher occupancy, suggesting good market fit and guest satisfaction.
- Typical properties (Median) have an occupancy rate around 30%.
- Entry-level properties (Bottom 25%) average 17% occupancy, potentially facing higher vacancy.
Average Monthly Occupancy Rate Trend in Kitzingen
Average Daily Rate (ADR) Airbnb Trends in Kitzingen (2026)
Effective short term rental pricing strategy in Kitzingen involves understanding monthly ADR fluctuations. The Average Daily Rate (ADR) for Airbnb in Kitzingen typically peaks in October and dips lowest during March. Leveraging Airbnb dynamic pricing tools or strategies based on this seasonality can significantly boost revenue. Here's a look at the typical nightly rates achieved:
- Best-in-class properties (Top 10%) command rates of $201+ per night, often due to premium features or locations.
- Strong performing properties (Top 25%) achieve nightly rates of $173 or more.
- Typical properties (Median) charge around $130 per night.
- Entry-level properties (Bottom 25%) earn around $82 per night.
Average Daily Rate (ADR) Trend by Month in Kitzingen
Get Live Kitzingen Market Intelligence 👇

Explore Real-time Analytics
Airbnb Seasonality Analysis & Trends in Kitzingen (2026)
Peak Season (July, August, April)
- Revenue averages $2,088 per month
- Occupancy rates average 42.6%
- Daily rates average $130
Shoulder Season
- Revenue averages $1,609 per month
- Occupancy maintains around 36.4%
- Daily rates hold near $133
Low Season (January, March, November)
- Revenue drops to average $1,062 per month
- Occupancy decreases to average 27.9%
- Daily rates adjust to average $131
Seasonality Insights for Kitzingen
- The Airbnb seasonality in Kitzingen shows highly seasonal trends requiring careful strategy. While the sections above show seasonal averages, it's also insightful to look at the extremes:
- During the high season, the absolute peak month showcases Kitzingen's highest earning potential, with monthly revenues capable of climbing to $2,247, occupancy reaching a high of 44.1%, and ADRs peaking at $141.
- Conversely, the slowest single month of the year, typically falling within the low season, marks the market's lowest point. In this month, revenue might dip to $888, occupancy could drop to 23.8%, and ADRs may adjust down to $124.
- Understanding both the seasonal averages and these monthly peaks and troughs in revenue, occupancy, and ADR is crucial for maximizing your Airbnb profit potential in Kitzingen.
Seasonal Strategies for Maximizing Profit
- Peak Season: Maximize revenue through premium pricing and potentially longer minimum stays. Ensure high availability.
- Low Season: Offer competitive pricing, special promotions (e.g., extended stay discounts), and flexible cancellation policies. Target off-season travelers like remote workers or budget-conscious guests.
- Shoulder Seasons: Implement dynamic pricing that balances peak and low rates. Target weekend travelers or specific events. Offer slightly more flexible terms than peak season.
- Regularly analyze your own performance against these Kitzingen seasonality benchmarks and adjust your pricing and availability strategy accordingly.
Best Areas for Airbnb Investment in Kitzingen (2026)
Exploring the top neighborhoods for short-term rentals in Kitzingen? This section highlights key areas, outlining why they are attractive for hosts and guests, along with notable local attractions. Consider these locations based on your target guest profile and investment strategy.
| Neighborhood / Area | Why Host Here? (Target Guests & Appeal) | Key Attractions & Landmarks |
|---|---|---|
| Kitzingen Old Town | Charming historical center with medieval architecture and picturesque streets. Attractive to tourists interested in history, culture, and local cuisine. | Kitzingen Castle, Historic Town Hall, St. Johannes Church, Wine Museum, Main River Promenade |
| Bavarian Wine Route | A beautiful scenic region renowned for vineyards and wine tasting. Ideal for guests seeking a rural escape with outdoor activities and culinary experiences. | Wine Cellars, Vineyard Tours, Local Vineyards, Scenic Bike Trails, Wine Festivals |
| Main River Promenade | A lovely riverside area perfect for relaxation and recreation. Popular with guests who enjoy walking, cycling, and waterfront dining. | Main River Cycling Path, Riverboat Cruises, Parks along the Main, Picnic Spots, Restaurants with river views |
| Kitzingen Biergarten | A lively area filled with traditional beer gardens, perfect for tourists looking to experience Bavarian culture and conviviality. | Local Breweries, Beer Gardens, Cultural Events, Outdoor Festivals, Traditional Restaurants |
| Kitzingen Festivals | Hosts various cultural and music festivals throughout the year, attracting tourists and locals alike. Great for guests interested in events and social gatherings. | Wine Festival, Christmas Market, Cultural Festivals, Live Music Events, Food Markets |
| Surrounding Vineyards | Gorgeous countryside with rolling hills and vineyards, ideal for a peaceful getaway in nature. Attracts tourists wanting to relax and enjoy rural scenery. | Scenic Views, Hiking Trails, Picnic Areas, Vineyard Tours, Nature Walks |
| Local Art Scene | A growing community of artists and galleries, attracting art lovers and creative individuals. A unique area for visitors seeking inspiration and creativity. | Art Galleries, Local Artists, Art Workshops, Cultural Events, Exhibitions |
| Kitzingen Shopping District | A mix of boutique shops and local markets. Perfect for visitors looking to shop for unique items and local crafts. | Local Markets, Boutique Shops, Cafés, Souvenir Shops, Shopping Events |
Understanding Airbnb License Requirements & STR Laws in Kitzingen (2026)
While Kitzingen, Bavaria, Germany currently shows low STR regulations, specific Airbnb license requirements might still exist or change. Always verify the latest short term rental regulations and Airbnb license requirements directly with local government authorities for Kitzingen to ensure full compliance before hosting.
(Source: AirROI data, 2026, based on 3% licensed listings)
Top Performing Airbnb Properties in Kitzingen (2026)
Benchmark your potential! Explore examples of top-performing Airbnb properties in Kitzingenbased on Trailing Twelve Month (TTM) revenue. Analyze their characteristics, revenue, occupancy rate, and ADR to understand what drives success in this market.
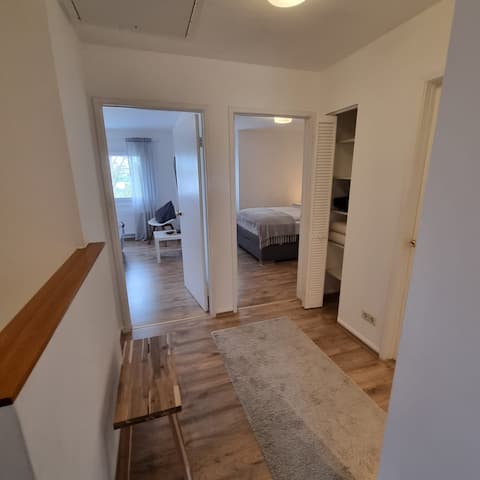
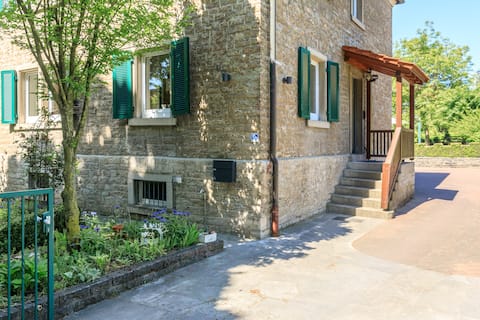
Texan-style house in Apfelbacher
Entire Place • 3 bedrooms
3 rooms/ new building / parking/ balcony/
Entire Place • 3 bedrooms

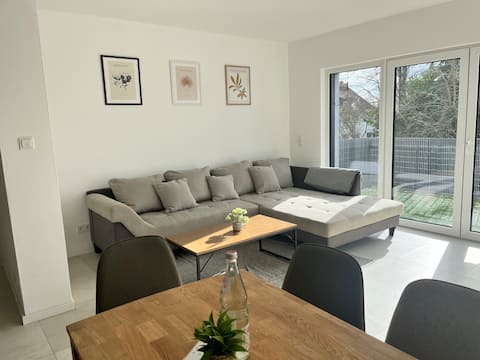
Villa in the heart of Lower Franconia
Entire Place • 3 bedrooms
LOOT: Modern apartment / Central / Parking
Entire Place • 1 bedroom
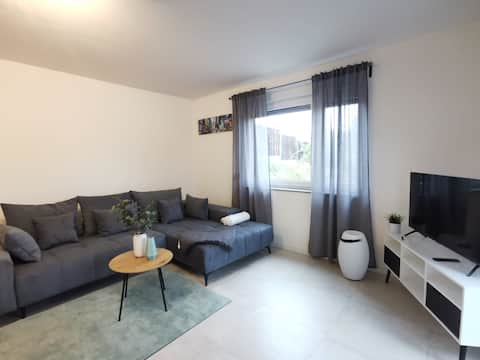
Apartment Apfelbaum Kitzingen
Entire Place • 2 bedrooms
Loot Large /Outskirts/Parking
Entire Place • 3 bedrooms
Note: Performance varies based on location, size, amenities, seasonality, and management quality. Data reflects the past 12 months.
Top Performing Airbnb Hosts in Kitzingen (2026)
Learn from the best! This table showcases top-performing Airbnb hosts in Kitzingen based on the number of properties managed and estimated total revenue over the past year. Analyze their scale and performance metrics.
| Host Name | Properties | Grossing Revenue | Stay Reviews | Avg Rating |
|---|---|---|---|---|
| Dafina | 4 | $95,282 | 106 | 4.37/5.0 |
| Stefanie & Martin | 6 | $61,953 | 52 | 4.74/5.0 |
| Reinhold | 1 | $38,709 | 33 | 5.00/5.0 |
| Lorette | 4 | $29,443 | 20 | 4.92/5.0 |
| Jan | 1 | $26,629 | 25 | 4.88/5.0 |
| Johannes | 1 | $23,176 | 38 | 4.95/5.0 |
| Alexander | 2 | $20,015 | 9 | 4.70/5.0 |
| Sebastian | 1 | $16,042 | 102 | 4.79/5.0 |
| Stefan | 1 | $10,292 | 24 | 4.83/5.0 |
| Ralf | 1 | $9,951 | 6 | 4.67/5.0 |
Analyzing the strategies of top hosts, such as their property selection, pricing, and guest communication, can offer valuable lessons for optimizing your own Airbnb operations in Kitzingen.
Dive Deeper: Advanced Kitzingen STR Market Data (2026)
Ready to unlock more insights? AirROI provides access to advanced metrics and comprehensive Airbnb data for Kitzingen. Explore detailed analytics beyond this report to refine your investment strategy, optimize pricing, and maximize your vacation rental profits.
Explore Advanced MetricsKitzingen Short-Term Rental Market Composition (2026): Property & Room Types
Room Type Distribution
Property Type Distribution
Market Composition Insights for Kitzingen
- The Kitzingen Airbnb market composition is heavily skewed towards Entire Home/Apt listings, which make up 83.9% of the 31 active rentals. This indicates strong guest preference for privacy and space.
- Looking at the property type distribution in Kitzingen, Apartment/Condo properties are the most common (58.1%), reflecting the local real estate landscape.
- Houses represent a significant 35.5% portion, catering likely to families or larger groups.
- The presence of 6.5% Hotel/Boutique listings indicates integration with traditional hospitality.
Kitzingen Airbnb Room Capacity Analysis (2026): Bedroom Distribution
Distribution of Listings by Number of Bedrooms
Room Capacity Insights for Kitzingen
- The dominant room capacity in Kitzingen is 3 bedrooms listings, making up 32.3% of the market. This suggests a strong demand for properties suitable for families or small groups.
- Together, 3 bedrooms and 1 bedroom properties represent 61.3% of the active Airbnb listings in Kitzingen, indicating a high concentration in these sizes.
- A significant 32.3% of listings offer 3+ bedrooms, catering to larger groups and families seeking more space in Kitzingen.
Kitzingen Vacation Rental Guest Capacity Trends (2026)
Distribution of Listings by Guest Capacity
Guest Capacity Insights for Kitzingen
- The most common guest capacity trend in Kitzingen vacation rentals is listings accommodating 4 guests (32.3%). This suggests the primary traveler segment is likely small families or groups.
- Properties designed for 4 guests and 2 guests dominate the Kitzingen STR market, accounting for 51.7% of listings.
- 29.0% of properties accommodate 6+ guests, serving the market segment for larger families or group travel in Kitzingen.
- On average, properties in Kitzingen are equipped to host 4.1 guests.
Kitzingen Airbnb Booking Patterns (2026): Available vs. Booked Days
Available Days Distribution
Booked Days Distribution
Booking Pattern Insights for Kitzingen
- The most common availability pattern in Kitzingen falls within the 271-366 days range, representing 67.7% of listings. This suggests many properties have significant open periods on their calendars.
- Approximately 96.7% of listings show high availability (181+ days open annually), indicating potential for increased bookings or specific owner usage patterns.
- For booked days, the 31-90 days range is most frequent in Kitzingen (45.2%), reflecting common guest stay durations or potential owner blocking patterns.
- A notable 3.2% of properties secure long booking periods (181+ days booked per year), highlighting successful long-term rental strategies or significant owner usage.
Kitzingen Airbnb Minimum Stay Requirements Analysis
Distribution of Listings by Minimum Night Requirement
1 Night
8 listings
25.8% of total
2 Nights
11 listings
35.5% of total
3 Nights
3 listings
9.7% of total
4-6 Nights
4 listings
12.9% of total
30+ Nights
5 listings
16.1% of total
Key Insights
- The most prevalent minimum stay requirement in Kitzingen is 2 Nights, adopted by 35.5% of listings. This highlights the market's preference for shorter, flexible bookings.
- A strong majority (61.3%) of the Kitzingen Airbnb data shows acceptance of very short stays (1-2 nights), indicating a dynamic, high-turnover market.
- A significant segment (16.1%) caters to monthly stays (30+ nights) in Kitzingen, pointing to opportunities in the extended-stay market.
Recommendations
- Align with the market by considering a 2 Nights minimum stay, as 35.5% of Kitzingen hosts use this setting.
- If feasible, allowing 1-night stays, especially midweek or during low season, could capture last-minute bookings, as only 25.8% currently do.
- Explore offering discounts for stays of 30+ nights to attract the 16.1% of the market seeking extended stays.
- Adjust minimum nights based on seasonality – potentially shorter during low season and longer during peak demand periods in Kitzingen.
Kitzingen Airbnb Cancellation Policy Trends Analysis (2026)
Flexible
12 listings
38.7% of total
Moderate
7 listings
22.6% of total
Firm
10 listings
32.3% of total
Strict
2 listings
6.5% of total
Cancellation Policy Insights for Kitzingen
- The prevailing Airbnb cancellation policy trend in Kitzingen is Flexible, used by 38.7% of listings.
- There's a relatively balanced mix between guest-friendly (61.3%) and stricter (38.8%) policies, offering choices for different guest needs.
- Strict cancellation policies are quite rare (6.5%), potentially making listings with this policy less competitive unless justified by high demand or property type.
Recommendations for Hosts
- Consider adopting a Flexible policy to align with the 38.7% market standard in Kitzingen.
- Using a Strict policy might deter some guests, as only 6.5% of listings use it. Evaluate if potential revenue protection outweighs possible lower booking rates.
- Regularly review your cancellation policy against competitors and market demand shifts in Kitzingen.
Kitzingen STR Booking Lead Time Analysis (2026)
Average Booking Lead Time by Month
Booking Lead Time Insights for Kitzingen
- The overall average booking lead time for vacation rentals in Kitzingen is 73 days.
- Guests book furthest in advance for stays during October (average 127 days), likely coinciding with peak travel demand or local events.
- The shortest booking windows occur for stays in March (average 36 days), indicating more last-minute travel plans during this time.
- Seasonally, Fall (102 days avg.) sees the longest lead times, while Winter (53 days avg.) has the shortest, reflecting typical travel planning cycles.
Recommendations for Hosts
- Use the overall average lead time (73 days) as a baseline for your pricing and availability strategy in Kitzingen.
- For October stays, consider implementing length-of-stay discounts or slightly higher rates for bookings made less than 127 days out to capitalize on advance planning.
- Target marketing efforts for the Fall season well in advance (at least 102 days) to capture early planners.
- Monitor your own booking lead times against these Kitzingen averages to identify opportunities for dynamic pricing adjustments.
Popular & Essential Airbnb Amenities in Kitzingen (2026)
Amenity Prevalence
Amenity Insights for Kitzingen
- Essential amenities in Kitzingen that guests expect include: TV. Lacking these (this) could significantly impact bookings.
- Popular amenities like Smoke alarm, Heating, Dishes and silverware are common but not universal. Offering these can provide a competitive edge.
- Warning: Wifi is not universally provided but is considered essential globally. Ensure reliable Wifi is offered.
Recommendations for Hosts
- Ensure your listing includes all essential amenities for Kitzingen: TV.
- Prioritize adding missing essentials: TV.
- Consider adding popular differentiators like Smoke alarm or Heating to increase appeal.
- Highlight unique or less common amenities you offer (e.g., hot tub, dedicated workspace, EV charger) in your listing description and photos.
- Regularly check competitor amenities in Kitzingen to stay competitive.
Kitzingen Airbnb Guest Demographics & Profile Analysis (2026)
Guest Profile Summary for Kitzingen
- The typical guest profile for Airbnb in Kitzingen consists of a mix of domestic (51%) and international guests, often arriving from nearby England, typically belonging to the Post-2000s (Gen Z/Alpha) group (50%), primarily speaking English or German.
- Domestic travelers account for 50.7% of guests.
- Key international markets include Germany (50.7%) and Netherlands (7%).
- Top languages spoken are English (37.2%) followed by German (30.9%).
- A significant demographic segment is the Post-2000s (Gen Z/Alpha) group, representing 50% of guests.
Recommendations for Hosts
- Balance marketing efforts between domestic and international channels based on the guest mix.
- Tailor amenities and listing descriptions to appeal to the dominant Post-2000s (Gen Z/Alpha) demographic (e.g., highlight fast WiFi, smart home features, local guides).
- Highlight unique local experiences or amenities relevant to the primary guest profile.
- Consider seasonal promotions aligned with peak travel times for key origin markets.
Nearby Short-Term Rental Market Comparison
How does the Kitzingen Airbnb market stack up against its neighbors? Compare key performance metrics like average monthly revenue, ADR, and occupancy rates in surrounding areas to understand the broader regional STR landscape.
| Market | Active Properties | Monthly Revenue | Daily Rate | Avg. Occupancy |
|---|---|---|---|---|
| Kusterdingen | 10 | $3,119 | $229.94 | 43% |
| Poing | 16 | $2,939 | $162.94 | 57% |
| Pfaffenhofen an der Ilm | 11 | $2,842 | $197.93 | 48% |
| Unterschleißheim | 18 | $2,539 | $155.66 | 53% |
| Herrsching am Ammersee | 47 | $2,321 | $183.14 | 52% |
| Dachau | 36 | $2,120 | $151.77 | 50% |
| Allersberg | 10 | $2,041 | $227.55 | 33% |
| Gräfelfing | 21 | $2,034 | $215.51 | 49% |
| Oberschleißheim | 28 | $2,000 | $136.98 | 57% |
| Gauting | 34 | $1,967 | $162.55 | 47% |