Hopferau Airbnb Market Analysis 2026: Short Term Rental Data & Vacation Rental Statistics in Bavaria, Germany
Is Airbnb profitable in Hopferau in 2026? Explore comprehensive Airbnb analytics for Hopferau, Bavaria, Germany to uncover income potential. This 2026 STR market report for Hopferau, based on AirROI data from February 2025 to January 2026, reveals key trends in the niche market of 20 active listings.
Whether you're considering an Airbnb investment in Hopferau, optimizing your existing vacation rental, or exploring rental arbitrage opportunities, understanding the Hopferau Airbnb data is crucial. Leveraging the low regulation environment is key to maximizing your short term rental income potential. Let's dive into the specifics.
Key Hopferau Airbnb Performance Metrics Overview
Monthly Airbnb Revenue Variations & Income Potential in Hopferau (2026)
Understanding the monthly revenue variations for Airbnb listings in Hopferau is key to maximizing your short term rental income potential. Seasonality significantly impacts earnings. Our analysis, based on data from the past 12 months, shows that the peak revenue month for STRs in Hopferau is typically August, while November often presents the lowest earnings, highlighting opportunities for strategic pricing adjustments during shoulder and low seasons. Explore the typical Airbnb income in Hopferau across different performance tiers:
- Best-in-class properties (Top 10%) achieve $3,784+ monthly, often utilizing dynamic pricing and superior guest experiences.
- Strong performing properties (Top 25%) earn $2,265 or more, indicating effective management and desirable locations/amenities.
- Typical properties (Median) generate around $1,470 per month, representing the average market performance.
- Entry-level properties (Bottom 25%) see earnings around $631, often with potential for optimization.
Average Monthly Airbnb Earnings Trend in Hopferau
Hopferau Airbnb Occupancy Rate Trends (2026)
Maximize your bookings by understanding the Hopferau STR occupancy trends. Seasonal demand shifts significantly influence how often properties are booked. Typically, Augustsees the highest demand (peak season occupancy), while November experiences the lowest (low season). Effective strategies, like adjusting minimum stays or offering promotions, can boost occupancy during slower periods. Here's how different property tiers perform in Hopferau:
- Best-in-class properties (Top 10%) achieve 74%+ occupancy, indicating high desirability and potentially optimized availability.
- Strong performing properties (Top 25%) maintain 61% or higher occupancy, suggesting good market fit and guest satisfaction.
- Typical properties (Median) have an occupancy rate around 43%.
- Entry-level properties (Bottom 25%) average 15% occupancy, potentially facing higher vacancy.
Average Monthly Occupancy Rate Trend in Hopferau
Average Daily Rate (ADR) Airbnb Trends in Hopferau (2026)
Effective short term rental pricing strategy in Hopferau involves understanding monthly ADR fluctuations. The Average Daily Rate (ADR) for Airbnb in Hopferau typically peaks in December and dips lowest during April. Leveraging Airbnb dynamic pricing tools or strategies based on this seasonality can significantly boost revenue. Here's a look at the typical nightly rates achieved:
- Best-in-class properties (Top 10%) command rates of $203+ per night, often due to premium features or locations.
- Strong performing properties (Top 25%) achieve nightly rates of $151 or more.
- Typical properties (Median) charge around $106 per night.
- Entry-level properties (Bottom 25%) earn around $85 per night.
Average Daily Rate (ADR) Trend by Month in Hopferau
Get Live Hopferau Market Intelligence 👇

Explore Real-time Analytics
Airbnb Seasonality Analysis & Trends in Hopferau (2026)
Peak Season (August, June, September)
- Revenue averages $2,606 per month
- Occupancy rates average 53.1%
- Daily rates average $145
Shoulder Season
- Revenue averages $2,173 per month
- Occupancy maintains around 42.9%
- Daily rates hold near $140
Low Season (January, March, November)
- Revenue drops to average $1,269 per month
- Occupancy decreases to average 25.0%
- Daily rates adjust to average $136
Seasonality Insights for Hopferau
- The Airbnb seasonality in Hopferau shows highly seasonal trends requiring careful strategy. While the sections above show seasonal averages, it's also insightful to look at the extremes:
- During the high season, the absolute peak month showcases Hopferau's highest earning potential, with monthly revenues capable of climbing to $2,685, occupancy reaching a high of 59.3%, and ADRs peaking at $179.
- Conversely, the slowest single month of the year, typically falling within the low season, marks the market's lowest point. In this month, revenue might dip to $1,016, occupancy could drop to 20.0%, and ADRs may adjust down to $120.
- Understanding both the seasonal averages and these monthly peaks and troughs in revenue, occupancy, and ADR is crucial for maximizing your Airbnb profit potential in Hopferau.
Seasonal Strategies for Maximizing Profit
- Peak Season: Maximize revenue through premium pricing and potentially longer minimum stays. Ensure high availability.
- Low Season: Offer competitive pricing, special promotions (e.g., extended stay discounts), and flexible cancellation policies. Target off-season travelers like remote workers or budget-conscious guests.
- Shoulder Seasons: Implement dynamic pricing that balances peak and low rates. Target weekend travelers or specific events. Offer slightly more flexible terms than peak season.
- Regularly analyze your own performance against these Hopferau seasonality benchmarks and adjust your pricing and availability strategy accordingly.
Best Areas for Airbnb Investment in Hopferau (2026)
Exploring the top neighborhoods for short-term rentals in Hopferau? This section highlights key areas, outlining why they are attractive for hosts and guests, along with notable local attractions. Consider these locations based on your target guest profile and investment strategy.
| Neighborhood / Area | Why Host Here? (Target Guests & Appeal) | Key Attractions & Landmarks |
|---|---|---|
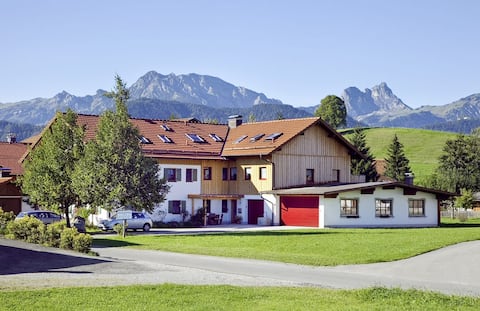
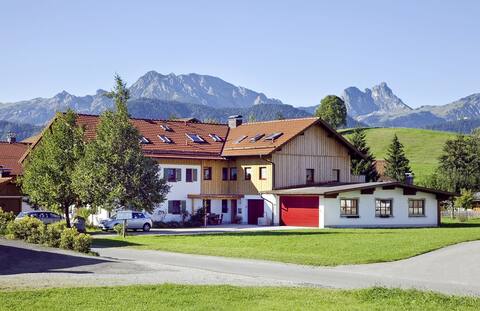
| Hopferau Village | A charming Bavarian village, known for its picturesque scenery and close-knit community atmosphere. Ideal for tourists seeking a peaceful stay in the Alps, with traditional Bavarian culture and hospitality. | St. Martin's Church, Hopferau Castle ruins, Local beer gardens, Hiking trails around the Alps, Surrounding alpine nature parks |
| Füssen | A nearby town famous for its fairy-tale castles and stunning landscapes. It attracts tourists visiting Neuschwanstein and Hohenschwangau castles, making it a prime location for Airbnb hosts. | Neuschwanstein Castle, Hohenschwangau Castle, Füssen Old Town, Forggensee Lake, Bavarian Music Festival |
| Nesselwang | A lovely alpine village offering outdoor activities year-round, popular for skiing in winter and hiking in summer. Beautiful landscapes make it attractive to nature lovers. | Alpenbad Nesselwang (Waterpark), Nesselwang ski area, Allgäu Sky Area, Nearby hiking trails, Scenic mountain views |
| Pfronten | A popular destination for outdoor enthusiasts, located in the Allgäu region with stunning mountain scenery and a range of recreational activities. Great for families and active travelers. | Pfronten Cable Car, Allgäu coasters, Hiking and biking trails, Local alpine farms, Breathtaking mountain peaks |
| Railway Museum | A unique attraction in the region, appealing to history buffs and families. Provides niche experiences featuring Bavarian railway history, enhancing Airbnb appeal for niche tourists. | Füssen Railway Museum, Old steam locomotives, Interactive exhibits, Scenic train routes, Workshops and events |
| Schwangau | Famous for the royal castles and stunning landscapes, Schwangau is a hub for tourists visiting the castles, ensuring a steady flow of visitors. A key area for Airbnb accommodations. | Neuschwanstein Castle, Hohenschwangau Castle, Alpsee Lake, Walking paths around the lake, Local dining options |
| Blaichach | A tranquil village surrounded by nature, appealing to those looking for a rustic retreat. Offers outdoor activities and local charm, perfect for a serene Airbnb experience. | Blaichach hiking trails, Local markets, Traditional Bavarian festivals, Nearby lakes, Nature parks |
| Oberstdorf | A well-known ski resort that attracts winter sports enthusiasts and visitors in the summer for hiking. A bustling town with year-round activities, attracting many Airbnb guests. | Nebelhorn Mountain, Hiking trails, Ski resorts, Oberstdorf ski jumping hill, Cultural events and festivals |
Understanding Airbnb License Requirements & STR Laws in Hopferau (2026)
While Hopferau, Bavaria, Germany currently shows low STR regulations, specific Airbnb license requirements might still exist or change. Always verify the latest short term rental regulations and Airbnb license requirements directly with local government authorities for Hopferau to ensure full compliance before hosting.
(Source: AirROI data, 2026, finding no licensed listings among those analyzed)
Top Performing Airbnb Properties in Hopferau (2026)
Benchmark your potential! Explore examples of top-performing Airbnb properties in Hopferaubased on Trailing Twelve Month (TTM) revenue. Analyze their characteristics, revenue, occupancy rate, and ADR to understand what drives success in this market.
Alp Villa I 11 people I log cabin I parking
Entire Place • 6 bedrooms
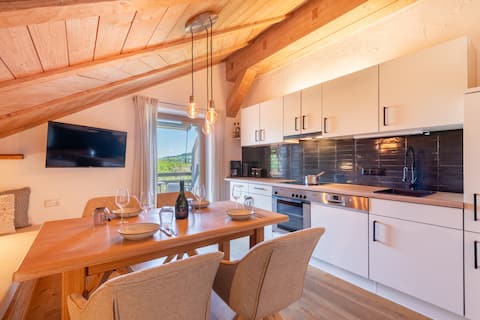
Jr. Suite I Balkony I Parking I Log Cabin I View
Entire Place • 1 bedroom

Superior Suite I Balcony I Parks I Log cabin
Entire Place • 2 bedrooms
Studio I Balkony I Kitchen I Parking I View
Entire Place • 2 bedrooms

Vacation home at Schorendorfer farm
Entire Place • 2 bedrooms

Breher apartment with balcony and mountain view
Entire Place • 2 bedrooms
Note: Performance varies based on location, size, amenities, seasonality, and management quality. Data reflects the past 12 months.
Top Performing Airbnb Hosts in Hopferau (2026)
Learn from the best! This table showcases top-performing Airbnb hosts in Hopferau based on the number of properties managed and estimated total revenue over the past year. Analyze their scale and performance metrics.
| Host Name | Properties | Grossing Revenue | Stay Reviews | Avg Rating |
|---|---|---|---|---|
| Andreas | 4 | $201,472 | 215 | 4.72/5.0 |
| Leonie | 11 | $105,436 | 80 | 4.88/5.0 |
| Peter | 1 | $20,295 | 18 | 5.00/5.0 |
| Tom | 1 | $15,632 | 56 | 4.75/5.0 |
| Anne And Neil | 1 | $13,321 | 32 | 4.94/5.0 |
| Ferienagentur Herrmann GmbH | 2 | $7,661 | 7 | 4.83/5.0 |
Analyzing the strategies of top hosts, such as their property selection, pricing, and guest communication, can offer valuable lessons for optimizing your own Airbnb operations in Hopferau.
Dive Deeper: Advanced Hopferau STR Market Data (2026)
Ready to unlock more insights? AirROI provides access to advanced metrics and comprehensive Airbnb data for Hopferau. Explore detailed analytics beyond this report to refine your investment strategy, optimize pricing, and maximize your vacation rental profits.
Explore Advanced MetricsHopferau Short-Term Rental Market Composition (2026): Property & Room Types
Room Type Distribution
Property Type Distribution
Market Composition Insights for Hopferau
- The Hopferau Airbnb market composition is heavily skewed towards Entire Home/Apt listings, which make up 100% of the 20 active rentals. This indicates strong guest preference for privacy and space.
- Looking at the property type distribution in Hopferau, Apartment/Condo properties are the most common (70%), reflecting the local real estate landscape.
Hopferau Airbnb Room Capacity Analysis (2026): Bedroom Distribution
Distribution of Listings by Number of Bedrooms
Room Capacity Insights for Hopferau
- The dominant room capacity in Hopferau is 1 bedroom listings, making up 45% of the market. This suggests a strong demand for properties suitable for couples or solo travelers.
- Together, 1 bedroom and 2 bedrooms properties represent 85.0% of the active Airbnb listings in Hopferau, indicating a high concentration in these sizes.
Hopferau Vacation Rental Guest Capacity Trends (2026)
Distribution of Listings by Guest Capacity
Guest Capacity Insights for Hopferau
- The most common guest capacity trend in Hopferau vacation rentals is listings accommodating 2 guests (30%). This suggests the primary traveler segment is likely couples or solo travelers.
- Properties designed for 2 guests and 4 guests dominate the Hopferau STR market, accounting for 50.0% of listings.
- On average, properties in Hopferau are equipped to host 3.8 guests.
Hopferau Airbnb Booking Patterns (2026): Available vs. Booked Days
Available Days Distribution
Booked Days Distribution
Booking Pattern Insights for Hopferau
- The most common availability pattern in Hopferau falls within the 181-270 days range, representing 45% of listings. This suggests many properties have significant open periods on their calendars.
- Approximately 85.0% of listings show high availability (181+ days open annually), indicating potential for increased bookings or specific owner usage patterns.
- For booked days, the 91-180 days range is most frequent in Hopferau (45%), reflecting common guest stay durations or potential owner blocking patterns.
- A notable 15.0% of properties secure long booking periods (181+ days booked per year), highlighting successful long-term rental strategies or significant owner usage.
Hopferau Airbnb Minimum Stay Requirements Analysis
Distribution of Listings by Minimum Night Requirement
1 Night
1 listings
5% of total
3 Nights
1 listings
5% of total
4-6 Nights
5 listings
25% of total
7-29 Nights
3 listings
15% of total
30+ Nights
10 listings
50% of total
Key Insights
- The most prevalent minimum stay requirement in Hopferau is 30+ Nights, adopted by 50% of listings. This highlights the market's preference for longer commitments.
- Very short stays (1-2 nights) are less common (5.0%), suggesting hosts prefer slightly longer bookings to optimize turnover.
- A significant segment (50%) caters to monthly stays (30+ nights) in Hopferau, pointing to opportunities in the extended-stay market.
Recommendations
- Align with the market by considering a 30+ Nights minimum stay, as 50% of Hopferau hosts use this setting.
- If feasible, allowing 1-night stays, especially midweek or during low season, could capture last-minute bookings, as only 5% currently do.
- Explore offering discounts for stays of 30+ nights to attract the 50% of the market seeking extended stays.
- Adjust minimum nights based on seasonality – potentially shorter during low season and longer during peak demand periods in Hopferau.
Hopferau Airbnb Cancellation Policy Trends Analysis (2026)
Super Strict 30 Days
4 listings
20% of total
Moderate
4 listings
20% of total
Firm
11 listings
55% of total
Strict
1 listings
5% of total
Cancellation Policy Insights for Hopferau
- The prevailing Airbnb cancellation policy trend in Hopferau is Firm, used by 55% of listings.
- A majority (60.0%) of hosts in Hopferau utilize Firm or Strict policies, indicating a market where hosts prioritize booking security.
- Strict cancellation policies are quite rare (5%), potentially making listings with this policy less competitive unless justified by high demand or property type.
Recommendations for Hosts
- Consider adopting a Firm policy to align with the 55% market standard in Hopferau.
- Using a Strict policy might deter some guests, as only 5% of listings use it. Evaluate if potential revenue protection outweighs possible lower booking rates.
- Regularly review your cancellation policy against competitors and market demand shifts in Hopferau.
Hopferau STR Booking Lead Time Analysis (2026)
Average Booking Lead Time by Month
Booking Lead Time Insights for Hopferau
- The overall average booking lead time for vacation rentals in Hopferau is 80 days.
- Guests book furthest in advance for stays during July (average 106 days), likely coinciding with peak travel demand or local events.
- The shortest booking windows occur for stays in January (average 25 days), indicating more last-minute travel plans during this time.
- Seasonally, Summer (96 days avg.) sees the longest lead times, while Winter (55 days avg.) has the shortest, reflecting typical travel planning cycles.
Recommendations for Hosts
- Use the overall average lead time (80 days) as a baseline for your pricing and availability strategy in Hopferau.
- For July stays, consider implementing length-of-stay discounts or slightly higher rates for bookings made less than 106 days out to capitalize on advance planning.
- Target marketing efforts for the Summer season well in advance (at least 96 days) to capture early planners.
- Monitor your own booking lead times against these Hopferau averages to identify opportunities for dynamic pricing adjustments.
Popular & Essential Airbnb Amenities in Hopferau (2026)
Amenity Prevalence
Amenity Insights for Hopferau
- Essential amenities in Hopferau that guests expect include: Wifi, Kitchen, Coffee maker, Smoke alarm, Refrigerator, Stove, TV, Hair dryer, Free parking on premises. Lacking these (any) could significantly impact bookings.
- Popular amenities like Freezer are common but not universal. Offering these can provide a competitive edge.
Recommendations for Hosts
- Ensure your listing includes all essential amenities for Hopferau: Wifi, Kitchen, Coffee maker, Smoke alarm, Refrigerator, Stove, TV, Hair dryer, Free parking on premises.
- Prioritize adding missing essentials: Hair dryer, Free parking on premises.
- Consider adding popular differentiators like Freezer to increase appeal.
- Highlight unique or less common amenities you offer (e.g., hot tub, dedicated workspace, EV charger) in your listing description and photos.
- Regularly check competitor amenities in Hopferau to stay competitive.
Hopferau Airbnb Guest Demographics & Profile Analysis (2026)
Guest Profile Summary for Hopferau
- The typical guest profile for Airbnb in Hopferau consists of a mix of domestic (58%) and international guests, often arriving from nearby Paris, typically belonging to the Post-2000s (Gen Z/Alpha) group (50%), primarily speaking English or German.
- Domestic travelers account for 58.3% of guests.
- Key international markets include Germany (58.3%) and France (10%).
- Top languages spoken are English (40.6%) followed by German (29%).
- A significant demographic segment is the Post-2000s (Gen Z/Alpha) group, representing 50% of guests.
Recommendations for Hosts
- Balance marketing efforts between domestic and international channels based on the guest mix.
- Tailor amenities and listing descriptions to appeal to the dominant Post-2000s (Gen Z/Alpha) demographic (e.g., highlight fast WiFi, smart home features, local guides).
- Highlight unique local experiences or amenities relevant to the primary guest profile.
- Consider seasonal promotions aligned with peak travel times for key origin markets.
Nearby Short-Term Rental Market Comparison
How does the Hopferau Airbnb market stack up against its neighbors? Compare key performance metrics like average monthly revenue, ADR, and occupancy rates in surrounding areas to understand the broader regional STR landscape.
| Market | Active Properties | Monthly Revenue | Daily Rate | Avg. Occupancy |
|---|---|---|---|---|
| Sankt Pankraz - San Pancrazio | 12 | $6,528 | $633.65 | 29% |
| Balderschwang | 10 | $5,253 | $304.03 | 58% |
| Urtijëi - St. Ulrich in Gröden - Ortisei | 172 | $5,054 | $718.33 | 41% |
| Bürserberg | 45 | $3,783 | $331.48 | 40% |
| Kiens - Chienes | 17 | $3,715 | $377.77 | 48% |
| Brand | 63 | $3,714 | $522.47 | 31% |
| Varenna | 226 | $3,641 | $300.50 | 52% |
| Kramsach | 12 | $3,573 | $272.32 | 48% |
| Moos in Passeier - Moso in Passiria | 20 | $3,504 | $547.30 | 23% |
| Lajen - Laion | 96 | $3,338 | $548.27 | 36% |