Herrsching am Ammersee Airbnb Market Analysis 2026: Short Term Rental Data & Vacation Rental Statistics in Bavaria, Germany
Is Airbnb profitable in Herrsching am Ammersee in 2026? Explore comprehensive Airbnb analytics for Herrsching am Ammersee, Bavaria, Germany to uncover income potential. This 2026 STR market report for Herrsching am Ammersee, based on AirROI data from February 2025 to January 2026, reveals key trends in the niche market of 47 active listings.
Whether you're considering an Airbnb investment in Herrsching am Ammersee, optimizing your existing vacation rental, or exploring rental arbitrage opportunities, understanding the Herrsching am Ammersee Airbnb data is crucial. Leveraging the low regulation environment is key to maximizing your short term rental income potential. Let's dive into the specifics.
Key Herrsching am Ammersee Airbnb Performance Metrics Overview
Monthly Airbnb Revenue Variations & Income Potential in Herrsching am Ammersee (2026)
Understanding the monthly revenue variations for Airbnb listings in Herrsching am Ammersee is key to maximizing your short term rental income potential. Seasonality significantly impacts earnings. Our analysis, based on data from the past 12 months, shows that the peak revenue month for STRs in Herrsching am Ammersee is typically August, while January often presents the lowest earnings, highlighting opportunities for strategic pricing adjustments during shoulder and low seasons. Explore the typical Airbnb income in Herrsching am Ammersee across different performance tiers:
- Best-in-class properties (Top 10%) achieve $5,112+ monthly, often utilizing dynamic pricing and superior guest experiences.
- Strong performing properties (Top 25%) earn $3,543 or more, indicating effective management and desirable locations/amenities.
- Typical properties (Median) generate around $2,359 per month, representing the average market performance.
- Entry-level properties (Bottom 25%) see earnings around $1,437, often with potential for optimization.
Average Monthly Airbnb Earnings Trend in Herrsching am Ammersee
Herrsching am Ammersee Airbnb Occupancy Rate Trends (2026)
Maximize your bookings by understanding the Herrsching am Ammersee STR occupancy trends. Seasonal demand shifts significantly influence how often properties are booked. Typically, Augustsees the highest demand (peak season occupancy), while January experiences the lowest (low season). Effective strategies, like adjusting minimum stays or offering promotions, can boost occupancy during slower periods. Here's how different property tiers perform in Herrsching am Ammersee:
- Best-in-class properties (Top 10%) achieve 82%+ occupancy, indicating high desirability and potentially optimized availability.
- Strong performing properties (Top 25%) maintain 64% or higher occupancy, suggesting good market fit and guest satisfaction.
- Typical properties (Median) have an occupancy rate around 50%.
- Entry-level properties (Bottom 25%) average 34% occupancy, potentially facing higher vacancy.
Average Monthly Occupancy Rate Trend in Herrsching am Ammersee
Average Daily Rate (ADR) Airbnb Trends in Herrsching am Ammersee (2026)
Effective short term rental pricing strategy in Herrsching am Ammersee involves understanding monthly ADR fluctuations. The Average Daily Rate (ADR) for Airbnb in Herrsching am Ammersee typically peaks in September and dips lowest during February. Leveraging Airbnb dynamic pricing tools or strategies based on this seasonality can significantly boost revenue. Here's a look at the typical nightly rates achieved:
- Best-in-class properties (Top 10%) command rates of $299+ per night, often due to premium features or locations.
- Strong performing properties (Top 25%) achieve nightly rates of $188 or more.
- Typical properties (Median) charge around $142 per night.
- Entry-level properties (Bottom 25%) earn around $107 per night.
Average Daily Rate (ADR) Trend by Month in Herrsching am Ammersee
Get Live Herrsching am Ammersee Market Intelligence 👇

Explore Real-time Analytics
Airbnb Seasonality Analysis & Trends in Herrsching am Ammersee (2026)
Peak Season (August, July, June)
- Revenue averages $4,126 per month
- Occupancy rates average 69.8%
- Daily rates average $180
Shoulder Season
- Revenue averages $2,762 per month
- Occupancy maintains around 49.2%
- Daily rates hold near $174
Low Season (January, February, November)
- Revenue drops to average $1,677 per month
- Occupancy decreases to average 30.6%
- Daily rates adjust to average $167
Seasonality Insights for Herrsching am Ammersee
- The Airbnb seasonality in Herrsching am Ammersee shows highly seasonal trends requiring careful strategy. While the sections above show seasonal averages, it's also insightful to look at the extremes:
- During the high season, the absolute peak month showcases Herrsching am Ammersee's highest earning potential, with monthly revenues capable of climbing to $4,468, occupancy reaching a high of 74.5%, and ADRs peaking at $208.
- Conversely, the slowest single month of the year, typically falling within the low season, marks the market's lowest point. In this month, revenue might dip to $1,368, occupancy could drop to 22.1%, and ADRs may adjust down to $144.
- Understanding both the seasonal averages and these monthly peaks and troughs in revenue, occupancy, and ADR is crucial for maximizing your Airbnb profit potential in Herrsching am Ammersee.
Seasonal Strategies for Maximizing Profit
- Peak Season: Maximize revenue through premium pricing and potentially longer minimum stays. Ensure high availability.
- Low Season: Offer competitive pricing, special promotions (e.g., extended stay discounts), and flexible cancellation policies. Target off-season travelers like remote workers or budget-conscious guests.
- Shoulder Seasons: Implement dynamic pricing that balances peak and low rates. Target weekend travelers or specific events. Offer slightly more flexible terms than peak season.
- Regularly analyze your own performance against these Herrsching am Ammersee seasonality benchmarks and adjust your pricing and availability strategy accordingly.
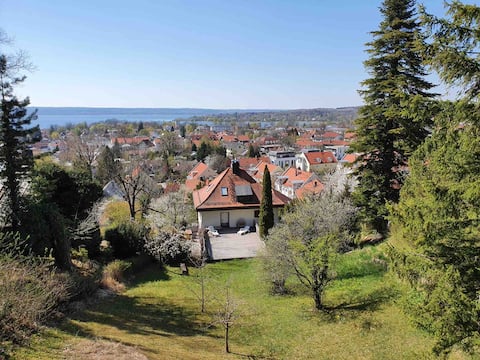
Best Areas for Airbnb Investment in Herrsching am Ammersee (2026)
Exploring the top neighborhoods for short-term rentals in Herrsching am Ammersee? This section highlights key areas, outlining why they are attractive for hosts and guests, along with notable local attractions. Consider these locations based on your target guest profile and investment strategy.
| Neighborhood / Area | Why Host Here? (Target Guests & Appeal) | Key Attractions & Landmarks |
|---|---|---|
| Pilsensee | A beautiful lake surrounded by nature, perfect for outdoor activities such as swimming, sailing, and hiking. This tranquil area attracts nature lovers and families looking for a peaceful retreat. | Pilsensee lake, Hiking trails, Beach facilities, Nature reserve, Picnic areas |
| Ammersee Promenade | The scenic promenade along Lake Ammersee is ideal for leisurely walks, dining, and enjoying picturesque views. It's a popular spot for visitors and locals alike. | Lake Ammersee, Restaurants and cafes, Water sports, Scenic views, Cycling paths |
| Herrsching Town Center | Charming town center with shops, restaurants, and a vibrant local market. Great for guests wanting to experience local Bavarian culture and amenities. | Local market, Bavarian restaurants, Shopping, Herrschinger Kirche, Cultural events |
| Andechs Monastery | Famous for its monastery and brewery, Andechs attracts many visitors interested in history, religion, and beer culture. A unique cultural experience. | Andechs Monastery, Brewery tours, Hiking routes, Religious sites, Cultural festivals |
| Seehof | A quaint, quiet neighborhood near the lakeside, ideal for families and those looking for a serene environment while being close to Ammersee’s activities. | Lakeside parks, Picnic spots, Family-friendly activities, Quiet streets, Natural beauty |
| Herrsching Beach | Popular beach area at Ammersee that offers swimming and sunbathing, with facilities for younger travelers and groups. | Swimming areas, Beach volleyball, Sun loungers, Restaurants, Permanent event locations |
| Wörthsee | Nearby lake Wörthsee offers a quieter alternative with stunning scenery and outdoor activities, attracting those who appreciate nature and tranquility. | Wörthsee lake, Boating activities, Cycling paths, Fishing spots, Natural parks |
| Bavarian Forest | Close to the picturesque Bavarian Forest, perfect for hiking and exploring nature, offering a fantastic escape into the wilderness. | Hiking trails, Mountain views, Flora and fauna, Natural reserves, Outdoor sports opportunities |
Understanding Airbnb License Requirements & STR Laws in Herrsching am Ammersee (2026)
While Herrsching am Ammersee, Bavaria, Germany currently shows low STR regulations, specific Airbnb license requirements might still exist or change. Always verify the latest short term rental regulations and Airbnb license requirements directly with local government authorities for Herrsching am Ammersee to ensure full compliance before hosting.
(Source: AirROI data, 2026, finding no licensed listings among those analyzed)
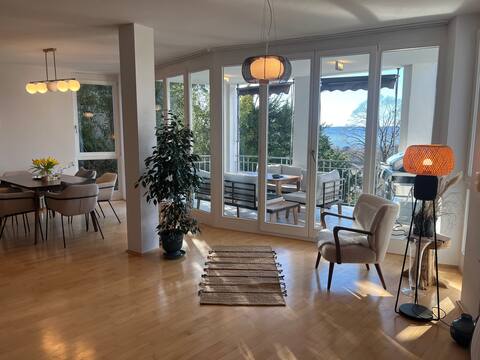
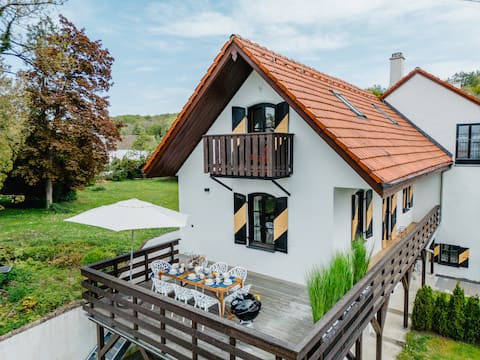
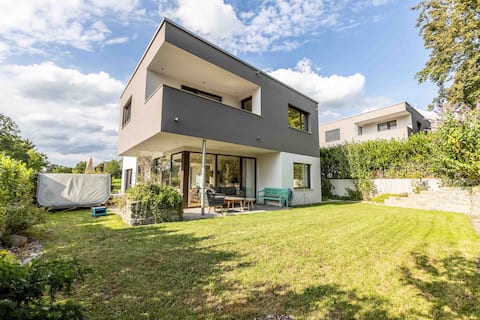
Top Performing Airbnb Properties in Herrsching am Ammersee (2026)
Benchmark your potential! Explore examples of top-performing Airbnb properties in Herrsching am Ammerseebased on Trailing Twelve Month (TTM) revenue. Analyze their characteristics, revenue, occupancy rate, and ADR to understand what drives success in this market.
ღLiBORIA I BBQ Villa Herrsching
Entire Place • 3 bedrooms
Fantastic vacation home with lake view
Entire Place • 5 bedrooms
Lake house with sun terrace for 8 guests
Entire Place • 2 bedrooms
Villa with 200 sqm of living space + balcony + garden + lake access
Entire Place • 3 bedrooms
Country house "FREIRaum"
Entire Place • 4 bedrooms

120m² FamilyFriendly Lake Ammersee Vacation Rental
Entire Place • 3 bedrooms
Note: Performance varies based on location, size, amenities, seasonality, and management quality. Data reflects the past 12 months.
Top Performing Airbnb Hosts in Herrsching am Ammersee (2026)
Learn from the best! This table showcases top-performing Airbnb hosts in Herrsching am Ammersee based on the number of properties managed and estimated total revenue over the past year. Analyze their scale and performance metrics.
| Host Name | Properties | Grossing Revenue | Stay Reviews | Avg Rating |
|---|---|---|---|---|
| Jomo | 3 | $154,083 | 46 | 4.70/5.0 |
| Fabian | 2 | $90,274 | 218 | 4.69/5.0 |
| Manuel | 2 | $78,515 | 24 | 5.00/5.0 |
| Carl-Ferdinand | 1 | $68,493 | 39 | 4.82/5.0 |
| Stephie & Viktor | 3 | $64,809 | 7 | 4.75/5.0 |
| Barbara | 2 | $63,137 | 24 | 4.80/5.0 |
| Annika | 2 | $60,172 | 31 | 4.94/5.0 |
| Keyone | 1 | $52,696 | 6 | 4.33/5.0 |
| Ulrike | 1 | $49,362 | 34 | 5.00/5.0 |
| Jürgen | 1 | $48,058 | 51 | 4.98/5.0 |
Analyzing the strategies of top hosts, such as their property selection, pricing, and guest communication, can offer valuable lessons for optimizing your own Airbnb operations in Herrsching am Ammersee.
Dive Deeper: Advanced Herrsching am Ammersee STR Market Data (2026)
Ready to unlock more insights? AirROI provides access to advanced metrics and comprehensive Airbnb data for Herrsching am Ammersee. Explore detailed analytics beyond this report to refine your investment strategy, optimize pricing, and maximize your vacation rental profits.
Explore Advanced MetricsHerrsching am Ammersee Short-Term Rental Market Composition (2026): Property & Room Types
Room Type Distribution
Property Type Distribution
Market Composition Insights for Herrsching am Ammersee
- The Herrsching am Ammersee Airbnb market composition is heavily skewed towards Entire Home/Apt listings, which make up 89.4% of the 47 active rentals. This indicates strong guest preference for privacy and space.
- Looking at the property type distribution in Herrsching am Ammersee, Apartment/Condo properties are the most common (66%), reflecting the local real estate landscape.
- Houses represent a significant 29.8% portion, catering likely to families or larger groups.
- Smaller segments like hotel/boutique, others (combined 4.2%) offer potential for unique stay experiences.
Herrsching am Ammersee Airbnb Room Capacity Analysis (2026): Bedroom Distribution
Distribution of Listings by Number of Bedrooms
Room Capacity Insights for Herrsching am Ammersee
- The dominant room capacity in Herrsching am Ammersee is 1 bedroom listings, making up 48.9% of the market. This suggests a strong demand for properties suitable for couples or solo travelers.
- Together, 1 bedroom and 2 bedrooms properties represent 65.9% of the active Airbnb listings in Herrsching am Ammersee, indicating a high concentration in these sizes.
Herrsching am Ammersee Vacation Rental Guest Capacity Trends (2026)
Distribution of Listings by Guest Capacity
Guest Capacity Insights for Herrsching am Ammersee
- The most common guest capacity trend in Herrsching am Ammersee vacation rentals is listings accommodating 2 guests (21.3%). This suggests the primary traveler segment is likely couples or solo travelers.
- Properties designed for 2 guests and 4 guests dominate the Herrsching am Ammersee STR market, accounting for 40.4% of listings.
- 23.4% of properties accommodate 6+ guests, serving the market segment for larger families or group travel in Herrsching am Ammersee.
- On average, properties in Herrsching am Ammersee are equipped to host 3.6 guests.
Herrsching am Ammersee Airbnb Booking Patterns (2026): Available vs. Booked Days
Available Days Distribution
Booked Days Distribution
Booking Pattern Insights for Herrsching am Ammersee
- The most common availability pattern in Herrsching am Ammersee falls within the 181-270 days range, representing 44.7% of listings. This suggests many properties have significant open periods on their calendars.
- Approximately 61.7% of listings show high availability (181+ days open annually), indicating potential for increased bookings or specific owner usage patterns.
- For booked days, the 91-180 days range is most frequent in Herrsching am Ammersee (44.7%), reflecting common guest stay durations or potential owner blocking patterns.
- A notable 40.4% of properties secure long booking periods (181+ days booked per year), highlighting successful long-term rental strategies or significant owner usage.
Herrsching am Ammersee Airbnb Minimum Stay Requirements Analysis
Distribution of Listings by Minimum Night Requirement
1 Night
4 listings
8.5% of total
2 Nights
7 listings
14.9% of total
3 Nights
2 listings
4.3% of total
4-6 Nights
13 listings
27.7% of total
7-29 Nights
1 listings
2.1% of total
30+ Nights
20 listings
42.6% of total
Key Insights
- The most prevalent minimum stay requirement in Herrsching am Ammersee is 30+ Nights, adopted by 42.6% of listings. This highlights the market's preference for longer commitments.
- A significant segment (42.6%) caters to monthly stays (30+ nights) in Herrsching am Ammersee, pointing to opportunities in the extended-stay market.
Recommendations
- Align with the market by considering a 30+ Nights minimum stay, as 42.6% of Herrsching am Ammersee hosts use this setting.
- If feasible, allowing 1-night stays, especially midweek or during low season, could capture last-minute bookings, as only 8.5% currently do.
- Explore offering discounts for stays of 30+ nights to attract the 42.6% of the market seeking extended stays.
- Adjust minimum nights based on seasonality – potentially shorter during low season and longer during peak demand periods in Herrsching am Ammersee.
Herrsching am Ammersee Airbnb Cancellation Policy Trends Analysis (2026)
Super Strict 60 Days
1 listings
2.1% of total
Flexible
9 listings
19.1% of total
Moderate
10 listings
21.3% of total
Firm
23 listings
48.9% of total
Strict
4 listings
8.5% of total
Cancellation Policy Insights for Herrsching am Ammersee
- The prevailing Airbnb cancellation policy trend in Herrsching am Ammersee is Firm, used by 48.9% of listings.
- A majority (57.4%) of hosts in Herrsching am Ammersee utilize Firm or Strict policies, indicating a market where hosts prioritize booking security.
- Strict cancellation policies are quite rare (8.5%), potentially making listings with this policy less competitive unless justified by high demand or property type.
Recommendations for Hosts
- Consider adopting a Firm policy to align with the 48.9% market standard in Herrsching am Ammersee.
- Using a Strict policy might deter some guests, as only 8.5% of listings use it. Evaluate if potential revenue protection outweighs possible lower booking rates.
- Regularly review your cancellation policy against competitors and market demand shifts in Herrsching am Ammersee.
Herrsching am Ammersee STR Booking Lead Time Analysis (2026)
Average Booking Lead Time by Month
Booking Lead Time Insights for Herrsching am Ammersee
- The overall average booking lead time for vacation rentals in Herrsching am Ammersee is 77 days.
- Guests book furthest in advance for stays during August (average 115 days), likely coinciding with peak travel demand or local events.
- The shortest booking windows occur for stays in March (average 31 days), indicating more last-minute travel plans during this time.
- Seasonally, Summer (102 days avg.) sees the longest lead times, while Winter (52 days avg.) has the shortest, reflecting typical travel planning cycles.
Recommendations for Hosts
- Use the overall average lead time (77 days) as a baseline for your pricing and availability strategy in Herrsching am Ammersee.
- For August stays, consider implementing length-of-stay discounts or slightly higher rates for bookings made less than 115 days out to capitalize on advance planning.
- Target marketing efforts for the Summer season well in advance (at least 102 days) to capture early planners.
- Monitor your own booking lead times against these Herrsching am Ammersee averages to identify opportunities for dynamic pricing adjustments.
Popular & Essential Airbnb Amenities in Herrsching am Ammersee (2026)
Amenity Prevalence
Amenity Insights for Herrsching am Ammersee
- Essential amenities in Herrsching am Ammersee that guests expect include: Wifi, Heating, Smoke alarm. Lacking these (any) could significantly impact bookings.
- Popular amenities like Hair dryer, Refrigerator, Hot water are common but not universal. Offering these can provide a competitive edge.
Recommendations for Hosts
- Ensure your listing includes all essential amenities for Herrsching am Ammersee: Wifi, Heating, Smoke alarm.
- Prioritize adding missing essentials: Heating, Smoke alarm.
- Consider adding popular differentiators like Hair dryer or Refrigerator to increase appeal.
- Highlight unique or less common amenities you offer (e.g., hot tub, dedicated workspace, EV charger) in your listing description and photos.
- Regularly check competitor amenities in Herrsching am Ammersee to stay competitive.
Herrsching am Ammersee Airbnb Guest Demographics & Profile Analysis (2026)
Guest Profile Summary for Herrsching am Ammersee
- The typical guest profile for Airbnb in Herrsching am Ammersee consists of primarily domestic travelers (69%), often arriving from nearby Munich, typically belonging to the Post-2000s (Gen Z/Alpha) group (50%), primarily speaking English or German.
- Domestic travelers account for 69.0% of guests.
- Key international markets include Germany (69%) and United States (6.3%).
- Top languages spoken are English (38.9%) followed by German (33.3%).
- A significant demographic segment is the Post-2000s (Gen Z/Alpha) group, representing 50% of guests.
Recommendations for Hosts
- Target domestic marketing efforts towards travelers from Munich and Berlin.
- Tailor amenities and listing descriptions to appeal to the dominant Post-2000s (Gen Z/Alpha) demographic (e.g., highlight fast WiFi, smart home features, local guides).
- Highlight unique local experiences or amenities relevant to the primary guest profile.
- Consider seasonal promotions aligned with peak travel times for key origin markets.
Nearby Short-Term Rental Market Comparison
How does the Herrsching am Ammersee Airbnb market stack up against its neighbors? Compare key performance metrics like average monthly revenue, ADR, and occupancy rates in surrounding areas to understand the broader regional STR landscape.
| Market | Active Properties | Monthly Revenue | Daily Rate | Avg. Occupancy |
|---|---|---|---|---|
| Scheffau am Wilden Kaiser | 12 | $6,669 | $906.83 | 30% |
| Balderschwang | 10 | $5,253 | $304.03 | 58% |
| Going am Wilden Kaiser | 27 | $3,596 | $406.50 | 37% |
| Kramsach | 12 | $3,573 | $272.32 | 48% |
| Bayrischzell | 41 | $3,550 | $389.91 | 33% |
| Krimml | 53 | $3,544 | $359.14 | 41% |
| Reith bei Kitzbühel | 49 | $3,385 | $356.25 | 34% |
| Stans | 12 | $3,115 | $255.48 | 43% |
| Pfafflar | 11 | $3,053 | $255.26 | 50% |
| Thaur | 12 | $2,954 | $152.36 | 69% |