Heroldsberg Airbnb Market Analysis 2025: Short Term Rental Data & Vacation Rental Statistics in Bavaria, Germany
Is Airbnb profitable in Heroldsberg in 2025? Explore comprehensive Airbnb analytics for Heroldsberg, Bavaria, Germany to uncover income potential. This 2025 STR market report for Heroldsberg, based on AirROI data from November 2024 to October 2025, reveals key trends in the niche market of 18 active listings.
Whether you're considering an Airbnb investment in Heroldsberg, optimizing your existing vacation rental, or exploring rental arbitrage opportunities, understanding the Heroldsberg Airbnb data is crucial. Leveraging the low regulation environment is key to maximizing your short term rental income potential. Let's dive into the specifics.
Key Heroldsberg Airbnb Performance Metrics Overview
Monthly Airbnb Revenue Variations & Income Potential in Heroldsberg (2025)
Understanding the monthly revenue variations for Airbnb listings in Heroldsberg is key to maximizing your short term rental income potential. Seasonality significantly impacts earnings. Our analysis, based on data from the past 12 months, shows that the peak revenue month for STRs in Heroldsberg is typically February, while January often presents the lowest earnings, highlighting opportunities for strategic pricing adjustments during shoulder and low seasons. Explore the typical Airbnb income in Heroldsberg across different performance tiers:
- Best-in-class properties (Top 10%) achieve $3,596+ monthly, often utilizing dynamic pricing and superior guest experiences.
- Strong performing properties (Top 25%) earn $1,952 or more, indicating effective management and desirable locations/amenities.
- Typical properties (Median) generate around $854 per month, representing the average market performance.
- Entry-level properties (Bottom 25%) see earnings around $500, often with potential for optimization.
Average Monthly Airbnb Earnings Trend in Heroldsberg
Heroldsberg Airbnb Occupancy Rate Trends (2025)
Maximize your bookings by understanding the Heroldsberg STR occupancy trends. Seasonal demand shifts significantly influence how often properties are booked. Typically, Februarysees the highest demand (peak season occupancy), while April experiences the lowest (low season). Effective strategies, like adjusting minimum stays or offering promotions, can boost occupancy during slower periods. Here's how different property tiers perform in Heroldsberg:
- Best-in-class properties (Top 10%) achieve 78%+ occupancy, indicating high desirability and potentially optimized availability.
- Strong performing properties (Top 25%) maintain 63% or higher occupancy, suggesting good market fit and guest satisfaction.
- Typical properties (Median) have an occupancy rate around 42%.
- Entry-level properties (Bottom 25%) average 26% occupancy, potentially facing higher vacancy.
Average Monthly Occupancy Rate Trend in Heroldsberg
Average Daily Rate (ADR) Airbnb Trends in Heroldsberg (2025)
Effective short term rental pricing strategy in Heroldsberg involves understanding monthly ADR fluctuations. The Average Daily Rate (ADR) for Airbnb in Heroldsberg typically peaks in June and dips lowest during January. Leveraging Airbnb dynamic pricing tools or strategies based on this seasonality can significantly boost revenue. Here's a look at the typical nightly rates achieved:
- Best-in-class properties (Top 10%) command rates of $200+ per night, often due to premium features or locations.
- Strong performing properties (Top 25%) achieve nightly rates of $106 or more.
- Typical properties (Median) charge around $75 per night.
- Entry-level properties (Bottom 25%) earn around $52 per night.
Average Daily Rate (ADR) Trend by Month in Heroldsberg
Get Live Heroldsberg Market Intelligence 👇
Explore Real-time Analytics
Airbnb Seasonality Analysis & Trends in Heroldsberg (2025)
Peak Season (February, March, October)
- Revenue averages $1,928 per month
- Occupancy rates average 57.3%
- Daily rates average $92
Shoulder Season
- Revenue averages $1,511 per month
- Occupancy maintains around 43.0%
- Daily rates hold near $95
Low Season (January, November, December)
- Revenue drops to average $1,136 per month
- Occupancy decreases to average 36.7%
- Daily rates adjust to average $91
Seasonality Insights for Heroldsberg
- The Airbnb seasonality in Heroldsberg shows highly seasonal trends requiring careful strategy. While the sections above show seasonal averages, it's also insightful to look at the extremes:
- During the high season, the absolute peak month showcases Heroldsberg's highest earning potential, with monthly revenues capable of climbing to $2,173, occupancy reaching a high of 68.7%, and ADRs peaking at $98.
- Conversely, the slowest single month of the year, typically falling within the low season, marks the market's lowest point. In this month, revenue might dip to $1,048, occupancy could drop to 33.3%, and ADRs may adjust down to $90.
- Understanding both the seasonal averages and these monthly peaks and troughs in revenue, occupancy, and ADR is crucial for maximizing your Airbnb profit potential in Heroldsberg.
Seasonal Strategies for Maximizing Profit
- Peak Season: Maximize revenue through premium pricing and potentially longer minimum stays. Ensure high availability.
- Low Season: Offer competitive pricing, special promotions (e.g., extended stay discounts), and flexible cancellation policies. Target off-season travelers like remote workers or budget-conscious guests.
- Shoulder Seasons: Implement dynamic pricing that balances peak and low rates. Target weekend travelers or specific events. Offer slightly more flexible terms than peak season.
- Regularly analyze your own performance against these Heroldsberg seasonality benchmarks and adjust your pricing and availability strategy accordingly.
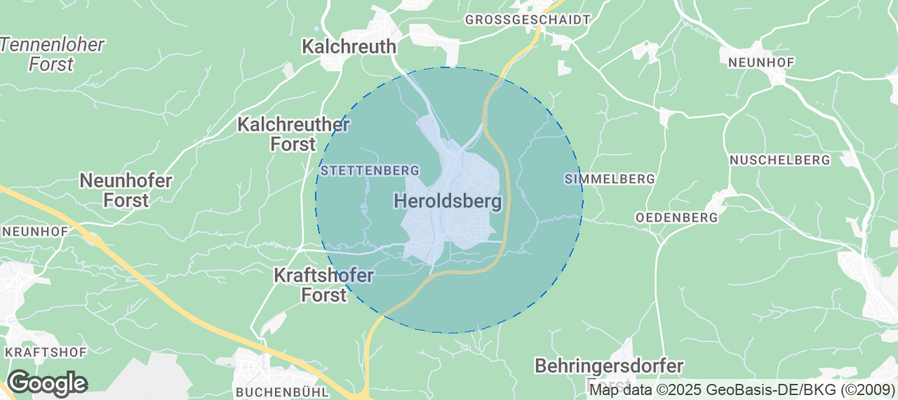
Best Areas for Airbnb Investment in Heroldsberg (2025)
Exploring the top neighborhoods for short-term rentals in Heroldsberg? This section highlights key areas, outlining why they are attractive for hosts and guests, along with notable local attractions. Consider these locations based on your target guest profile and investment strategy.
| Neighborhood / Area | Why Host Here? (Target Guests & Appeal) | Key Attractions & Landmarks |
|---|---|---|
| Heroldsberg Town Center | The central area of Heroldsberg offers easy access to local shops, cafes, and cultural sites. Ideal for travelers wanting to immerse themselves in the local Bavarian lifestyle and community. | St. John's Church, Historical Town Hall, Local markets, Restaurants and Biergarten, Nearby Nuremberg city attractions |
| Nuremberg's Old Town | Just a short drive away, Nuremberg's historic Old Town is famous for its medieval architecture, museums, and vibrant atmosphere. Perfect for guests who enjoy history and culture. | Nuremberg Castle, Albrecht Dürer's House, Nuremberg Christkindlesmarkt, German National Museum, St. Sebaldus Church |
| Franconian Switzerland | Known for its stunning landscapes, hiking trails, and charming villages, this area attracts nature lovers and those seeking outdoor activities during their stay. | Burg Rabenstein, Hiking trails, Scenic views, Brewery tours, Local wineries |
| Bavarian Forest | Ideal for guests who love nature, the Bavarian Forest offers various outdoor activities, including hiking and skiing, making it a year-round destination. | National Park Bavarian Forest, Hiking routes, Ski resorts, Wildlife watching, Scenic cycling paths |
| Furth | A neighboring city with a growing economy and evolving cultural scene. Suitable for business travelers due to its commercial activities and accessibility to Nuremberg. | Local shopping, Furth's botanical garden, Transportation hub, Entertainment venues, Cafes and restaurants |
| Erlangen | A lively university town known for its youthful vibe and cultural events. Attracts students and visitors to its numerous festivals and activities throughout the year. | Botanical Garden, University of Erlangen-Nuremberg, Historical buildings, Local beer gardens, Erlangen's annual Bergkirchweih festival |
| Pegnitz Valley | A picturesque valley known for its rich natural beauty and outdoor activities. Popular among those looking for a serene and scenic getaway. | Hiking and biking trails, Nearby wineries, Historical towns, Cultural festivals, Riverside walks |
| Schwaig | A quiet suburb with the charm of a small town, Schwaig offers a peaceful stay close to the hustle and bustle of the larger cities while still providing local amenities. | Local parks, Easy access to Nuremberg airport, Traditional Bavarian restaurants, Shops and markets, Community events |
Understanding Airbnb License Requirements & STR Laws in Heroldsberg (2025)
While Heroldsberg, Bavaria, Germany currently shows low STR regulations, specific Airbnb license requirements might still exist or change. Always verify the latest short term rental regulations and Airbnb license requirements directly with local government authorities for Heroldsberg to ensure full compliance before hosting.
(Source: AirROI data, 2025, finding no licensed listings among those analyzed)
Top Performing Airbnb Properties in Heroldsberg (2025)
Benchmark your potential! Explore examples of top-performing Airbnb properties in Heroldsbergbased on Trailing Twelve Month (TTM) revenue. Analyze their characteristics, revenue, occupancy rate, and ADR to understand what drives success in this market.
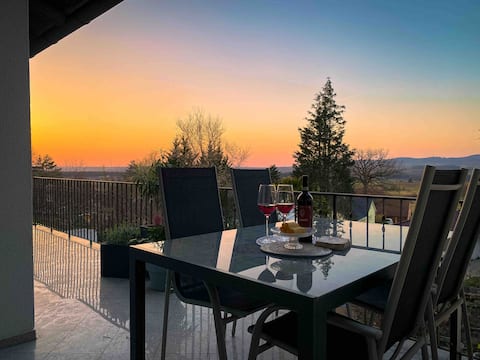
Vacation rental Weitsicht 140 sqm, exclusive, full privacy
Entire Place • 3 bedrooms
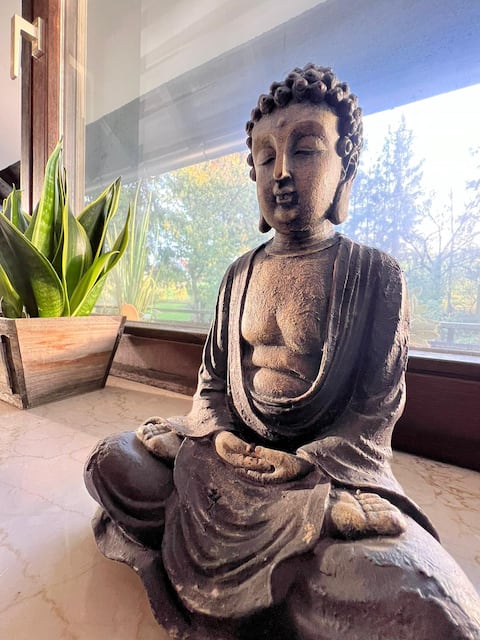
Apartment in an absolutely quiet location
Entire Place • 3 bedrooms
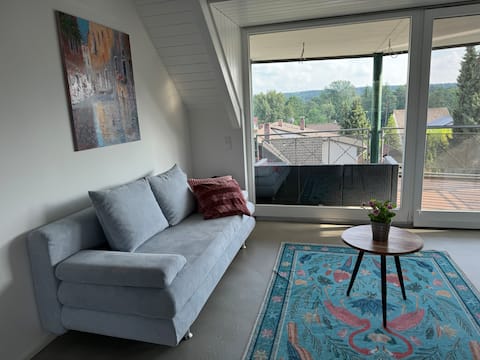
Attic apartment
Entire Place • 2 bedrooms
Suserl's vacation home
Entire Place • 4 bedrooms
Holiday flat in unique Solar house
Entire Place • 1 bedroom
Private room in an absolutely quiet location
Private Room • N/A
Note: Performance varies based on location, size, amenities, seasonality, and management quality. Data reflects the past 12 months.
Top Performing Airbnb Hosts in Heroldsberg (2025)
Learn from the best! This table showcases top-performing Airbnb hosts in Heroldsberg based on the number of properties managed and estimated total revenue over the past year. Analyze their scale and performance metrics.
| Host Name | Properties | Grossing Revenue | Stay Reviews | Avg Rating |
|---|---|---|---|---|
| Ivonne | 1 | $62,012 | 93 | 4.92/5.0 |
| Martina | 4 | $59,230 | 146 | 4.98/5.0 |
| Friederike | 1 | $24,331 | 28 | 4.89/5.0 |
| Susanne | 1 | $18,678 | 67 | 4.99/5.0 |
| Michael Und Uschi | 2 | $18,512 | 106 | 4.89/5.0 |
| Gerhard | 2 | $11,081 | 41 | 4.98/5.0 |
| Daniel | 1 | $6,783 | 42 | 5.00/5.0 |
| Shana | 1 | $6,560 | 68 | 4.75/5.0 |
| Moshe | 1 | $2,722 | 5 | 4.80/5.0 |
| Karin | 1 | $2,409 | 4 | 5.00/5.0 |
Analyzing the strategies of top hosts, such as their property selection, pricing, and guest communication, can offer valuable lessons for optimizing your own Airbnb operations in Heroldsberg.
Dive Deeper: Advanced Heroldsberg STR Market Data (2025)
Ready to unlock more insights? AirROI provides access to advanced metrics and comprehensive Airbnb data for Heroldsberg. Explore detailed analytics beyond this report to refine your investment strategy, optimize pricing, and maximize your vacation rental profits.
Explore Advanced MetricsHeroldsberg Short-Term Rental Market Composition (2025): Property & Room Types
Room Type Distribution
Property Type Distribution
Market Composition Insights for Heroldsberg
- The Heroldsberg Airbnb market composition is heavily skewed towards Entire Home/Apt listings, which make up 61.1% of the 18 active rentals. This indicates strong guest preference for privacy and space.
- However, a notable 38.9% share for Private Rooms suggests opportunities for budget-conscious travelers or hosts renting out spare rooms.
- Looking at the property type distribution in Heroldsberg, Apartment/Condo properties are the most common (61.1%), reflecting the local real estate landscape.
- Houses represent a significant 38.9% portion, catering likely to families or larger groups.
Heroldsberg Airbnb Room Capacity Analysis (2025): Bedroom Distribution
Distribution of Listings by Number of Bedrooms
Room Capacity Insights for Heroldsberg
- The dominant room capacity in Heroldsberg is 1 bedroom listings, making up 33.3% of the market. This suggests a strong demand for properties suitable for couples or solo travelers.
- Together, 1 bedroom and 2 bedrooms properties represent 50.0% of the active Airbnb listings in Heroldsberg, indicating a high concentration in these sizes.
Heroldsberg Vacation Rental Guest Capacity Trends (2025)
Distribution of Listings by Guest Capacity
Guest Capacity Insights for Heroldsberg
- The most common guest capacity trend in Heroldsberg vacation rentals is listings accommodating 3 guests (16.7%). This suggests the primary traveler segment is likely small families or groups.
- Properties designed for 3 guests and 6 guests dominate the Heroldsberg STR market, accounting for 33.4% of listings.
- 16.7% of properties accommodate 6+ guests, serving the market segment for larger families or group travel in Heroldsberg.
- On average, properties in Heroldsberg are equipped to host 2.6 guests.
Heroldsberg Airbnb Booking Patterns (2025): Available vs. Booked Days
Available Days Distribution
Booked Days Distribution
Booking Pattern Insights for Heroldsberg
- The most common availability pattern in Heroldsberg falls within the 271-366 days range, representing 55.6% of listings. This suggests many properties have significant open periods on their calendars.
- Approximately 72.3% of listings show high availability (181+ days open annually), indicating potential for increased bookings or specific owner usage patterns.
- For booked days, the 181-270 days range is most frequent in Heroldsberg (33.3%), reflecting common guest stay durations or potential owner blocking patterns.
- A notable 33.3% of properties secure long booking periods (181+ days booked per year), highlighting successful long-term rental strategies or significant owner usage.
Heroldsberg Airbnb Minimum Stay Requirements Analysis
Distribution of Listings by Minimum Night Requirement
1 Night
4 listings
22.2% of total
2 Nights
9 listings
50% of total
3 Nights
1 listings
5.6% of total
30+ Nights
4 listings
22.2% of total
Key Insights
- The most prevalent minimum stay requirement in Heroldsberg is 2 Nights, adopted by 50% of listings. This highlights the market's preference for shorter, flexible bookings.
- A strong majority (72.2%) of the Heroldsberg Airbnb data shows acceptance of very short stays (1-2 nights), indicating a dynamic, high-turnover market.
- A significant segment (22.2%) caters to monthly stays (30+ nights) in Heroldsberg, pointing to opportunities in the extended-stay market.
Recommendations
- Align with the market by considering a 2 Nights minimum stay, as 50% of Heroldsberg hosts use this setting.
- If feasible, allowing 1-night stays, especially midweek or during low season, could capture last-minute bookings, as only 22.2% currently do.
- Explore offering discounts for stays of 30+ nights to attract the 22.2% of the market seeking extended stays.
- Adjust minimum nights based on seasonality – potentially shorter during low season and longer during peak demand periods in Heroldsberg.
Heroldsberg Airbnb Cancellation Policy Trends Analysis (2025)
Flexible
9 listings
50% of total
Moderate
7 listings
38.9% of total
Firm
2 listings
11.1% of total
Cancellation Policy Insights for Heroldsberg
- The prevailing Airbnb cancellation policy trend in Heroldsberg is Flexible, used by 50% of listings.
- The market strongly favors guest-friendly terms, with 88.9% of listings offering Flexible or Moderate policies. This suggests guests in Heroldsberg may expect booking flexibility.
Recommendations for Hosts
- Consider adopting a Flexible policy to align with the 50% market standard in Heroldsberg.
- Regularly review your cancellation policy against competitors and market demand shifts in Heroldsberg.
Heroldsberg STR Booking Lead Time Analysis (2025)
Average Booking Lead Time by Month
Booking Lead Time Insights for Heroldsberg
- The overall average booking lead time for vacation rentals in Heroldsberg is 54 days.
- Guests book furthest in advance for stays during May (average 113 days), likely coinciding with peak travel demand or local events.
- The shortest booking windows occur for stays in September (average 47 days), indicating more last-minute travel plans during this time.
- Seasonally, Spring (83 days avg.) sees the longest lead times, while Fall (55 days avg.) has the shortest, reflecting typical travel planning cycles.
Recommendations for Hosts
- Use the overall average lead time (54 days) as a baseline for your pricing and availability strategy in Heroldsberg.
- For May stays, consider implementing length-of-stay discounts or slightly higher rates for bookings made less than 113 days out to capitalize on advance planning.
- Target marketing efforts for the Spring season well in advance (at least 83 days) to capture early planners.
- Monitor your own booking lead times against these Heroldsberg averages to identify opportunities for dynamic pricing adjustments.
Popular & Essential Airbnb Amenities in Heroldsberg (2025)
Amenity Prevalence
Amenity Insights for Heroldsberg
- Essential amenities in Heroldsberg that guests expect include: Heating, Dishes and silverware, Hot water, Wifi, Essentials, Bed linens. Lacking these (any) could significantly impact bookings.
- Popular amenities like Refrigerator, Hot water kettle, Cooking basics are common but not universal. Offering these can provide a competitive edge.
Recommendations for Hosts
- Ensure your listing includes all essential amenities for Heroldsberg: Heating, Dishes and silverware, Hot water, Wifi, Essentials, Bed linens.
- Consider adding popular differentiators like Refrigerator or Hot water kettle to increase appeal.
- Highlight unique or less common amenities you offer (e.g., hot tub, dedicated workspace, EV charger) in your listing description and photos.
- Regularly check competitor amenities in Heroldsberg to stay competitive.
Heroldsberg Airbnb Guest Demographics & Profile Analysis (2025)
Guest Profile Summary for Heroldsberg
- The typical guest profile for Airbnb in Heroldsberg consists of a mix of domestic (62%) and international guests, often arriving from nearby Nuremberg, typically belonging to the Post-2000s (Gen Z/Alpha) group (50%), primarily speaking English or German.
- Domestic travelers account for 61.7% of guests.
- Key international markets include Germany (61.7%) and United States (8.3%).
- Top languages spoken are English (44.4%) followed by German (30.6%).
- A significant demographic segment is the Post-2000s (Gen Z/Alpha) group, representing 50% of guests.
Recommendations for Hosts
- Target domestic marketing efforts towards travelers from Nuremberg and Hellenthal.
- Tailor amenities and listing descriptions to appeal to the dominant Post-2000s (Gen Z/Alpha) demographic (e.g., highlight fast WiFi, smart home features, local guides).
- Highlight unique local experiences or amenities relevant to the primary guest profile.
- Consider seasonal promotions aligned with peak travel times for key origin markets.
Nearby Short-Term Rental Market Comparison
How does the Heroldsberg Airbnb market stack up against its neighbors? Compare key performance metrics like average monthly revenue, ADR, and occupancy rates in surrounding areas to understand the broader regional STR landscape.
| Market | Active Properties | Monthly Revenue | Daily Rate | Avg. Occupancy |
|---|---|---|---|---|
| Unterschleißheim | 17 | $2,854 | $155.75 | 56% |
| Pfaffenhofen an der Ilm | 12 | $2,784 | $195.70 | 45% |
| Poing | 19 | $2,579 | $162.64 | 54% |
| Dachau | 36 | $2,346 | $154.61 | 50% |
| Herrsching am Ammersee | 48 | $2,329 | $183.81 | 52% |
| Kollnburg | 12 | $2,327 | $277.59 | 29% |
| Gauting | 33 | $2,235 | $161.83 | 48% |
| Oberschleißheim | 24 | $2,140 | $137.46 | 58% |
| Starnberg | 53 | $1,975 | $166.15 | 46% |
| Allersberg | 12 | $1,925 | $211.53 | 37% |