Hallbergmoos Airbnb Market Analysis 2026: Short Term Rental Data & Vacation Rental Statistics in Bavaria, Germany
Is Airbnb profitable in Hallbergmoos in 2026? Explore comprehensive Airbnb analytics for Hallbergmoos, Bavaria, Germany to uncover income potential. This 2026 STR market report for Hallbergmoos, based on AirROI data from February 2025 to January 2026, reveals key trends in the niche market of 20 active listings.
Whether you're considering an Airbnb investment in Hallbergmoos, optimizing your existing vacation rental, or exploring rental arbitrage opportunities, understanding the Hallbergmoos Airbnb data is crucial. Leveraging the low regulation environment is key to maximizing your short term rental income potential. Let's dive into the specifics.
Key Hallbergmoos Airbnb Performance Metrics Overview
Monthly Airbnb Revenue Variations & Income Potential in Hallbergmoos (2026)
Understanding the monthly revenue variations for Airbnb listings in Hallbergmoos is key to maximizing your short term rental income potential. Seasonality significantly impacts earnings. Our analysis, based on data from the past 12 months, shows that the peak revenue month for STRs in Hallbergmoos is typically September, while January often presents the lowest earnings, highlighting opportunities for strategic pricing adjustments during shoulder and low seasons. Explore the typical Airbnb income in Hallbergmoos across different performance tiers:
- Best-in-class properties (Top 10%) achieve $3,069+ monthly, often utilizing dynamic pricing and superior guest experiences.
- Strong performing properties (Top 25%) earn $1,804 or more, indicating effective management and desirable locations/amenities.
- Typical properties (Median) generate around $1,118 per month, representing the average market performance.
- Entry-level properties (Bottom 25%) see earnings around $574, often with potential for optimization.
Average Monthly Airbnb Earnings Trend in Hallbergmoos
Hallbergmoos Airbnb Occupancy Rate Trends (2026)
Maximize your bookings by understanding the Hallbergmoos STR occupancy trends. Seasonal demand shifts significantly influence how often properties are booked. Typically, Aprilsees the highest demand (peak season occupancy), while January experiences the lowest (low season). Effective strategies, like adjusting minimum stays or offering promotions, can boost occupancy during slower periods. Here's how different property tiers perform in Hallbergmoos:
- Best-in-class properties (Top 10%) achieve 84%+ occupancy, indicating high desirability and potentially optimized availability.
- Strong performing properties (Top 25%) maintain 75% or higher occupancy, suggesting good market fit and guest satisfaction.
- Typical properties (Median) have an occupancy rate around 48%.
- Entry-level properties (Bottom 25%) average 29% occupancy, potentially facing higher vacancy.
Average Monthly Occupancy Rate Trend in Hallbergmoos
Average Daily Rate (ADR) Airbnb Trends in Hallbergmoos (2026)
Effective short term rental pricing strategy in Hallbergmoos involves understanding monthly ADR fluctuations. The Average Daily Rate (ADR) for Airbnb in Hallbergmoos typically peaks in September and dips lowest during February. Leveraging Airbnb dynamic pricing tools or strategies based on this seasonality can significantly boost revenue. Here's a look at the typical nightly rates achieved:
- Best-in-class properties (Top 10%) command rates of $211+ per night, often due to premium features or locations.
- Strong performing properties (Top 25%) achieve nightly rates of $114 or more.
- Typical properties (Median) charge around $65 per night.
- Entry-level properties (Bottom 25%) earn around $52 per night.
Average Daily Rate (ADR) Trend by Month in Hallbergmoos
Get Live Hallbergmoos Market Intelligence 👇

Explore Real-time Analytics
Airbnb Seasonality Analysis & Trends in Hallbergmoos (2026)
Peak Season (September, August, October)
- Revenue averages $1,820 per month
- Occupancy rates average 59.6%
- Daily rates average $109
Shoulder Season
- Revenue averages $1,374 per month
- Occupancy maintains around 50.7%
- Daily rates hold near $93
Low Season (January, February, November)
- Revenue drops to average $911 per month
- Occupancy decreases to average 40.3%
- Daily rates adjust to average $91
Seasonality Insights for Hallbergmoos
- The Airbnb seasonality in Hallbergmoos shows highly seasonal trends requiring careful strategy. While the sections above show seasonal averages, it's also insightful to look at the extremes:
- During the high season, the absolute peak month showcases Hallbergmoos's highest earning potential, with monthly revenues capable of climbing to $1,899, occupancy reaching a high of 65.1%, and ADRs peaking at $121.
- Conversely, the slowest single month of the year, typically falling within the low season, marks the market's lowest point. In this month, revenue might dip to $848, occupancy could drop to 35.3%, and ADRs may adjust down to $81.
- Understanding both the seasonal averages and these monthly peaks and troughs in revenue, occupancy, and ADR is crucial for maximizing your Airbnb profit potential in Hallbergmoos.
Seasonal Strategies for Maximizing Profit
- Peak Season: Maximize revenue through premium pricing and potentially longer minimum stays. Ensure high availability.
- Low Season: Offer competitive pricing, special promotions (e.g., extended stay discounts), and flexible cancellation policies. Target off-season travelers like remote workers or budget-conscious guests.
- Shoulder Seasons: Implement dynamic pricing that balances peak and low rates. Target weekend travelers or specific events. Offer slightly more flexible terms than peak season.
- Regularly analyze your own performance against these Hallbergmoos seasonality benchmarks and adjust your pricing and availability strategy accordingly.
Best Areas for Airbnb Investment in Hallbergmoos (2026)
Exploring the top neighborhoods for short-term rentals in Hallbergmoos? This section highlights key areas, outlining why they are attractive for hosts and guests, along with notable local attractions. Consider these locations based on your target guest profile and investment strategy.
| Neighborhood / Area | Why Host Here? (Target Guests & Appeal) | Key Attractions & Landmarks |
|---|---|---|
| Hallbergmoos Town Center | The heart of Hallbergmoos, easily accessible and close to shops, restaurants, and local amenities. Ideal for guests wanting to explore the town and enjoy a local experience. | Local shops, Restaurants, Hallbergmoos Park |
| Munich Airport Area | Close proximity to Munich Airport makes this area a great choice for international travelers. Ideal for short stays and layovers, plus it offers various accommodation options. | Munich Airport, Local eateries, Transport links to Munich |
| English Garden in Munich | One of the largest urban parks in the world, close enough to Hallbergmoos. Attracts tourists and locals alike for leisure activities. Popular among visitors for its scenic beauty. | Englischer Garten, Biergarten, Chinese Tower |
| Freising | Historic town with beautiful architecture and rich culture. Attracts visitors seeking historical experiences and is just a short distance from Hallbergmoos. | Freising Cathedral, Weihenstephan Brewery, Vikings in Freising |
| Erding | Home to the famous Erdinger Brewery and a large thermal spa. This area is popular with tourists seeking relaxation and local beer culture. | Erdinger Brewery, Therme Erding, Historical Old Town |
| Dachau Concentration Camp Memorial Site | A significant historical site that attracts visitors from around the world. Important for educational tourism. | Dachau Memorial Site, Documentation Center, Local restaurants offering cuisine |
| Bad Tölz | A charming town known for its beautiful architecture and scenic surroundings. Good for guests seeking a picturesque destination away from the city bustle. | Isar River, Historic market street, Spa facilities |
| Starnberger See | A stunning lake area popular for outdoor activities and leisure. Attractive to those wanting nature experiences, just a short drive from Hallbergmoos. | Starnberger Lake, Hiking trails, Water sports |
Understanding Airbnb License Requirements & STR Laws in Hallbergmoos (2026)
While Hallbergmoos, Bavaria, Germany currently shows low STR regulations, specific Airbnb license requirements might still exist or change. Always verify the latest short term rental regulations and Airbnb license requirements directly with local government authorities for Hallbergmoos to ensure full compliance before hosting.
(Source: AirROI data, 2026, finding no licensed listings among those analyzed)
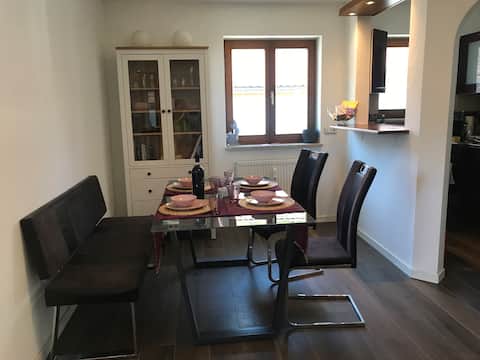
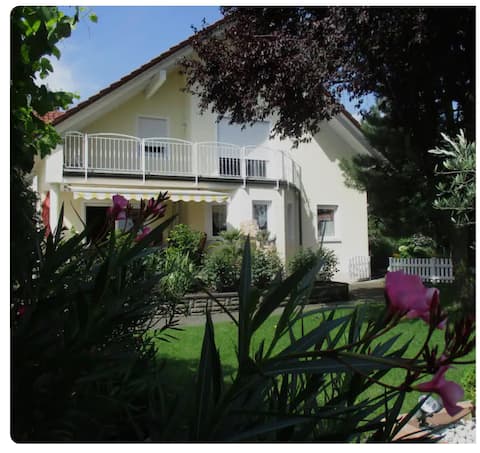
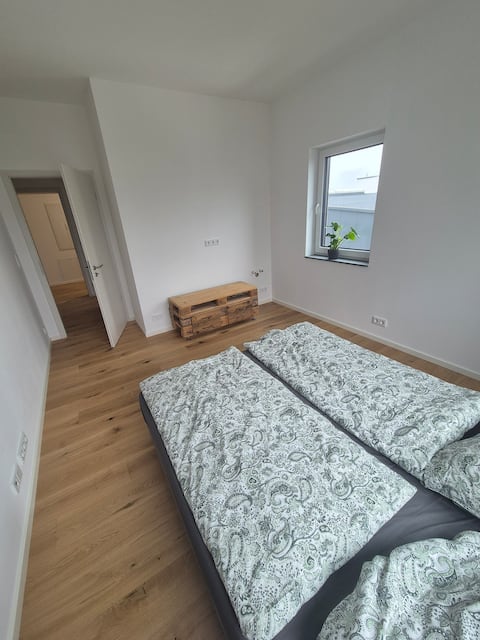
Top Performing Airbnb Properties in Hallbergmoos (2026)
Benchmark your potential! Explore examples of top-performing Airbnb properties in Hallbergmoosbased on Trailing Twelve Month (TTM) revenue. Analyze their characteristics, revenue, occupancy rate, and ADR to understand what drives success in this market.

raum.life – Design Apartment in Hallbergmoos
Private Room • 2 bedrooms

Spacious 4-room apartment
Entire Place • 3 bedrooms
60 sqm garden apartment near Munich
Entire Place • 1 bedroom

💚 Lovingly and luxuriously "Ferienglück Goldach" 💚
Entire Place • 1 bedroom
Modern 2 Zimmerappartement
Entire Place • 1 bedroom
Comfortable sleeping place
Entire Place • 1 bedroom
Note: Performance varies based on location, size, amenities, seasonality, and management quality. Data reflects the past 12 months.
Top Performing Airbnb Hosts in Hallbergmoos (2026)
Learn from the best! This table showcases top-performing Airbnb hosts in Hallbergmoos based on the number of properties managed and estimated total revenue over the past year. Analyze their scale and performance metrics.
| Host Name | Properties | Grossing Revenue | Stay Reviews | Avg Rating |
|---|---|---|---|---|
| Astrid | 8 | $49,518 | 890 | 4.50/5.0 |
| Paul | 1 | $44,651 | 36 | 4.78/5.0 |
| Perihan | 1 | $32,946 | 109 | 4.84/5.0 |
| Alexa | 1 | $24,170 | 43 | 4.86/5.0 |
| Martin | 1 | $22,520 | 96 | 4.98/5.0 |
| Susi Und Markus | 1 | $20,220 | 178 | 4.87/5.0 |
| Jürgen | 1 | $19,726 | 110 | 4.92/5.0 |
| Vera | 2 | $17,425 | 736 | 4.97/5.0 |
| Sonja Und Lutz | 2 | $17,057 | 904 | 4.88/5.0 |
| Tim | 1 | $9,894 | 4 | 4.75/5.0 |
Analyzing the strategies of top hosts, such as their property selection, pricing, and guest communication, can offer valuable lessons for optimizing your own Airbnb operations in Hallbergmoos.
Dive Deeper: Advanced Hallbergmoos STR Market Data (2026)
Ready to unlock more insights? AirROI provides access to advanced metrics and comprehensive Airbnb data for Hallbergmoos. Explore detailed analytics beyond this report to refine your investment strategy, optimize pricing, and maximize your vacation rental profits.
Explore Advanced MetricsHallbergmoos Short-Term Rental Market Composition (2026): Property & Room Types
Room Type Distribution
Property Type Distribution
Market Composition Insights for Hallbergmoos
- The Hallbergmoos Airbnb market composition is heavily skewed towards Private Room listings, which make up 55% of the 20 active rentals. This indicates strong guest preference for privacy and space.
- Looking at the property type distribution in Hallbergmoos, Apartment/Condo properties are the most common (70%), reflecting the local real estate landscape.
- Houses represent a significant 30% portion, catering likely to families or larger groups.
Hallbergmoos Airbnb Room Capacity Analysis (2026): Bedroom Distribution
Distribution of Listings by Number of Bedrooms
Room Capacity Insights for Hallbergmoos
- The dominant room capacity in Hallbergmoos is 1 bedroom listings, making up 40% of the market. This suggests a strong demand for properties suitable for couples or solo travelers.
- Together, 1 bedroom and 2 bedrooms properties represent 50.0% of the active Airbnb listings in Hallbergmoos, indicating a high concentration in these sizes.
- Listings with 3+ bedrooms (5.0%) represent a smaller niche, potentially indicating an underserved market for larger group accommodations in Hallbergmoos.
Hallbergmoos Vacation Rental Guest Capacity Trends (2026)
Distribution of Listings by Guest Capacity
Guest Capacity Insights for Hallbergmoos
- The most common guest capacity trend in Hallbergmoos vacation rentals is listings accommodating 4 guests (25%). This suggests the primary traveler segment is likely small families or groups.
- Properties designed for 4 guests and 2 guests dominate the Hallbergmoos STR market, accounting for 40.0% of listings.
- On average, properties in Hallbergmoos are equipped to host 2.1 guests.
Hallbergmoos Airbnb Booking Patterns (2026): Available vs. Booked Days
Available Days Distribution
Booked Days Distribution
Booking Pattern Insights for Hallbergmoos
- The most common availability pattern in Hallbergmoos falls within the 181-270 days range, representing 40% of listings. This suggests many properties have significant open periods on their calendars.
- Approximately 65.0% of listings show high availability (181+ days open annually), indicating potential for increased bookings or specific owner usage patterns.
- For booked days, the 91-180 days range is most frequent in Hallbergmoos (35%), reflecting common guest stay durations or potential owner blocking patterns.
- A notable 40.0% of properties secure long booking periods (181+ days booked per year), highlighting successful long-term rental strategies or significant owner usage.
Hallbergmoos Airbnb Minimum Stay Requirements Analysis
Distribution of Listings by Minimum Night Requirement
1 Night
14 listings
70% of total
2 Nights
2 listings
10% of total
4-6 Nights
1 listings
5% of total
30+ Nights
3 listings
15% of total
Key Insights
- The most prevalent minimum stay requirement in Hallbergmoos is 1 Night, adopted by 70% of listings. This highlights the market's preference for shorter, flexible bookings.
- A strong majority (80.0%) of the Hallbergmoos Airbnb data shows acceptance of very short stays (1-2 nights), indicating a dynamic, high-turnover market.
- A significant segment (15%) caters to monthly stays (30+ nights) in Hallbergmoos, pointing to opportunities in the extended-stay market.
Recommendations
- Align with the market by considering a 1 Night minimum stay, as 70% of Hallbergmoos hosts use this setting.
- Explore offering discounts for stays of 30+ nights to attract the 15% of the market seeking extended stays.
- Adjust minimum nights based on seasonality – potentially shorter during low season and longer during peak demand periods in Hallbergmoos.
Hallbergmoos Airbnb Cancellation Policy Trends Analysis (2026)
Flexible
11 listings
55% of total
Moderate
7 listings
35% of total
Firm
2 listings
10% of total
Cancellation Policy Insights for Hallbergmoos
- The prevailing Airbnb cancellation policy trend in Hallbergmoos is Flexible, used by 55% of listings.
- The market strongly favors guest-friendly terms, with 90.0% of listings offering Flexible or Moderate policies. This suggests guests in Hallbergmoos may expect booking flexibility.
Recommendations for Hosts
- Consider adopting a Flexible policy to align with the 55% market standard in Hallbergmoos.
- Given the high prevalence of Flexible policies (55%), offering this can enhance booking appeal, especially during shoulder seasons.
- Regularly review your cancellation policy against competitors and market demand shifts in Hallbergmoos.
Hallbergmoos STR Booking Lead Time Analysis (2026)
Average Booking Lead Time by Month
Booking Lead Time Insights for Hallbergmoos
- The overall average booking lead time for vacation rentals in Hallbergmoos is 45 days.
- Guests book furthest in advance for stays during October (average 58 days), likely coinciding with peak travel demand or local events.
- The shortest booking windows occur for stays in February (average 28 days), indicating more last-minute travel plans during this time.
- Seasonally, Fall (47 days avg.) sees the longest lead times, while Winter (31 days avg.) has the shortest, reflecting typical travel planning cycles.
Recommendations for Hosts
- Use the overall average lead time (45 days) as a baseline for your pricing and availability strategy in Hallbergmoos.
- For October stays, consider implementing length-of-stay discounts or slightly higher rates for bookings made less than 58 days out to capitalize on advance planning.
- Target marketing efforts for the Fall season well in advance (at least 47 days) to capture early planners.
- Monitor your own booking lead times against these Hallbergmoos averages to identify opportunities for dynamic pricing adjustments.
Popular & Essential Airbnb Amenities in Hallbergmoos (2026)
Amenity Prevalence
Amenity Insights for Hallbergmoos
- Essential amenities in Hallbergmoos that guests expect include: Heating, Wifi, Hot water, Hair dryer, Hangers. Lacking these (any) could significantly impact bookings.
- Popular amenities like Essentials, Bed linens, Smoke alarm are common but not universal. Offering these can provide a competitive edge.
Recommendations for Hosts
- Ensure your listing includes all essential amenities for Hallbergmoos: Heating, Wifi, Hot water, Hair dryer, Hangers.
- Prioritize adding missing essentials: Hair dryer, Hangers.
- Consider adding popular differentiators like Essentials or Bed linens to increase appeal.
- Highlight unique or less common amenities you offer (e.g., hot tub, dedicated workspace, EV charger) in your listing description and photos.
- Regularly check competitor amenities in Hallbergmoos to stay competitive.
Hallbergmoos Airbnb Guest Demographics & Profile Analysis (2026)
Guest Profile Summary for Hallbergmoos
- The typical guest profile for Airbnb in Hallbergmoos consists of predominantly international visitors (71%), with top international origins including United States, typically belonging to the Post-2000s (Gen Z/Alpha) group (50%), primarily speaking English or German.
- Domestic travelers account for 28.9% of guests.
- Key international markets include Germany (28.9%) and United States (26%).
- Top languages spoken are English (39.5%) followed by German (21.1%).
- A significant demographic segment is the Post-2000s (Gen Z/Alpha) group, representing 50% of guests.
Recommendations for Hosts
- Focus marketing internationally, particularly towards travelers from United States.
- Tailor amenities and listing descriptions to appeal to the dominant Post-2000s (Gen Z/Alpha) demographic (e.g., highlight fast WiFi, smart home features, local guides).
- Highlight unique local experiences or amenities relevant to the primary guest profile.
- Consider seasonal promotions aligned with peak travel times for key origin markets.
Nearby Short-Term Rental Market Comparison
How does the Hallbergmoos Airbnb market stack up against its neighbors? Compare key performance metrics like average monthly revenue, ADR, and occupancy rates in surrounding areas to understand the broader regional STR landscape.
| Market | Active Properties | Monthly Revenue | Daily Rate | Avg. Occupancy |
|---|---|---|---|---|
| Scheffau am Wilden Kaiser | 12 | $6,669 | $906.83 | 30% |
| Balderschwang | 10 | $5,253 | $304.03 | 58% |
| Going am Wilden Kaiser | 27 | $3,596 | $406.50 | 37% |
| Kramsach | 12 | $3,573 | $272.32 | 48% |
| Bayrischzell | 41 | $3,550 | $389.91 | 33% |
| Krimml | 53 | $3,544 | $359.14 | 41% |
| Reith bei Kitzbühel | 49 | $3,385 | $356.25 | 34% |
| Stans | 12 | $3,115 | $255.48 | 43% |
| Pfafflar | 11 | $3,053 | $255.26 | 50% |
| Thaur | 12 | $2,954 | $152.36 | 69% |