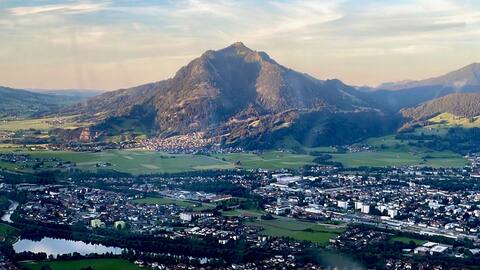
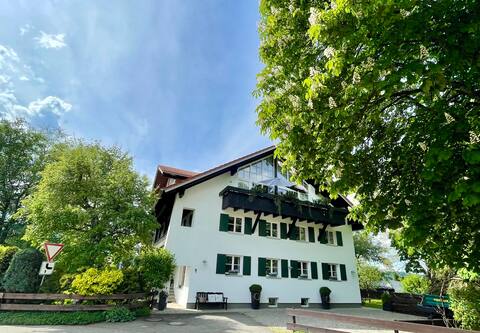
Burgberg Airbnb Market Analysis 2025: Short Term Rental Data & Vacation Rental Statistics in Bavaria, Germany
Is Airbnb profitable in Burgberg in 2025? Explore comprehensive Airbnb analytics for Burgberg, Bavaria, Germany to uncover income potential. This 2025 STR market report for Burgberg, based on AirROI data from November 2024 to October 2025, reveals key trends in the niche market of 17 active listings.
Whether you're considering an Airbnb investment in Burgberg, optimizing your existing vacation rental, or exploring rental arbitrage opportunities, understanding the Burgberg Airbnb data is crucial. Leveraging the low regulation environment is key to maximizing your short term rental income potential. Let's dive into the specifics.
Key Burgberg Airbnb Performance Metrics Overview
Monthly Airbnb Revenue Variations & Income Potential in Burgberg (2025)
Understanding the monthly revenue variations for Airbnb listings in Burgberg is key to maximizing your short term rental income potential. Seasonality significantly impacts earnings. Our analysis, based on data from the past 12 months, shows that the peak revenue month for STRs in Burgberg is typically August, while November often presents the lowest earnings, highlighting opportunities for strategic pricing adjustments during shoulder and low seasons. Explore the typical Airbnb income in Burgberg across different performance tiers:
- Best-in-class properties (Top 10%) achieve $4,676+ monthly, often utilizing dynamic pricing and superior guest experiences.
- Strong performing properties (Top 25%) earn $3,241 or more, indicating effective management and desirable locations/amenities.
- Typical properties (Median) generate around $1,841 per month, representing the average market performance.
- Entry-level properties (Bottom 25%) see earnings around $983, often with potential for optimization.
Average Monthly Airbnb Earnings Trend in Burgberg
Burgberg Airbnb Occupancy Rate Trends (2025)
Maximize your bookings by understanding the Burgberg STR occupancy trends. Seasonal demand shifts significantly influence how often properties are booked. Typically, Augustsees the highest demand (peak season occupancy), while March experiences the lowest (low season). Effective strategies, like adjusting minimum stays or offering promotions, can boost occupancy during slower periods. Here's how different property tiers perform in Burgberg:
- Best-in-class properties (Top 10%) achieve 65%+ occupancy, indicating high desirability and potentially optimized availability.
- Strong performing properties (Top 25%) maintain 52% or higher occupancy, suggesting good market fit and guest satisfaction.
- Typical properties (Median) have an occupancy rate around 38%.
- Entry-level properties (Bottom 25%) average 25% occupancy, potentially facing higher vacancy.
Average Monthly Occupancy Rate Trend in Burgberg
Average Daily Rate (ADR) Airbnb Trends in Burgberg (2025)
Effective short term rental pricing strategy in Burgberg involves understanding monthly ADR fluctuations. The Average Daily Rate (ADR) for Airbnb in Burgberg typically peaks in September and dips lowest during November. Leveraging Airbnb dynamic pricing tools or strategies based on this seasonality can significantly boost revenue. Here's a look at the typical nightly rates achieved:
- Best-in-class properties (Top 10%) command rates of $369+ per night, often due to premium features or locations.
- Strong performing properties (Top 25%) achieve nightly rates of $175 or more.
- Typical properties (Median) charge around $132 per night.
- Entry-level properties (Bottom 25%) earn around $98 per night.
Average Daily Rate (ADR) Trend by Month in Burgberg
Get Live Burgberg Market Intelligence 👇

Explore Real-time Analytics
Airbnb Seasonality Analysis & Trends in Burgberg (2025)
Peak Season (August, July, September)
- Revenue averages $4,732 per month
- Occupancy rates average 60.2%
- Daily rates average $204
Shoulder Season
- Revenue averages $2,262 per month
- Occupancy maintains around 35.7%
- Daily rates hold near $183
Low Season (March, April, November)
- Revenue drops to average $1,378 per month
- Occupancy decreases to average 23.5%
- Daily rates adjust to average $166
Seasonality Insights for Burgberg
- The Airbnb seasonality in Burgberg shows highly seasonal trends requiring careful strategy. While the sections above show seasonal averages, it's also insightful to look at the extremes:
- During the high season, the absolute peak month showcases Burgberg's highest earning potential, with monthly revenues capable of climbing to $5,780, occupancy reaching a high of 64.8%, and ADRs peaking at $209.
- Conversely, the slowest single month of the year, typically falling within the low season, marks the market's lowest point. In this month, revenue might dip to $1,086, occupancy could drop to 20.4%, and ADRs may adjust down to $153.
- Understanding both the seasonal averages and these monthly peaks and troughs in revenue, occupancy, and ADR is crucial for maximizing your Airbnb profit potential in Burgberg.
Seasonal Strategies for Maximizing Profit
- Peak Season: Maximize revenue through premium pricing and potentially longer minimum stays. Ensure high availability.
- Low Season: Offer competitive pricing, special promotions (e.g., extended stay discounts), and flexible cancellation policies. Target off-season travelers like remote workers or budget-conscious guests.
- Shoulder Seasons: Implement dynamic pricing that balances peak and low rates. Target weekend travelers or specific events. Offer slightly more flexible terms than peak season.
- Regularly analyze your own performance against these Burgberg seasonality benchmarks and adjust your pricing and availability strategy accordingly.
Best Areas for Airbnb Investment in Burgberg (2025)
Exploring the top neighborhoods for short-term rentals in Burgberg? This section highlights key areas, outlining why they are attractive for hosts and guests, along with notable local attractions. Consider these locations based on your target guest profile and investment strategy.
| Neighborhood / Area | Why Host Here? (Target Guests & Appeal) | Key Attractions & Landmarks |
|---|---|---|
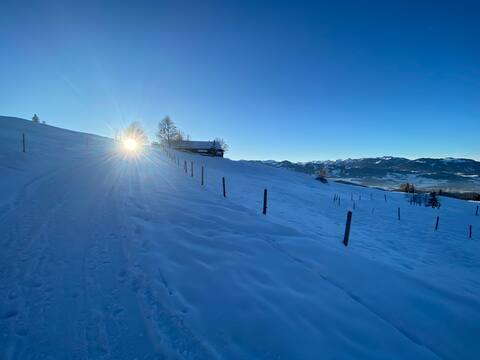
| Burgberg in the Allgäu | A picturesque village surrounded by stunning mountain scenery, ideal for outdoor enthusiasts and nature lovers. The area's charm draws tourists looking for a peaceful retreat to enjoy hiking, skiing, and the beauty of the Allgäu region. | Allgäu Alps, Hiking trails, Ski resorts, Burgberg Mountain, Burgberg Cable Car |
| Fischen im Allgäu | A quaint village with a rich cultural heritage and proximity to the beautiful foothills of the Alps, making it perfect for visitors seeking a blend of relaxation and adventure. | Fischen Church, Ehrenschwanger Wasserfall, Tannheimer Tal, St. Oswald Church, Mountain biking trails |
| Oberstdorf | Renowned as a resort town, Oberstdorf attracts visitors for skiing and stunning hiking trails. It offers a vibrant alpine atmosphere with various seasonal activities. | Skiing and Snowboarding, Nebelhorn Mountain, Oberstdorf Ice Arena, Heini Klopfer Ski Jump, Walmendingerhorn Mountain |
| Sonthofen | A charming town known for its historic buildings and easy access to outdoor activities in the surrounding mountains, Sonthofen is popular with families and nature enthusiasts. | Sonthofen Town Center, Historical Town Hall, Isny Castle, Nearby ski resorts, Allgäu Water Park |
| Bad Hindelang | This scenic village offers fantastic outdoor activities year-round, attracting a healthy mix of hikers and winter sports lovers. It's known for its clean mountain air and beautiful landscapes. | Bad Hindelang ski areas, Königskopf Mountain, Hiking trails, Wieskirche, Adventure parks |
| Immenstadt | Immenstadt is a picturesque town located by Lake Immenstadt, providing beautiful views and numerous lakeside activities, making it a hit among tourists. | Lake Immenstadt, Immenstadt Town Museum, Alpsee, Paragliding opportunities, Historical buildings |
| Waldburg | A small, tranquil village near Lake Constance, Waldburg offers a relaxing stay amidst nature, with beautiful landscapes and local culture for guests to explore. | Lake Constance, Waldburg Castle, Nature trails, Local wineries, Cycling routes |
| Nesselwang | A popular destination for ski lovers and hikers, Nesselwang combines charm with accessibility, offering both winter sports and summer activities in the Allgäu region. | Nesselwang Ski Resort, Alpenbad water park, Hiking trails, Mountain biking, Castle ruins nearby |
Understanding Airbnb License Requirements & STR Laws in Burgberg (2025)
While Burgberg, Bavaria, Germany currently shows low STR regulations, specific Airbnb license requirements might still exist or change. Always verify the latest short term rental regulations and Airbnb license requirements directly with local government authorities for Burgberg to ensure full compliance before hosting.
(Source: AirROI data, 2025, finding no licensed listings among those analyzed)
Top Performing Airbnb Properties in Burgberg (2025)
Benchmark your potential! Explore examples of top-performing Airbnb properties in Burgbergbased on Trailing Twelve Month (TTM) revenue. Analyze their characteristics, revenue, occupancy rate, and ADR to understand what drives success in this market.
Bergheimat country house in Burgberg for 8-16 people
Entire Place • 7 bedrooms
House in the meadows
Entire Place • 4 bedrooms
Waldchalets Allgäu
Entire Place • 3 bedrooms
Burgberger Hörnle
Entire Place • 2 bedrooms
Dream apartment in Burgberg
Entire Place • 1 bedroom
Holiday home Schönhensch in the nice Oberallgäu
Entire Place • 3 bedrooms
Note: Performance varies based on location, size, amenities, seasonality, and management quality. Data reflects the past 12 months.
Top Performing Airbnb Hosts in Burgberg (2025)
Learn from the best! This table showcases top-performing Airbnb hosts in Burgberg based on the number of properties managed and estimated total revenue over the past year. Analyze their scale and performance metrics.
| Host Name | Properties | Grossing Revenue | Stay Reviews | Avg Rating |
|---|---|---|---|---|
| Monika | 4 | $170,986 | 316 | 4.86/5.0 |
| Markus | 2 | $44,563 | 63 | 4.76/5.0 |
| Johanna | 2 | $41,261 | 54 | 4.86/5.0 |
| Waldchalets Allgäu | 1 | $36,298 | 1 | Not Rated |
| Familie Schaidnagel | 1 | $31,920 | 48 | 5.00/5.0 |
| Rainer | 1 | $27,953 | 43 | 4.81/5.0 |
| Isolde | 1 | $17,118 | 176 | 4.95/5.0 |
| Elke | 1 | $9,009 | 44 | 5.00/5.0 |
| Buchungsservice SECRA Bookings | 1 | $6,267 | 1 | Not Rated |
| Marko | 1 | $1,379 | 4 | 4.75/5.0 |
Analyzing the strategies of top hosts, such as their property selection, pricing, and guest communication, can offer valuable lessons for optimizing your own Airbnb operations in Burgberg.
Dive Deeper: Advanced Burgberg STR Market Data (2025)
Ready to unlock more insights? AirROI provides access to advanced metrics and comprehensive Airbnb data for Burgberg. Explore detailed analytics beyond this report to refine your investment strategy, optimize pricing, and maximize your vacation rental profits.
Explore Advanced MetricsBurgberg Short-Term Rental Market Composition (2025): Property & Room Types
Room Type Distribution
Property Type Distribution
Market Composition Insights for Burgberg
- The Burgberg Airbnb market composition is heavily skewed towards Entire Home/Apt listings, which make up 100% of the 17 active rentals. This indicates strong guest preference for privacy and space.
- Looking at the property type distribution in Burgberg, Apartment/Condo properties are the most common (64.7%), reflecting the local real estate landscape.
- Houses represent a significant 29.4% portion, catering likely to families or larger groups.
Burgberg Airbnb Room Capacity Analysis (2025): Bedroom Distribution
Distribution of Listings by Number of Bedrooms
Room Capacity Insights for Burgberg
- The dominant room capacity in Burgberg is 1 bedroom listings, making up 41.2% of the market. This suggests a strong demand for properties suitable for couples or solo travelers.
- Together, 1 bedroom and 3 bedrooms properties represent 64.7% of the active Airbnb listings in Burgberg, indicating a high concentration in these sizes.
- A significant 35.3% of listings offer 3+ bedrooms, catering to larger groups and families seeking more space in Burgberg.
Burgberg Vacation Rental Guest Capacity Trends (2025)
Distribution of Listings by Guest Capacity
Guest Capacity Insights for Burgberg
- The most common guest capacity trend in Burgberg vacation rentals is listings accommodating 2 guests (35.3%). This suggests the primary traveler segment is likely couples or solo travelers.
- Properties designed for 2 guests and 4 guests dominate the Burgberg STR market, accounting for 52.9% of listings.
- 41.2% of properties accommodate 6+ guests, serving the market segment for larger families or group travel in Burgberg.
- On average, properties in Burgberg are equipped to host 4.6 guests.
Burgberg Airbnb Booking Patterns (2025): Available vs. Booked Days
Available Days Distribution
Booked Days Distribution
Booking Pattern Insights for Burgberg
- The most common availability pattern in Burgberg falls within the 271-366 days range, representing 47.1% of listings. This suggests many properties have significant open periods on their calendars.
- Approximately 88.3% of listings show high availability (181+ days open annually), indicating potential for increased bookings or specific owner usage patterns.
- For booked days, the 91-180 days range is most frequent in Burgberg (47.1%), reflecting common guest stay durations or potential owner blocking patterns.
- A notable 11.8% of properties secure long booking periods (181+ days booked per year), highlighting successful long-term rental strategies or significant owner usage.
Burgberg Airbnb Minimum Stay Requirements Analysis
Distribution of Listings by Minimum Night Requirement
1 Night
4 listings
23.5% of total
2 Nights
4 listings
23.5% of total
3 Nights
5 listings
29.4% of total
30+ Nights
4 listings
23.5% of total
Key Insights
- The most prevalent minimum stay requirement in Burgberg is 3 Nights, adopted by 29.4% of listings. This highlights the market's preference for longer commitments.
- A significant segment (23.5%) caters to monthly stays (30+ nights) in Burgberg, pointing to opportunities in the extended-stay market.
Recommendations
- Align with the market by considering a 3 Nights minimum stay, as 29.4% of Burgberg hosts use this setting.
- If feasible, allowing 1-night stays, especially midweek or during low season, could capture last-minute bookings, as only 23.5% currently do.
- Explore offering discounts for stays of 30+ nights to attract the 23.5% of the market seeking extended stays.
- Adjust minimum nights based on seasonality – potentially shorter during low season and longer during peak demand periods in Burgberg.
Burgberg Airbnb Cancellation Policy Trends Analysis (2025)
Super Strict 30 Days
1 listings
5.9% of total
Super Strict 60 Days
1 listings
5.9% of total
Moderate
3 listings
17.6% of total
Firm
8 listings
47.1% of total
Strict
4 listings
23.5% of total
Cancellation Policy Insights for Burgberg
- The prevailing Airbnb cancellation policy trend in Burgberg is Firm, used by 47.1% of listings.
- A majority (70.6%) of hosts in Burgberg utilize Firm or Strict policies, indicating a market where hosts prioritize booking security.
Recommendations for Hosts
- Consider adopting a Firm policy to align with the 47.1% market standard in Burgberg.
- Regularly review your cancellation policy against competitors and market demand shifts in Burgberg.
Burgberg STR Booking Lead Time Analysis (2025)
Average Booking Lead Time by Month
Booking Lead Time Insights for Burgberg
- The overall average booking lead time for vacation rentals in Burgberg is 83 days.
- Guests book furthest in advance for stays during May (average 133 days), likely coinciding with peak travel demand or local events.
- The shortest booking windows occur for stays in March (average 47 days), indicating more last-minute travel plans during this time.
- Seasonally, Summer (104 days avg.) sees the longest lead times, while Winter (72 days avg.) has the shortest, reflecting typical travel planning cycles.
Recommendations for Hosts
- Use the overall average lead time (83 days) as a baseline for your pricing and availability strategy in Burgberg.
- For May stays, consider implementing length-of-stay discounts or slightly higher rates for bookings made less than 133 days out to capitalize on advance planning.
- Target marketing efforts for the Summer season well in advance (at least 104 days) to capture early planners.
- Monitor your own booking lead times against these Burgberg averages to identify opportunities for dynamic pricing adjustments.
Popular & Essential Airbnb Amenities in Burgberg (2025)
Amenity Prevalence
Amenity Insights for Burgberg
- Essential amenities in Burgberg that guests expect include: TV, Wifi. Lacking these (any) could significantly impact bookings.
- Popular amenities like Refrigerator, Smoke alarm, Free parking on premises are common but not universal. Offering these can provide a competitive edge.
Recommendations for Hosts
- Ensure your listing includes all essential amenities for Burgberg: TV, Wifi.
- Consider adding popular differentiators like Refrigerator or Smoke alarm to increase appeal.
- Highlight unique or less common amenities you offer (e.g., hot tub, dedicated workspace, EV charger) in your listing description and photos.
- Regularly check competitor amenities in Burgberg to stay competitive.
Burgberg Airbnb Guest Demographics & Profile Analysis (2025)
Guest Profile Summary for Burgberg
- The typical guest profile for Airbnb in Burgberg consists of primarily domestic travelers (90%), often arriving from nearby Frankfurt, typically belonging to the Post-2000s (Gen Z/Alpha) group (50%), primarily speaking English or German.
- Domestic travelers account for 89.8% of guests.
- Key international markets include Germany (89.8%) and Australia (1.7%).
- Top languages spoken are English (41.1%) followed by German (41.1%).
- A significant demographic segment is the Post-2000s (Gen Z/Alpha) group, representing 50% of guests.
Recommendations for Hosts
- Target domestic marketing efforts towards travelers from Frankfurt and Mannheim.
- Tailor amenities and listing descriptions to appeal to the dominant Post-2000s (Gen Z/Alpha) demographic (e.g., highlight fast WiFi, smart home features, local guides).
- Highlight unique local experiences or amenities relevant to the primary guest profile.
- Consider seasonal promotions aligned with peak travel times for key origin markets.
Nearby Short-Term Rental Market Comparison
How does the Burgberg Airbnb market stack up against its neighbors? Compare key performance metrics like average monthly revenue, ADR, and occupancy rates in surrounding areas to understand the broader regional STR landscape.
| Market | Active Properties | Monthly Revenue | Daily Rate | Avg. Occupancy |
|---|---|---|---|---|
| Sankt Pankraz - San Pancrazio | 14 | $5,664 | $696.09 | 24% |
| Balderschwang | 10 | $5,422 | $312.27 | 60% |
| Urtijëi - St. Ulrich in Gröden - Ortisei | 173 | $4,980 | $718.12 | 40% |
| Bayrischzell | 40 | $4,251 | $411.48 | 33% |
| Moos in Passeier - Moso in Passiria | 19 | $4,142 | $575.75 | 25% |
| Brand | 63 | $4,063 | $534.17 | 32% |
| Bürserberg | 44 | $4,035 | $334.07 | 42% |
| Kiens - Chienes | 17 | $3,898 | $380.85 | 49% |
| Sankt Moritz | 240 | $3,585 | $436.55 | 38% |
| Varenna | 214 | $3,564 | $296.58 | 50% |