Blaichach Airbnb Market Analysis 2026: Short Term Rental Data & Vacation Rental Statistics in Bavaria, Germany
Is Airbnb profitable in Blaichach in 2026? Explore comprehensive Airbnb analytics for Blaichach, Bavaria, Germany to uncover income potential. This 2026 STR market report for Blaichach, based on AirROI data from February 2025 to January 2026, reveals key trends in the niche market of 33 active listings.
Whether you're considering an Airbnb investment in Blaichach, optimizing your existing vacation rental, or exploring rental arbitrage opportunities, understanding the Blaichach Airbnb data is crucial. Leveraging the low regulation environment is key to maximizing your short term rental income potential. Let's dive into the specifics.
Key Blaichach Airbnb Performance Metrics Overview
Monthly Airbnb Revenue Variations & Income Potential in Blaichach (2026)
Understanding the monthly revenue variations for Airbnb listings in Blaichach is key to maximizing your short term rental income potential. Seasonality significantly impacts earnings. Our analysis, based on data from the past 12 months, shows that the peak revenue month for STRs in Blaichach is typically August, while November often presents the lowest earnings, highlighting opportunities for strategic pricing adjustments during shoulder and low seasons. Explore the typical Airbnb income in Blaichach across different performance tiers:
- Best-in-class properties (Top 10%) achieve $3,216+ monthly, often utilizing dynamic pricing and superior guest experiences.
- Strong performing properties (Top 25%) earn $2,500 or more, indicating effective management and desirable locations/amenities.
- Typical properties (Median) generate around $1,723 per month, representing the average market performance.
- Entry-level properties (Bottom 25%) see earnings around $1,169, often with potential for optimization.
Average Monthly Airbnb Earnings Trend in Blaichach
Blaichach Airbnb Occupancy Rate Trends (2026)
Maximize your bookings by understanding the Blaichach STR occupancy trends. Seasonal demand shifts significantly influence how often properties are booked. Typically, Augustsees the highest demand (peak season occupancy), while November experiences the lowest (low season). Effective strategies, like adjusting minimum stays or offering promotions, can boost occupancy during slower periods. Here's how different property tiers perform in Blaichach:
- Best-in-class properties (Top 10%) achieve 78%+ occupancy, indicating high desirability and potentially optimized availability.
- Strong performing properties (Top 25%) maintain 61% or higher occupancy, suggesting good market fit and guest satisfaction.
- Typical properties (Median) have an occupancy rate around 45%.
- Entry-level properties (Bottom 25%) average 29% occupancy, potentially facing higher vacancy.
Average Monthly Occupancy Rate Trend in Blaichach
Average Daily Rate (ADR) Airbnb Trends in Blaichach (2026)
Effective short term rental pricing strategy in Blaichach involves understanding monthly ADR fluctuations. The Average Daily Rate (ADR) for Airbnb in Blaichach typically peaks in August and dips lowest during November. Leveraging Airbnb dynamic pricing tools or strategies based on this seasonality can significantly boost revenue. Here's a look at the typical nightly rates achieved:
- Best-in-class properties (Top 10%) command rates of $214+ per night, often due to premium features or locations.
- Strong performing properties (Top 25%) achieve nightly rates of $171 or more.
- Typical properties (Median) charge around $137 per night.
- Entry-level properties (Bottom 25%) earn around $98 per night.
Average Daily Rate (ADR) Trend by Month in Blaichach
Get Live Blaichach Market Intelligence 👇

Explore Real-time Analytics
Airbnb Seasonality Analysis & Trends in Blaichach (2026)
Peak Season (August, July, September)
- Revenue averages $2,837 per month
- Occupancy rates average 65.7%
- Daily rates average $154
Shoulder Season
- Revenue averages $1,812 per month
- Occupancy maintains around 44.4%
- Daily rates hold near $146
Low Season (January, March, November)
- Revenue drops to average $1,248 per month
- Occupancy decreases to average 30.6%
- Daily rates adjust to average $141
Seasonality Insights for Blaichach
- The Airbnb seasonality in Blaichach shows highly seasonal trends requiring careful strategy. While the sections above show seasonal averages, it's also insightful to look at the extremes:
- During the high season, the absolute peak month showcases Blaichach's highest earning potential, with monthly revenues capable of climbing to $3,026, occupancy reaching a high of 66.3%, and ADRs peaking at $158.
- Conversely, the slowest single month of the year, typically falling within the low season, marks the market's lowest point. In this month, revenue might dip to $1,055, occupancy could drop to 28.7%, and ADRs may adjust down to $132.
- Understanding both the seasonal averages and these monthly peaks and troughs in revenue, occupancy, and ADR is crucial for maximizing your Airbnb profit potential in Blaichach.
Seasonal Strategies for Maximizing Profit
- Peak Season: Maximize revenue through premium pricing and potentially longer minimum stays. Ensure high availability.
- Low Season: Offer competitive pricing, special promotions (e.g., extended stay discounts), and flexible cancellation policies. Target off-season travelers like remote workers or budget-conscious guests.
- Shoulder Seasons: Implement dynamic pricing that balances peak and low rates. Target weekend travelers or specific events. Offer slightly more flexible terms than peak season.
- Regularly analyze your own performance against these Blaichach seasonality benchmarks and adjust your pricing and availability strategy accordingly.
Best Areas for Airbnb Investment in Blaichach (2026)
Exploring the top neighborhoods for short-term rentals in Blaichach? This section highlights key areas, outlining why they are attractive for hosts and guests, along with notable local attractions. Consider these locations based on your target guest profile and investment strategy.
| Neighborhood / Area | Why Host Here? (Target Guests & Appeal) | Key Attractions & Landmarks |
|---|---|---|
| Blaichach Center | The heart of Blaichach, with easy access to amenities, shops, and local attractions. Ideal for families and tourists wanting a central base. | Blaichach Town Hall, Local restaurants and cafes, Shopping opportunities, Nearby hiking trails, Local festivals |
| Alpsee | A stunning lake area known for its beautiful views and outdoor activities. Popular for vacationers seeking nature and tranquility. | Alpsee Lake, Hiking trails, Boating activities, Picnic areas, Scenic viewpoints |
| Immenstadt im Allgäu | A nearby town with rich history and access to ski areas, making it appealing year-round for travelers. | Historical old town, Immenstadt ski area, Lake Immenstadt, Allgäu scenic routes, Cultural events |
| Freiberg | A charming district offering access to nature and a quieter atmosphere, attracting those looking for relaxation and retreats. | Beautiful landscapes, Hiking and cycling trails, Cafes and local shops, Nature parks, Cultural sites |
| Bad Hindelang | Known for its wellness offerings and ski resorts, attracting tourists interested in health, relaxation, and winter sports. | Ski resorts, Spas and wellness centers, Hiking paths, Local flora and fauna, Festivals |
| Oberstdorf | A famous ski destination with beautiful alpine scenery, popular with outdoor enthusiasts and winter sports lovers. | Nebelhorn mountain, Skiing and snowboarding, Hiking trails, Kleinwalsertal, Local shops and restaurants |
| Nesselwang | An attractive area for families and nature lovers providing various outdoor activities throughout the year. | Nesselwang ski area, Lake Nesselwang, Family-friendly attractions, Biking trails, Local market events |
| Bregenzerwald | A picturesque region renowned for its natural beauty and cultural events, perfect for attracting tourists looking for a unique experience. | Beautiful valleys, Local artisan shops, Hiking routes, Cultural festivals, Alpine scenery |
Understanding Airbnb License Requirements & STR Laws in Blaichach (2026)
While Blaichach, Bavaria, Germany currently shows low STR regulations, specific Airbnb license requirements might still exist or change. Always verify the latest short term rental regulations and Airbnb license requirements directly with local government authorities for Blaichach to ensure full compliance before hosting.
(Source: AirROI data, 2026, finding no licensed listings among those analyzed)
Top Performing Airbnb Properties in Blaichach (2026)
Benchmark your potential! Explore examples of top-performing Airbnb properties in Blaichachbased on Trailing Twelve Month (TTM) revenue. Analyze their characteristics, revenue, occupancy rate, and ADR to understand what drives success in this market.
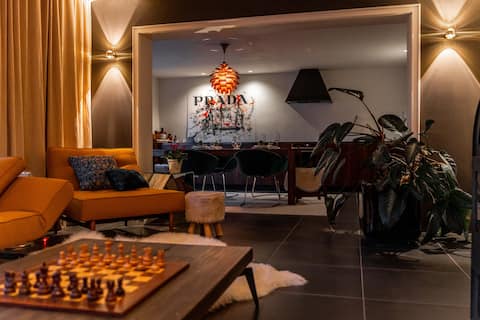
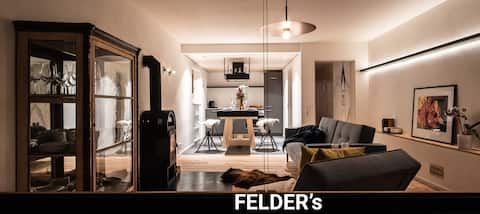
Felder's - Stylish Mountain Basecamp with Fire Pit
Entire Place • 3 bedrooms
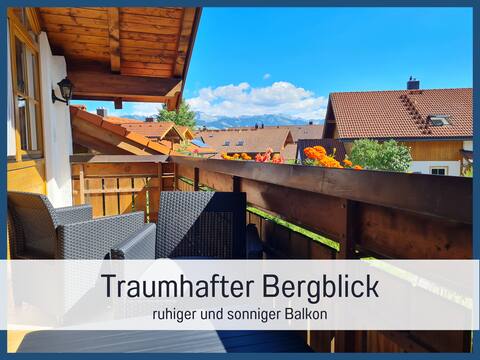
Apartment with mountain views and quiet balcony
Entire Place • 1 bedroom
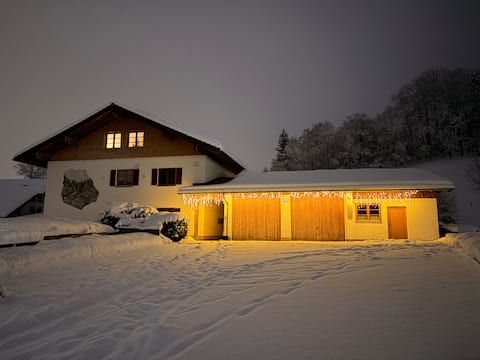
Beautiful 2-room in Nagelfluh Hüs
Entire Place • 1 bedroom
SPA Penthouse - Allgäu SPA House
Entire Place • 2 bedrooms
Felder's - Retreat apartment with fireplace
Entire Place • 1 bedroom
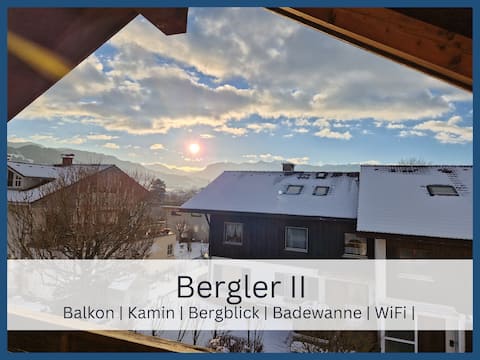
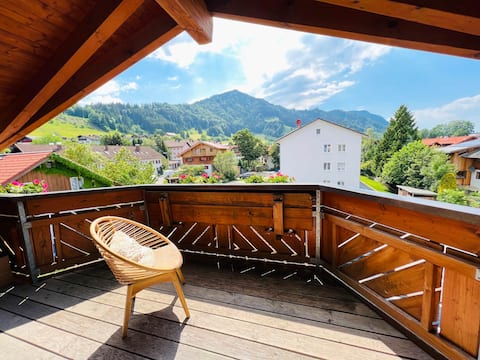
Bergler II • Balcony + Mountain View • WiFi • Bathtub
Entire Place • 3 bedrooms
Note: Performance varies based on location, size, amenities, seasonality, and management quality. Data reflects the past 12 months.
Top Performing Airbnb Hosts in Blaichach (2026)
Learn from the best! This table showcases top-performing Airbnb hosts in Blaichach based on the number of properties managed and estimated total revenue over the past year. Analyze their scale and performance metrics.
| Host Name | Properties | Grossing Revenue | Stay Reviews | Avg Rating |
|---|---|---|---|---|
| Martin | 6 | $156,886 | 325 | 4.76/5.0 |
| Michael | 5 | $86,591 | 114 | 4.66/5.0 |
| Marion | 2 | $76,679 | 92 | 4.92/5.0 |
| Monika | 2 | $58,889 | 79 | 4.98/5.0 |
| Diana | 3 | $40,202 | 39 | 4.72/5.0 |
| Dominik | 1 | $25,413 | 13 | 4.92/5.0 |
| Christian | 1 | $25,289 | 37 | 5.00/5.0 |
| Steven | 1 | $24,687 | 71 | 4.87/5.0 |
| Lisa | 1 | $21,689 | 50 | 4.98/5.0 |
| Karin & Kathi | 1 | $18,274 | 213 | 4.99/5.0 |
Analyzing the strategies of top hosts, such as their property selection, pricing, and guest communication, can offer valuable lessons for optimizing your own Airbnb operations in Blaichach.
Dive Deeper: Advanced Blaichach STR Market Data (2026)
Ready to unlock more insights? AirROI provides access to advanced metrics and comprehensive Airbnb data for Blaichach. Explore detailed analytics beyond this report to refine your investment strategy, optimize pricing, and maximize your vacation rental profits.
Explore Advanced MetricsBlaichach Short-Term Rental Market Composition (2026): Property & Room Types
Room Type Distribution
Property Type Distribution
Market Composition Insights for Blaichach
- The Blaichach Airbnb market composition is heavily skewed towards Entire Home/Apt listings, which make up 93.9% of the 33 active rentals. This indicates strong guest preference for privacy and space.
- Looking at the property type distribution in Blaichach, Apartment/Condo properties are the most common (78.8%), reflecting the local real estate landscape.
- Houses represent a significant 18.2% portion, catering likely to families or larger groups.
- Smaller segments like hotel/boutique (combined 3.0%) offer potential for unique stay experiences.
Blaichach Airbnb Room Capacity Analysis (2026): Bedroom Distribution
Distribution of Listings by Number of Bedrooms
Room Capacity Insights for Blaichach
- The dominant room capacity in Blaichach is 1 bedroom listings, making up 60.6% of the market. This suggests a strong demand for properties suitable for couples or solo travelers.
- Together, 1 bedroom and 2 bedrooms properties represent 81.8% of the active Airbnb listings in Blaichach, indicating a high concentration in these sizes.
- With over half the market (60.6%) consisting of studios or 1-bedroom units, Blaichach is particularly well-suited for individuals or couples.
Blaichach Vacation Rental Guest Capacity Trends (2026)
Distribution of Listings by Guest Capacity
Guest Capacity Insights for Blaichach
- The most common guest capacity trend in Blaichach vacation rentals is listings accommodating 4 guests (39.4%). This suggests the primary traveler segment is likely small families or groups.
- Properties designed for 4 guests and 2 guests dominate the Blaichach STR market, accounting for 66.7% of listings.
- 21.2% of properties accommodate 6+ guests, serving the market segment for larger families or group travel in Blaichach.
- On average, properties in Blaichach are equipped to host 3.8 guests.
Blaichach Airbnb Booking Patterns (2026): Available vs. Booked Days
Available Days Distribution
Booked Days Distribution
Booking Pattern Insights for Blaichach
- The most common availability pattern in Blaichach falls within the 181-270 days range, representing 39.4% of listings. This suggests many properties have significant open periods on their calendars.
- Approximately 69.7% of listings show high availability (181+ days open annually), indicating potential for increased bookings or specific owner usage patterns.
- For booked days, the 91-180 days range is most frequent in Blaichach (42.4%), reflecting common guest stay durations or potential owner blocking patterns.
- A notable 30.3% of properties secure long booking periods (181+ days booked per year), highlighting successful long-term rental strategies or significant owner usage.
Blaichach Airbnb Minimum Stay Requirements Analysis
Distribution of Listings by Minimum Night Requirement
1 Night
1 listings
3% of total
2 Nights
3 listings
9.1% of total
3 Nights
3 listings
9.1% of total
4-6 Nights
3 listings
9.1% of total
30+ Nights
23 listings
69.7% of total
Key Insights
- The most prevalent minimum stay requirement in Blaichach is 30+ Nights, adopted by 69.7% of listings. This highlights the market's preference for longer commitments.
- Very short stays (1-2 nights) are less common (12.1%), suggesting hosts prefer slightly longer bookings to optimize turnover.
- A significant segment (69.7%) caters to monthly stays (30+ nights) in Blaichach, pointing to opportunities in the extended-stay market.
Recommendations
- Align with the market by considering a 30+ Nights minimum stay, as 69.7% of Blaichach hosts use this setting.
- If feasible, allowing 1-night stays, especially midweek or during low season, could capture last-minute bookings, as only 3% currently do.
- Explore offering discounts for stays of 30+ nights to attract the 69.7% of the market seeking extended stays.
- Adjust minimum nights based on seasonality – potentially shorter during low season and longer during peak demand periods in Blaichach.
Blaichach Airbnb Cancellation Policy Trends Analysis (2026)
Super Strict 60 Days
6 listings
18.2% of total
Flexible
3 listings
9.1% of total
Moderate
6 listings
18.2% of total
Firm
16 listings
48.5% of total
Strict
2 listings
6.1% of total
Cancellation Policy Insights for Blaichach
- The prevailing Airbnb cancellation policy trend in Blaichach is Firm, used by 48.5% of listings.
- A majority (54.6%) of hosts in Blaichach utilize Firm or Strict policies, indicating a market where hosts prioritize booking security.
- Strict cancellation policies are quite rare (6.1%), potentially making listings with this policy less competitive unless justified by high demand or property type.
Recommendations for Hosts
- Consider adopting a Firm policy to align with the 48.5% market standard in Blaichach.
- Using a Strict policy might deter some guests, as only 6.1% of listings use it. Evaluate if potential revenue protection outweighs possible lower booking rates.
- Regularly review your cancellation policy against competitors and market demand shifts in Blaichach.
Blaichach STR Booking Lead Time Analysis (2026)
Average Booking Lead Time by Month
Booking Lead Time Insights for Blaichach
- The overall average booking lead time for vacation rentals in Blaichach is 69 days.
- Guests book furthest in advance for stays during August (average 92 days), likely coinciding with peak travel demand or local events.
- The shortest booking windows occur for stays in November (average 28 days), indicating more last-minute travel plans during this time.
- Seasonally, Summer (73 days avg.) sees the longest lead times, while Fall (50 days avg.) has the shortest, reflecting typical travel planning cycles.
Recommendations for Hosts
- Use the overall average lead time (69 days) as a baseline for your pricing and availability strategy in Blaichach.
- For August stays, consider implementing length-of-stay discounts or slightly higher rates for bookings made less than 92 days out to capitalize on advance planning.
- Target marketing efforts for the Summer season well in advance (at least 73 days) to capture early planners.
- Monitor your own booking lead times against these Blaichach averages to identify opportunities for dynamic pricing adjustments.
Popular & Essential Airbnb Amenities in Blaichach (2026)
Amenity Prevalence
Amenity Insights for Blaichach
- Essential amenities in Blaichach that guests expect include: Heating. Lacking these (this) could significantly impact bookings.
- Popular amenities like Essentials, Wifi, Coffee maker are common but not universal. Offering these can provide a competitive edge.
- Warning: Wifi is not universally provided but is considered essential globally. Ensure reliable Wifi is offered.
Recommendations for Hosts
- Ensure your listing includes all essential amenities for Blaichach: Heating.
- Consider adding popular differentiators like Essentials or Wifi to increase appeal.
- Highlight unique or less common amenities you offer (e.g., hot tub, dedicated workspace, EV charger) in your listing description and photos.
- Regularly check competitor amenities in Blaichach to stay competitive.
Blaichach Airbnb Guest Demographics & Profile Analysis (2026)
Guest Profile Summary for Blaichach
- The typical guest profile for Airbnb in Blaichach consists of primarily domestic travelers (88%), often arriving from nearby Stuttgart, typically belonging to the Post-2000s (Gen Z/Alpha) group (50%), primarily speaking English or German.
- Domestic travelers account for 87.9% of guests.
- Key international markets include Germany (87.9%) and Netherlands (2.6%).
- Top languages spoken are English (37.7%) followed by German (36.6%).
- A significant demographic segment is the Post-2000s (Gen Z/Alpha) group, representing 50% of guests.
Recommendations for Hosts
- Target domestic marketing efforts towards travelers from Stuttgart and Frankfurt.
- Tailor amenities and listing descriptions to appeal to the dominant Post-2000s (Gen Z/Alpha) demographic (e.g., highlight fast WiFi, smart home features, local guides).
- Highlight unique local experiences or amenities relevant to the primary guest profile.
- Consider seasonal promotions aligned with peak travel times for key origin markets.
Nearby Short-Term Rental Market Comparison
How does the Blaichach Airbnb market stack up against its neighbors? Compare key performance metrics like average monthly revenue, ADR, and occupancy rates in surrounding areas to understand the broader regional STR landscape.
| Market | Active Properties | Monthly Revenue | Daily Rate | Avg. Occupancy |
|---|---|---|---|---|
| Sankt Pankraz - San Pancrazio | 12 | $6,528 | $633.65 | 29% |
| Balderschwang | 10 | $5,253 | $304.03 | 58% |
| Urtijëi - St. Ulrich in Gröden - Ortisei | 172 | $5,054 | $718.33 | 41% |
| Bürserberg | 45 | $3,783 | $331.48 | 40% |
| Kiens - Chienes | 17 | $3,715 | $377.77 | 48% |
| Brand | 63 | $3,714 | $522.47 | 31% |
| Varenna | 226 | $3,641 | $300.50 | 52% |
| Kramsach | 12 | $3,573 | $272.32 | 48% |
| Moos in Passeier - Moso in Passiria | 20 | $3,504 | $547.30 | 23% |
| Lajen - Laion | 96 | $3,338 | $548.27 | 36% |