Beilngries Airbnb Market Analysis 2026: Short Term Rental Data & Vacation Rental Statistics in Bavaria, Germany
Is Airbnb profitable in Beilngries in 2026? Explore comprehensive Airbnb analytics for Beilngries, Bavaria, Germany to uncover income potential. This 2026 STR market report for Beilngries, based on AirROI data from February 2025 to January 2026, reveals key trends in the niche market of 36 active listings.
Whether you're considering an Airbnb investment in Beilngries, optimizing your existing vacation rental, or exploring rental arbitrage opportunities, understanding the Beilngries Airbnb data is crucial. Leveraging the low regulation environment is key to maximizing your short term rental income potential. Let's dive into the specifics.
Key Beilngries Airbnb Performance Metrics Overview
Monthly Airbnb Revenue Variations & Income Potential in Beilngries (2026)
Understanding the monthly revenue variations for Airbnb listings in Beilngries is key to maximizing your short term rental income potential. Seasonality significantly impacts earnings. Our analysis, based on data from the past 12 months, shows that the peak revenue month for STRs in Beilngries is typically August, while October often presents the lowest earnings, highlighting opportunities for strategic pricing adjustments during shoulder and low seasons. Explore the typical Airbnb income in Beilngries across different performance tiers:
- Best-in-class properties (Top 10%) achieve $3,043+ monthly, often utilizing dynamic pricing and superior guest experiences.
- Strong performing properties (Top 25%) earn $1,472 or more, indicating effective management and desirable locations/amenities.
- Typical properties (Median) generate around $830 per month, representing the average market performance.
- Entry-level properties (Bottom 25%) see earnings around $403, often with potential for optimization.
Average Monthly Airbnb Earnings Trend in Beilngries
Beilngries Airbnb Occupancy Rate Trends (2026)
Maximize your bookings by understanding the Beilngries STR occupancy trends. Seasonal demand shifts significantly influence how often properties are booked. Typically, Augustsees the highest demand (peak season occupancy), while January experiences the lowest (low season). Effective strategies, like adjusting minimum stays or offering promotions, can boost occupancy during slower periods. Here's how different property tiers perform in Beilngries:
- Best-in-class properties (Top 10%) achieve 64%+ occupancy, indicating high desirability and potentially optimized availability.
- Strong performing properties (Top 25%) maintain 43% or higher occupancy, suggesting good market fit and guest satisfaction.
- Typical properties (Median) have an occupancy rate around 26%.
- Entry-level properties (Bottom 25%) average 13% occupancy, potentially facing higher vacancy.
Average Monthly Occupancy Rate Trend in Beilngries
Average Daily Rate (ADR) Airbnb Trends in Beilngries (2026)
Effective short term rental pricing strategy in Beilngries involves understanding monthly ADR fluctuations. The Average Daily Rate (ADR) for Airbnb in Beilngries typically peaks in January and dips lowest during April. Leveraging Airbnb dynamic pricing tools or strategies based on this seasonality can significantly boost revenue. Here's a look at the typical nightly rates achieved:
- Best-in-class properties (Top 10%) command rates of $203+ per night, often due to premium features or locations.
- Strong performing properties (Top 25%) achieve nightly rates of $169 or more.
- Typical properties (Median) charge around $113 per night.
- Entry-level properties (Bottom 25%) earn around $77 per night.
Average Daily Rate (ADR) Trend by Month in Beilngries
Get Live Beilngries Market Intelligence 👇

Explore Real-time Analytics
Airbnb Seasonality Analysis & Trends in Beilngries (2026)
Peak Season (August, July, January)
- Revenue averages $1,515 per month
- Occupancy rates average 35.0%
- Daily rates average $134
Shoulder Season
- Revenue averages $1,225 per month
- Occupancy maintains around 29.8%
- Daily rates hold near $131
Low Season (February, June, October)
- Revenue drops to average $1,025 per month
- Occupancy decreases to average 28.8%
- Daily rates adjust to average $132
Seasonality Insights for Beilngries
- The Airbnb seasonality in Beilngries shows moderate seasonality with distinct peak and low periods. While the sections above show seasonal averages, it's also insightful to look at the extremes:
- During the high season, the absolute peak month showcases Beilngries's highest earning potential, with monthly revenues capable of climbing to $1,655, occupancy reaching a high of 42.5%, and ADRs peaking at $140.
- Conversely, the slowest single month of the year, typically falling within the low season, marks the market's lowest point. In this month, revenue might dip to $950, occupancy could drop to 20.1%, and ADRs may adjust down to $124.
- Understanding both the seasonal averages and these monthly peaks and troughs in revenue, occupancy, and ADR is crucial for maximizing your Airbnb profit potential in Beilngries.
Seasonal Strategies for Maximizing Profit
- Peak Season: Maximize revenue through premium pricing and potentially longer minimum stays. Ensure high availability.
- Low Season: Offer competitive pricing, special promotions (e.g., extended stay discounts), and flexible cancellation policies. Target off-season travelers like remote workers or budget-conscious guests.
- Shoulder Seasons: Implement dynamic pricing that balances peak and low rates. Target weekend travelers or specific events. Offer slightly more flexible terms than peak season.
- Regularly analyze your own performance against these Beilngries seasonality benchmarks and adjust your pricing and availability strategy accordingly.
Best Areas for Airbnb Investment in Beilngries (2026)
Exploring the top neighborhoods for short-term rentals in Beilngries? This section highlights key areas, outlining why they are attractive for hosts and guests, along with notable local attractions. Consider these locations based on your target guest profile and investment strategy.
| Neighborhood / Area | Why Host Here? (Target Guests & Appeal) | Key Attractions & Landmarks |
|---|---|---|
| Altstadt | The historic old town of Beilngries offers charm and character, with its quaint streets and traditional Bavarian architecture. It attracts visitors wanting to explore the cultural heritage of the region. | St. Walburga Church, Museum Beilngries, Old Town Square, Historic City Walls |
| Altmühlsee | A scenic lake area nearby, Altmühlsee is perfect for outdoor enthusiasts and families. Known for water sports, hiking, and biking, it draws visitors looking for nature and leisure activities. | Altmühlsee Lake, Beach areas, Biking trails, Hiking paths |
| Biergarten | The local beer gardens are a cultural staple in Bavaria, offering authentic German food and beer. They attract tourists looking for a quintessential Bavarian dining experience. | Local breweries, Traditional Bavarian cuisine, Outdoor seating, Cultural events |
| Kamerun | This area is famous for its charming countryside and views of the Altmühltal. Ideal for guests seeking peace, relaxation, and nature escapes. | Hiking trails, Scenic viewpoints, Nature reserves |
| Schwabelweis | A peaceful residential area that provides easy access to local amenities while being close to nature parks. Great for visitors who want a quiet retreat after exploring the area. | Nature parks, Local shops, Relaxing environments |
| Freizeitinsel | A recreational island that offers various leisure activities, including mini-golf and beach access. Perfect for families and groups looking for fun activities. | Mini-golf, Swimming areas, Picnic spots |
| Marktplatz | The marketplace is a bustling hub that features local vendors, shops, and open-air markets. Visitors enjoy vibrant local culture and cuisine in this area. | Weekly market, Local crafts, Eating spots |
| Bayerisches Golfzentrum | An attractive area for golf lovers, the golf center has beautiful courses and facilities that draw both amateur and experienced golfers. | Golf courses, Clubhouse, Pro shops |
Understanding Airbnb License Requirements & STR Laws in Beilngries (2026)
While Beilngries, Bavaria, Germany currently shows low STR regulations, specific Airbnb license requirements might still exist or change. Always verify the latest short term rental regulations and Airbnb license requirements directly with local government authorities for Beilngries to ensure full compliance before hosting.
(Source: AirROI data, 2026, finding no licensed listings among those analyzed)
Top Performing Airbnb Properties in Beilngries (2026)
Benchmark your potential! Explore examples of top-performing Airbnb properties in Beilngriesbased on Trailing Twelve Month (TTM) revenue. Analyze their characteristics, revenue, occupancy rate, and ADR to understand what drives success in this market.
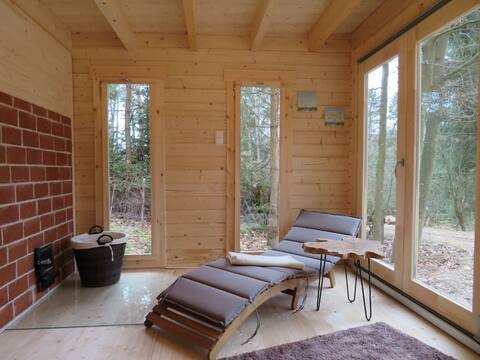
Private sauna/hot tub 2 separate houses for you
Entire Place • 3 bedrooms
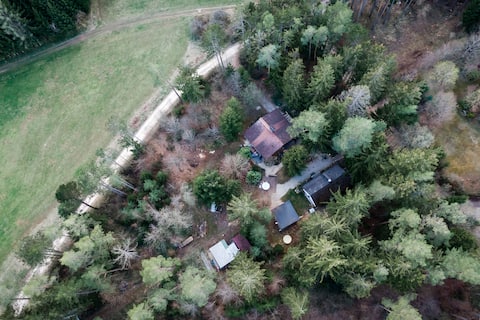
Private sauna/hot tub in the forest area
Entire Place • 2 bedrooms
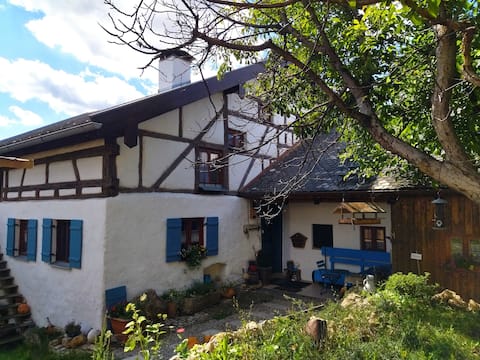
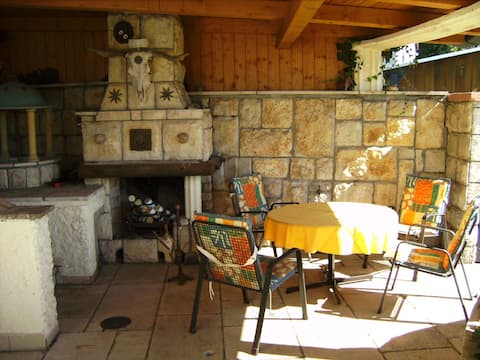
Vacation rental "Alte Schmiede" with garden (Beilngries)
Entire Place • 1 bedroom
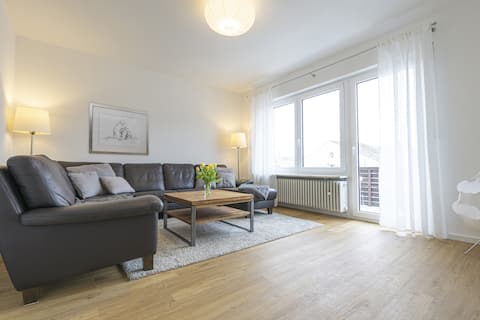
Vacation home Am Sulzpark (Beilngries)
Entire Place • 2 bedrooms
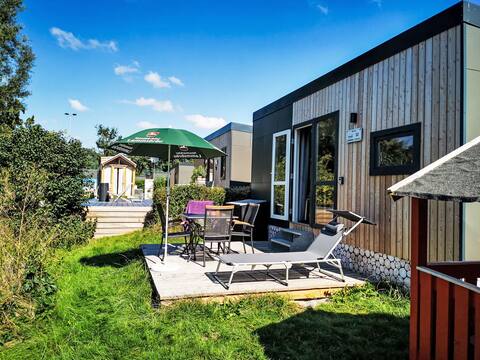
Tiny House Sonnendeck by Interhome
Entire Place • 1 bedroom
Reinhold Betz vacation home (Beilngries)
Entire Place • 2 bedrooms
Note: Performance varies based on location, size, amenities, seasonality, and management quality. Data reflects the past 12 months.
Top Performing Airbnb Hosts in Beilngries (2026)
Learn from the best! This table showcases top-performing Airbnb hosts in Beilngries based on the number of properties managed and estimated total revenue over the past year. Analyze their scale and performance metrics.
| Host Name | Properties | Grossing Revenue | Stay Reviews | Avg Rating |
|---|---|---|---|---|
| Anna-Lena | 21 | $119,088 | 106 | 4.82/5.0 |
| Michaela | 3 | $98,428 | 157 | 4.96/5.0 |
| Eva - Interhome | 4 | $28,488 | 4 | Not Rated |
| Anna | 2 | $16,983 | 43 | 4.84/5.0 |
| Edeltraud | 1 | $9,968 | 7 | 5.00/5.0 |
| Hermann | 1 | $5,950 | 11 | 4.73/5.0 |
| Novasol | 1 | $5,815 | 6 | 4.83/5.0 |
| Tobias | 1 | $5,798 | 23 | 4.96/5.0 |
| Barbara | 1 | $2,071 | 2 | Not Rated |
| Karen - BELVILLA | 1 | $1,777 | 9 | 4.78/5.0 |
Analyzing the strategies of top hosts, such as their property selection, pricing, and guest communication, can offer valuable lessons for optimizing your own Airbnb operations in Beilngries.
Dive Deeper: Advanced Beilngries STR Market Data (2026)
Ready to unlock more insights? AirROI provides access to advanced metrics and comprehensive Airbnb data for Beilngries. Explore detailed analytics beyond this report to refine your investment strategy, optimize pricing, and maximize your vacation rental profits.
Explore Advanced MetricsBeilngries Short-Term Rental Market Composition (2026): Property & Room Types
Room Type Distribution
Property Type Distribution
Market Composition Insights for Beilngries
- The Beilngries Airbnb market composition is heavily skewed towards Entire Home/Apt listings, which make up 63.9% of the 36 active rentals. This indicates strong guest preference for privacy and space.
- However, a notable 36.1% share for Private Rooms suggests opportunities for budget-conscious travelers or hosts renting out spare rooms.
- Looking at the property type distribution in Beilngries, Apartment/Condo properties are the most common (38.9%), reflecting the local real estate landscape.
- Houses represent a significant 36.1% portion, catering likely to families or larger groups.
- The presence of 25% Hotel/Boutique listings indicates integration with traditional hospitality.
Beilngries Airbnb Room Capacity Analysis (2026): Bedroom Distribution
Distribution of Listings by Number of Bedrooms
Room Capacity Insights for Beilngries
- The dominant room capacity in Beilngries is 1 bedroom listings, making up 66.7% of the market. This suggests a strong demand for properties suitable for couples or solo travelers.
- Together, 1 bedroom and 2 bedrooms properties represent 88.9% of the active Airbnb listings in Beilngries, indicating a high concentration in these sizes.
- With over half the market (66.7%) consisting of studios or 1-bedroom units, Beilngries is particularly well-suited for individuals or couples.
- Listings with 3+ bedrooms (2.8%) represent a smaller niche, potentially indicating an underserved market for larger group accommodations in Beilngries.
Beilngries Vacation Rental Guest Capacity Trends (2026)
Distribution of Listings by Guest Capacity
Guest Capacity Insights for Beilngries
- The most common guest capacity trend in Beilngries vacation rentals is listings accommodating 4 guests (38.9%). This suggests the primary traveler segment is likely small families or groups.
- Properties designed for 4 guests and 2 guests dominate the Beilngries STR market, accounting for 55.6% of listings.
- Listings for large groups (6+ guests) are relatively rare (2.8%), potentially indicating an opportunity for hosts targeting this segment in Beilngries.
- On average, properties in Beilngries are equipped to host 2.9 guests.
Beilngries Airbnb Booking Patterns (2026): Available vs. Booked Days
Available Days Distribution
Booked Days Distribution
Booking Pattern Insights for Beilngries
- The most common availability pattern in Beilngries falls within the 271-366 days range, representing 77.8% of listings. This suggests many properties have significant open periods on their calendars.
- Approximately 97.2% of listings show high availability (181+ days open annually), indicating potential for increased bookings or specific owner usage patterns.
- For booked days, the 31-90 days range is most frequent in Beilngries (47.2%), reflecting common guest stay durations or potential owner blocking patterns.
- A notable 2.8% of properties secure long booking periods (181+ days booked per year), highlighting successful long-term rental strategies or significant owner usage.
Beilngries Airbnb Minimum Stay Requirements Analysis
Distribution of Listings by Minimum Night Requirement
1 Night
13 listings
36.1% of total
2 Nights
4 listings
11.1% of total
3 Nights
3 listings
8.3% of total
4-6 Nights
7 listings
19.4% of total
30+ Nights
9 listings
25% of total
Key Insights
- The most prevalent minimum stay requirement in Beilngries is 1 Night, adopted by 36.1% of listings. This highlights the market's preference for shorter, flexible bookings.
- A significant segment (25%) caters to monthly stays (30+ nights) in Beilngries, pointing to opportunities in the extended-stay market.
Recommendations
- Align with the market by considering a 1 Night minimum stay, as 36.1% of Beilngries hosts use this setting.
- Explore offering discounts for stays of 30+ nights to attract the 25% of the market seeking extended stays.
- Adjust minimum nights based on seasonality – potentially shorter during low season and longer during peak demand periods in Beilngries.
Beilngries Airbnb Cancellation Policy Trends Analysis (2026)
Limited
13 listings
36.1% of total
Super Strict 60 Days
3 listings
8.3% of total
Flexible
3 listings
8.3% of total
Moderate
1 listings
2.8% of total
Firm
15 listings
41.7% of total
Strict
1 listings
2.8% of total
Cancellation Policy Insights for Beilngries
- The prevailing Airbnb cancellation policy trend in Beilngries is Firm, used by 41.7% of listings.
- There's a relatively balanced mix between guest-friendly (11.1%) and stricter (44.5%) policies, offering choices for different guest needs.
- Strict cancellation policies are quite rare (2.8%), potentially making listings with this policy less competitive unless justified by high demand or property type.
Recommendations for Hosts
- Consider adopting a Firm policy to align with the 41.7% market standard in Beilngries.
- Using a Strict policy might deter some guests, as only 2.8% of listings use it. Evaluate if potential revenue protection outweighs possible lower booking rates.
- Regularly review your cancellation policy against competitors and market demand shifts in Beilngries.
Beilngries STR Booking Lead Time Analysis (2026)
Average Booking Lead Time by Month
Booking Lead Time Insights for Beilngries
- The overall average booking lead time for vacation rentals in Beilngries is 78 days.
- Guests book furthest in advance for stays during May (average 89 days), likely coinciding with peak travel demand or local events.
- The shortest booking windows occur for stays in February (average 37 days), indicating more last-minute travel plans during this time.
- Seasonally, Spring (77 days avg.) sees the longest lead times, while Winter (66 days avg.) has the shortest, reflecting typical travel planning cycles.
Recommendations for Hosts
- Use the overall average lead time (78 days) as a baseline for your pricing and availability strategy in Beilngries.
- For May stays, consider implementing length-of-stay discounts or slightly higher rates for bookings made less than 89 days out to capitalize on advance planning.
- Target marketing efforts for the Spring season well in advance (at least 77 days) to capture early planners.
- Monitor your own booking lead times against these Beilngries averages to identify opportunities for dynamic pricing adjustments.
Popular & Essential Airbnb Amenities in Beilngries (2026)
Amenity Prevalence
Amenity Insights for Beilngries
- Popular amenities like TV, Wifi, Smoke alarm are common but not universal. Offering these can provide a competitive edge.
- Warning: Wifi is not universally provided but is considered essential globally. Ensure reliable Wifi is offered.
Recommendations for Hosts
- Consider adding popular differentiators like TV or Wifi to increase appeal.
- Highlight unique or less common amenities you offer (e.g., hot tub, dedicated workspace, EV charger) in your listing description and photos.
- Regularly check competitor amenities in Beilngries to stay competitive.
Beilngries Airbnb Guest Demographics & Profile Analysis (2026)
Guest Profile Summary for Beilngries
- The typical guest profile for Airbnb in Beilngries consists of primarily domestic travelers (77%), often arriving from nearby Munich, typically belonging to the Post-2000s (Gen Z/Alpha) group (50%), primarily speaking English or German.
- Domestic travelers account for 76.6% of guests.
- Key international markets include Germany (76.6%) and France (6.4%).
- Top languages spoken are English (41.4%) followed by German (37.9%).
- A significant demographic segment is the Post-2000s (Gen Z/Alpha) group, representing 50% of guests.
Recommendations for Hosts
- Target domestic marketing efforts towards travelers from Munich and Erlangen.
- Tailor amenities and listing descriptions to appeal to the dominant Post-2000s (Gen Z/Alpha) demographic (e.g., highlight fast WiFi, smart home features, local guides).
- Highlight unique local experiences or amenities relevant to the primary guest profile.
- Consider seasonal promotions aligned with peak travel times for key origin markets.
Nearby Short-Term Rental Market Comparison
How does the Beilngries Airbnb market stack up against its neighbors? Compare key performance metrics like average monthly revenue, ADR, and occupancy rates in surrounding areas to understand the broader regional STR landscape.
| Market | Active Properties | Monthly Revenue | Daily Rate | Avg. Occupancy |
|---|---|---|---|---|
| Poing | 16 | $2,939 | $162.94 | 57% |
| Pfaffenhofen an der Ilm | 11 | $2,842 | $197.93 | 48% |
| Unterschleißheim | 18 | $2,539 | $155.66 | 53% |
| Kollnburg | 12 | $2,526 | $317.10 | 32% |
| Herrsching am Ammersee | 47 | $2,321 | $183.14 | 52% |
| Dachau | 36 | $2,120 | $151.77 | 50% |
| Allersberg | 10 | $2,041 | $227.55 | 33% |
| Gräfelfing | 21 | $2,034 | $215.51 | 49% |
| Oberschleißheim | 28 | $2,000 | $136.98 | 57% |
| Gauting | 34 | $1,967 | $162.55 | 47% |