Bamberg Airbnb Market Analysis 2026: Short Term Rental Data & Vacation Rental Statistics in Bavaria, Germany
Is Airbnb profitable in Bamberg in 2026? Explore comprehensive Airbnb analytics for Bamberg, Bavaria, Germany to uncover income potential. This 2026 STR market report for Bamberg, based on AirROI data from February 2025 to January 2026, reveals key trends in the market of 211 active listings.
Whether you're considering an Airbnb investment in Bamberg, optimizing your existing vacation rental, or exploring rental arbitrage opportunities, understanding the Bamberg Airbnb data is crucial. Leveraging the low regulation environment is key to maximizing your short term rental income potential. Let's dive into the specifics.
Key Bamberg Airbnb Performance Metrics Overview
Monthly Airbnb Revenue Variations & Income Potential in Bamberg (2026)
Understanding the monthly revenue variations for Airbnb listings in Bamberg is key to maximizing your short term rental income potential. Seasonality significantly impacts earnings. Our analysis, based on data from the past 12 months, shows that the peak revenue month for STRs in Bamberg is typically October, while January often presents the lowest earnings, highlighting opportunities for strategic pricing adjustments during shoulder and low seasons. Explore the typical Airbnb income in Bamberg across different performance tiers:
- Best-in-class properties (Top 10%) achieve $3,475+ monthly, often utilizing dynamic pricing and superior guest experiences.
- Strong performing properties (Top 25%) earn $2,359 or more, indicating effective management and desirable locations/amenities.
- Typical properties (Median) generate around $1,494 per month, representing the average market performance.
- Entry-level properties (Bottom 25%) see earnings around $864, often with potential for optimization.
Average Monthly Airbnb Earnings Trend in Bamberg
Bamberg Airbnb Occupancy Rate Trends (2026)
Maximize your bookings by understanding the Bamberg STR occupancy trends. Seasonal demand shifts significantly influence how often properties are booked. Typically, Augustsees the highest demand (peak season occupancy), while January experiences the lowest (low season). Effective strategies, like adjusting minimum stays or offering promotions, can boost occupancy during slower periods. Here's how different property tiers perform in Bamberg:
- Best-in-class properties (Top 10%) achieve 80%+ occupancy, indicating high desirability and potentially optimized availability.
- Strong performing properties (Top 25%) maintain 66% or higher occupancy, suggesting good market fit and guest satisfaction.
- Typical properties (Median) have an occupancy rate around 48%.
- Entry-level properties (Bottom 25%) average 30% occupancy, potentially facing higher vacancy.
Average Monthly Occupancy Rate Trend in Bamberg
Average Daily Rate (ADR) Airbnb Trends in Bamberg (2026)
Effective short term rental pricing strategy in Bamberg involves understanding monthly ADR fluctuations. The Average Daily Rate (ADR) for Airbnb in Bamberg typically peaks in October and dips lowest during February. Leveraging Airbnb dynamic pricing tools or strategies based on this seasonality can significantly boost revenue. Here's a look at the typical nightly rates achieved:
- Best-in-class properties (Top 10%) command rates of $216+ per night, often due to premium features or locations.
- Strong performing properties (Top 25%) achieve nightly rates of $143 or more.
- Typical properties (Median) charge around $100 per night.
- Entry-level properties (Bottom 25%) earn around $76 per night.
Average Daily Rate (ADR) Trend by Month in Bamberg
Get Live Bamberg Market Intelligence 👇

Explore Real-time Analytics
Airbnb Seasonality Analysis & Trends in Bamberg (2026)
Peak Season (October, August, September)
- Revenue averages $2,255 per month
- Occupancy rates average 57.2%
- Daily rates average $129
Shoulder Season
- Revenue averages $1,895 per month
- Occupancy maintains around 49.8%
- Daily rates hold near $122
Low Season (January, February, March)
- Revenue drops to average $1,172 per month
- Occupancy decreases to average 35.0%
- Daily rates adjust to average $112
Seasonality Insights for Bamberg
- The Airbnb seasonality in Bamberg shows highly seasonal trends requiring careful strategy. While the sections above show seasonal averages, it's also insightful to look at the extremes:
- During the high season, the absolute peak month showcases Bamberg's highest earning potential, with monthly revenues capable of climbing to $2,262, occupancy reaching a high of 58.6%, and ADRs peaking at $135.
- Conversely, the slowest single month of the year, typically falling within the low season, marks the market's lowest point. In this month, revenue might dip to $968, occupancy could drop to 25.2%, and ADRs may adjust down to $106.
- Understanding both the seasonal averages and these monthly peaks and troughs in revenue, occupancy, and ADR is crucial for maximizing your Airbnb profit potential in Bamberg.
Seasonal Strategies for Maximizing Profit
- Peak Season: Maximize revenue through premium pricing and potentially longer minimum stays. Ensure high availability.
- Low Season: Offer competitive pricing, special promotions (e.g., extended stay discounts), and flexible cancellation policies. Target off-season travelers like remote workers or budget-conscious guests.
- Shoulder Seasons: Implement dynamic pricing that balances peak and low rates. Target weekend travelers or specific events. Offer slightly more flexible terms than peak season.
- Regularly analyze your own performance against these Bamberg seasonality benchmarks and adjust your pricing and availability strategy accordingly.
Best Areas for Airbnb Investment in Bamberg (2026)
Exploring the top neighborhoods for short-term rentals in Bamberg? This section highlights key areas, outlining why they are attractive for hosts and guests, along with notable local attractions. Consider these locations based on your target guest profile and investment strategy.
| Neighborhood / Area | Why Host Here? (Target Guests & Appeal) | Key Attractions & Landmarks |
|---|---|---|
| Old Town (Altstadt) | Bamberg's UNESCO World Heritage site known for its medieval architecture and charming streets. It attracts tourists interested in history and culture, making it perfect for Airbnb hosting. | Bamberg Cathedral, Old Town Hall, Little Venice, Bamberger Dom, Historical Museum, Rosengarten |
| Bamberg Brewery District (Bierstadt) | Famous for its many historic breweries and beer gardens, drawing tourists and locals alike who want to enjoy traditional Franconian beer culture. | Schlenkerla, Bamberger Bier, Biergarten am Alten Rathaus, Kellerwald, Bamberg Beer Museum |
| Sandstraße | A vibrant area with many restaurants, cafes, and shops, appealing to both tourists and locals. The lively atmosphere is attractive to young travelers. | Sandstraße market, Laubanger Park, Various local eateries, Cafés, Theater Bamberg |
| Geyerswörthstraße | Located near the river, this area is favored for its scenic views and pleasant walks, appealing to guests looking for a relaxing stay. | Alte Feuerwache, River Regnitz, Park an der Regnitz, Bamberg's bridges, Cafés along the river |
| Bamberg Botanical Garden | A beautiful and serene location, perfect for nature lovers and those seeking tranquility, appealing to families and quiet travelers. | Botanischer Garten Bamberg, Scenic walking paths, Flower exhibitions, Greenhouses, Picnic spots |
| Margarethenstraße | A calm residential area close to the city center, ideal for long-term stays by professionals and families. | Local Shops, Parks, Proximity to public transport, Quiet neighborhood vibes |
| Albrecht-Dürer-Platz | A lively square that hosts events, markets, and is very central, attracting visitors looking for a vibrant community atmosphere. | Weekly markets, Cultural events, Dining options, Street performances |
| Memmelsdorf | A quiet suburb of Bamberg, attractive for those looking for a peaceful retreat yet close enough to the city for convenience. | Local wineries, Natural parks, Scenic views, Traditional Franconian cuisine, Cycling paths |
Understanding Airbnb License Requirements & STR Laws in Bamberg (2026)
While Bamberg, Bavaria, Germany currently shows low STR regulations, specific Airbnb license requirements might still exist or change. Always verify the latest short term rental regulations and Airbnb license requirements directly with local government authorities for Bamberg to ensure full compliance before hosting.
(Source: AirROI data, 2026, finding no licensed listings among those analyzed)
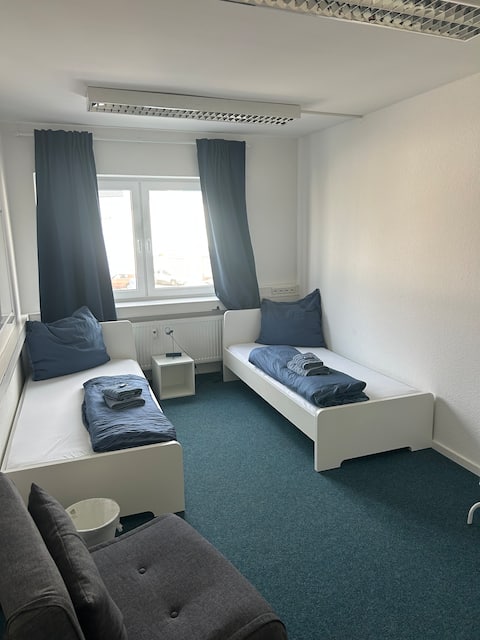
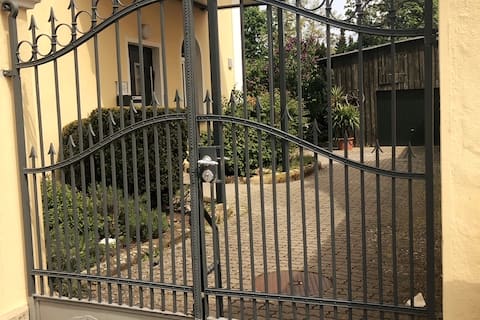
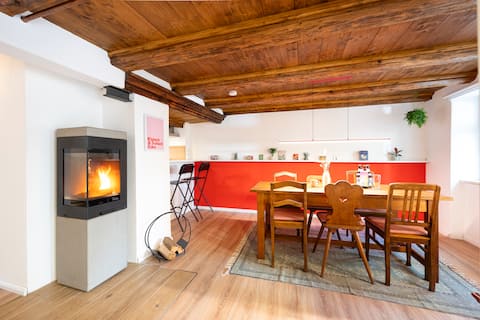
Top Performing Airbnb Properties in Bamberg (2026)
Benchmark your potential! Explore examples of top-performing Airbnb properties in Bambergbased on Trailing Twelve Month (TTM) revenue. Analyze their characteristics, revenue, occupancy rate, and ADR to understand what drives success in this market.

Family reunion 5 bedrooms - 13 people - 3 bathrooms + parking
Entire Place • 5 bedrooms

Bunter Hund Apartments: Balcony, Central, Spacious
Entire Place • 3 bedrooms
Large apartment for 10 people
Entire Place • 4 bedrooms
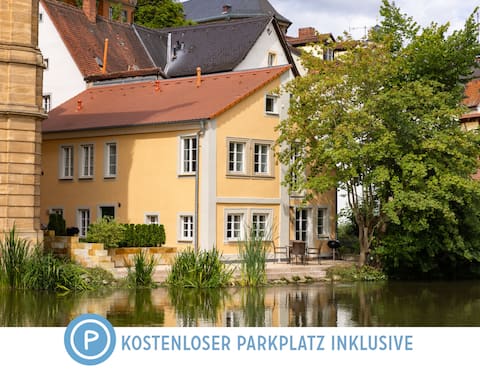
Concordia33® — Dream Apartment on the River
Entire Place • 1 bedroom
Group meeting 6 bedrooms, 8 beds for 15 people.
Entire Place • 6 bedrooms
Bunter Hund Apartments: historic old town house
Entire Place • 3 bedrooms
Note: Performance varies based on location, size, amenities, seasonality, and management quality. Data reflects the past 12 months.
Top Performing Airbnb Hosts in Bamberg (2026)
Learn from the best! This table showcases top-performing Airbnb hosts in Bamberg based on the number of properties managed and estimated total revenue over the past year. Analyze their scale and performance metrics.
| Host Name | Properties | Grossing Revenue | Stay Reviews | Avg Rating |
|---|---|---|---|---|
| Johannes | 12 | $327,863 | 283 | 4.74/5.0 |
| Heiko | 7 | $253,850 | 431 | 4.89/5.0 |
| Jörg | 6 | $208,396 | 107 | 4.95/5.0 |
| Renata | 8 | $160,032 | 470 | 4.74/5.0 |
| Familie | 6 | $155,600 | 266 | 4.95/5.0 |
| Matthias | 6 | $134,942 | 116 | 4.61/5.0 |
| Simon | 2 | $134,141 | 55 | 4.92/5.0 |
| Limehome | 6 | $130,294 | 126 | 4.57/5.0 |
| Matthias | 5 | $122,227 | 107 | 4.58/5.0 |
| BeckHomes | 2 | $86,799 | 120 | 4.75/5.0 |
Analyzing the strategies of top hosts, such as their property selection, pricing, and guest communication, can offer valuable lessons for optimizing your own Airbnb operations in Bamberg.
Dive Deeper: Advanced Bamberg STR Market Data (2026)
Ready to unlock more insights? AirROI provides access to advanced metrics and comprehensive Airbnb data for Bamberg. Explore detailed analytics beyond this report to refine your investment strategy, optimize pricing, and maximize your vacation rental profits.
Explore Advanced MetricsBamberg Short-Term Rental Market Composition (2026): Property & Room Types
Room Type Distribution
Property Type Distribution
Market Composition Insights for Bamberg
- The Bamberg Airbnb market composition is heavily skewed towards Entire Home/Apt listings, which make up 83.4% of the 211 active rentals. This indicates strong guest preference for privacy and space.
- Looking at the property type distribution in Bamberg, Apartment/Condo properties are the most common (89.1%), reflecting the local real estate landscape.
- Smaller segments like hotel/boutique (combined 3.3%) offer potential for unique stay experiences.
Bamberg Airbnb Room Capacity Analysis (2026): Bedroom Distribution
Distribution of Listings by Number of Bedrooms
Room Capacity Insights for Bamberg
- The dominant room capacity in Bamberg is 1 bedroom listings, making up 49.8% of the market. This suggests a strong demand for properties suitable for couples or solo travelers.
- Together, 1 bedroom and 2 bedrooms properties represent 68.8% of the active Airbnb listings in Bamberg, indicating a high concentration in these sizes.
- Listings with 3+ bedrooms (8.6%) represent a smaller niche, potentially indicating an underserved market for larger group accommodations in Bamberg.
Bamberg Vacation Rental Guest Capacity Trends (2026)
Distribution of Listings by Guest Capacity
Guest Capacity Insights for Bamberg
- The most common guest capacity trend in Bamberg vacation rentals is listings accommodating 2 guests (32.2%). This suggests the primary traveler segment is likely couples or solo travelers.
- Properties designed for 2 guests and 4 guests dominate the Bamberg STR market, accounting for 51.6% of listings.
- 12.8% of properties accommodate 6+ guests, serving the market segment for larger families or group travel in Bamberg.
- On average, properties in Bamberg are equipped to host 3.0 guests.
Bamberg Airbnb Booking Patterns (2026): Available vs. Booked Days
Available Days Distribution
Booked Days Distribution
Booking Pattern Insights for Bamberg
- The most common availability pattern in Bamberg falls within the 181-270 days range, representing 37% of listings. This suggests many properties have significant open periods on their calendars.
- Approximately 64.5% of listings show high availability (181+ days open annually), indicating potential for increased bookings or specific owner usage patterns.
- For booked days, the 91-180 days range is most frequent in Bamberg (38.9%), reflecting common guest stay durations or potential owner blocking patterns.
- A notable 36.1% of properties secure long booking periods (181+ days booked per year), highlighting successful long-term rental strategies or significant owner usage.
Bamberg Airbnb Minimum Stay Requirements Analysis
Distribution of Listings by Minimum Night Requirement
1 Night
47 listings
22.3% of total
2 Nights
49 listings
23.2% of total
3 Nights
13 listings
6.2% of total
4-6 Nights
12 listings
5.7% of total
7-29 Nights
15 listings
7.1% of total
30+ Nights
75 listings
35.5% of total
Key Insights
- The most prevalent minimum stay requirement in Bamberg is 30+ Nights, adopted by 35.5% of listings. This highlights the market's preference for longer commitments.
- A significant segment (35.5%) caters to monthly stays (30+ nights) in Bamberg, pointing to opportunities in the extended-stay market.
Recommendations
- Align with the market by considering a 30+ Nights minimum stay, as 35.5% of Bamberg hosts use this setting.
- If feasible, allowing 1-night stays, especially midweek or during low season, could capture last-minute bookings, as only 22.3% currently do.
- Explore offering discounts for stays of 30+ nights to attract the 35.5% of the market seeking extended stays.
- Adjust minimum nights based on seasonality – potentially shorter during low season and longer during peak demand periods in Bamberg.
Bamberg Airbnb Cancellation Policy Trends Analysis (2026)
Limited
3 listings
1.4% of total
Super Strict 60 Days
1 listings
0.5% of total
Flexible
56 listings
26.5% of total
Moderate
83 listings
39.3% of total
Firm
57 listings
27% of total
Strict
11 listings
5.2% of total
Cancellation Policy Insights for Bamberg
- The prevailing Airbnb cancellation policy trend in Bamberg is Moderate, used by 39.3% of listings.
- There's a relatively balanced mix between guest-friendly (65.8%) and stricter (32.2%) policies, offering choices for different guest needs.
- Strict cancellation policies are quite rare (5.2%), potentially making listings with this policy less competitive unless justified by high demand or property type.
Recommendations for Hosts
- Consider adopting a Moderate policy to align with the 39.3% market standard in Bamberg.
- Using a Strict policy might deter some guests, as only 5.2% of listings use it. Evaluate if potential revenue protection outweighs possible lower booking rates.
- Regularly review your cancellation policy against competitors and market demand shifts in Bamberg.
Bamberg STR Booking Lead Time Analysis (2026)
Average Booking Lead Time by Month
Booking Lead Time Insights for Bamberg
- The overall average booking lead time for vacation rentals in Bamberg is 61 days.
- Guests book furthest in advance for stays during May (average 82 days), likely coinciding with peak travel demand or local events.
- The shortest booking windows occur for stays in January (average 33 days), indicating more last-minute travel plans during this time.
- Seasonally, Summer (74 days avg.) sees the longest lead times, while Winter (40 days avg.) has the shortest, reflecting typical travel planning cycles.
Recommendations for Hosts
- Use the overall average lead time (61 days) as a baseline for your pricing and availability strategy in Bamberg.
- For May stays, consider implementing length-of-stay discounts or slightly higher rates for bookings made less than 82 days out to capitalize on advance planning.
- Target marketing efforts for the Summer season well in advance (at least 74 days) to capture early planners.
- Monitor your own booking lead times against these Bamberg averages to identify opportunities for dynamic pricing adjustments.
Popular & Essential Airbnb Amenities in Bamberg (2026)
Amenity Prevalence
Amenity Insights for Bamberg
- Essential amenities in Bamberg that guests expect include: Wifi. Lacking these (this) could significantly impact bookings.
- Popular amenities like Heating, Kitchen, Smoke alarm are common but not universal. Offering these can provide a competitive edge.
Recommendations for Hosts
- Ensure your listing includes all essential amenities for Bamberg: Wifi.
- Prioritize adding missing essentials: Wifi.
- Consider adding popular differentiators like Heating or Kitchen to increase appeal.
- Highlight unique or less common amenities you offer (e.g., hot tub, dedicated workspace, EV charger) in your listing description and photos.
- Regularly check competitor amenities in Bamberg to stay competitive.
Bamberg Airbnb Guest Demographics & Profile Analysis (2026)
Guest Profile Summary for Bamberg
- The typical guest profile for Airbnb in Bamberg consists of primarily domestic travelers (69%), often arriving from nearby Berlin, typically belonging to the Post-2000s (Gen Z/Alpha) group (50%), primarily speaking English or German.
- Domestic travelers account for 69.3% of guests.
- Key international markets include Germany (69.3%) and United States (7.8%).
- Top languages spoken are English (40.5%) followed by German (33.1%).
- A significant demographic segment is the Post-2000s (Gen Z/Alpha) group, representing 50% of guests.
Recommendations for Hosts
- Target domestic marketing efforts towards travelers from Berlin and Munich.
- Tailor amenities and listing descriptions to appeal to the dominant Post-2000s (Gen Z/Alpha) demographic (e.g., highlight fast WiFi, smart home features, local guides).
- Highlight unique local experiences or amenities relevant to the primary guest profile.
- Consider seasonal promotions aligned with peak travel times for key origin markets.
Nearby Short-Term Rental Market Comparison
How does the Bamberg Airbnb market stack up against its neighbors? Compare key performance metrics like average monthly revenue, ADR, and occupancy rates in surrounding areas to understand the broader regional STR landscape.
| Market | Active Properties | Monthly Revenue | Daily Rate | Avg. Occupancy |
|---|---|---|---|---|
| Kusterdingen | 10 | $3,119 | $229.94 | 43% |
| Poing | 16 | $2,939 | $162.94 | 57% |
| Pfaffenhofen an der Ilm | 11 | $2,842 | $197.93 | 48% |
| Unterschleißheim | 18 | $2,539 | $155.66 | 53% |
| Herrsching am Ammersee | 47 | $2,321 | $183.14 | 52% |
| Dachau | 36 | $2,120 | $151.77 | 50% |
| Allersberg | 10 | $2,041 | $227.55 | 33% |
| Gräfelfing | 21 | $2,034 | $215.51 | 49% |
| Oberschleißheim | 28 | $2,000 | $136.98 | 57% |
| Gauting | 34 | $1,967 | $162.55 | 47% |