Bad Oberdorf Airbnb Market Analysis 2026: Short Term Rental Data & Vacation Rental Statistics in Bavaria, Germany
Is Airbnb profitable in Bad Oberdorf in 2026? Explore comprehensive Airbnb analytics for Bad Oberdorf, Bavaria, Germany to uncover income potential. This 2026 STR market report for Bad Oberdorf, based on AirROI data from February 2025 to January 2026, reveals key trends in the niche market of 21 active listings.
Whether you're considering an Airbnb investment in Bad Oberdorf, optimizing your existing vacation rental, or exploring rental arbitrage opportunities, understanding the Bad Oberdorf Airbnb data is crucial. Leveraging the low regulation environment is key to maximizing your short term rental income potential. Let's dive into the specifics.
Key Bad Oberdorf Airbnb Performance Metrics Overview
Monthly Airbnb Revenue Variations & Income Potential in Bad Oberdorf (2026)
Understanding the monthly revenue variations for Airbnb listings in Bad Oberdorf is key to maximizing your short term rental income potential. Seasonality significantly impacts earnings. Our analysis, based on data from the past 12 months, shows that the peak revenue month for STRs in Bad Oberdorf is typically September, while April often presents the lowest earnings, highlighting opportunities for strategic pricing adjustments during shoulder and low seasons. Explore the typical Airbnb income in Bad Oberdorf across different performance tiers:
- Best-in-class properties (Top 10%) achieve $4,497+ monthly, often utilizing dynamic pricing and superior guest experiences.
- Strong performing properties (Top 25%) earn $3,192 or more, indicating effective management and desirable locations/amenities.
- Typical properties (Median) generate around $2,186 per month, representing the average market performance.
- Entry-level properties (Bottom 25%) see earnings around $1,459, often with potential for optimization.
Average Monthly Airbnb Earnings Trend in Bad Oberdorf
Bad Oberdorf Airbnb Occupancy Rate Trends (2026)
Maximize your bookings by understanding the Bad Oberdorf STR occupancy trends. Seasonal demand shifts significantly influence how often properties are booked. Typically, Septembersees the highest demand (peak season occupancy), while November experiences the lowest (low season). Effective strategies, like adjusting minimum stays or offering promotions, can boost occupancy during slower periods. Here's how different property tiers perform in Bad Oberdorf:
- Best-in-class properties (Top 10%) achieve 89%+ occupancy, indicating high desirability and potentially optimized availability.
- Strong performing properties (Top 25%) maintain 75% or higher occupancy, suggesting good market fit and guest satisfaction.
- Typical properties (Median) have an occupancy rate around 53%.
- Entry-level properties (Bottom 25%) average 32% occupancy, potentially facing higher vacancy.
Average Monthly Occupancy Rate Trend in Bad Oberdorf
Average Daily Rate (ADR) Airbnb Trends in Bad Oberdorf (2026)
Effective short term rental pricing strategy in Bad Oberdorf involves understanding monthly ADR fluctuations. The Average Daily Rate (ADR) for Airbnb in Bad Oberdorf typically peaks in January and dips lowest during April. Leveraging Airbnb dynamic pricing tools or strategies based on this seasonality can significantly boost revenue. Here's a look at the typical nightly rates achieved:
- Best-in-class properties (Top 10%) command rates of $231+ per night, often due to premium features or locations.
- Strong performing properties (Top 25%) achieve nightly rates of $190 or more.
- Typical properties (Median) charge around $138 per night.
- Entry-level properties (Bottom 25%) earn around $105 per night.
Average Daily Rate (ADR) Trend by Month in Bad Oberdorf
Get Live Bad Oberdorf Market Intelligence 👇

Explore Real-time Analytics
Airbnb Seasonality Analysis & Trends in Bad Oberdorf (2026)
Peak Season (September, July, August)
- Revenue averages $3,714 per month
- Occupancy rates average 73.7%
- Daily rates average $208
Shoulder Season
- Revenue averages $2,510 per month
- Occupancy maintains around 49.6%
- Daily rates hold near $198
Low Season (April, November, December)
- Revenue drops to average $1,789 per month
- Occupancy decreases to average 40.8%
- Daily rates adjust to average $196
Seasonality Insights for Bad Oberdorf
- The Airbnb seasonality in Bad Oberdorf shows highly seasonal trends requiring careful strategy. While the sections above show seasonal averages, it's also insightful to look at the extremes:
- During the high season, the absolute peak month showcases Bad Oberdorf's highest earning potential, with monthly revenues capable of climbing to $3,896, occupancy reaching a high of 75.3%, and ADRs peaking at $215.
- Conversely, the slowest single month of the year, typically falling within the low season, marks the market's lowest point. In this month, revenue might dip to $1,636, occupancy could drop to 36.9%, and ADRs may adjust down to $181.
- Understanding both the seasonal averages and these monthly peaks and troughs in revenue, occupancy, and ADR is crucial for maximizing your Airbnb profit potential in Bad Oberdorf.
Seasonal Strategies for Maximizing Profit
- Peak Season: Maximize revenue through premium pricing and potentially longer minimum stays. Ensure high availability.
- Low Season: Offer competitive pricing, special promotions (e.g., extended stay discounts), and flexible cancellation policies. Target off-season travelers like remote workers or budget-conscious guests.
- Shoulder Seasons: Implement dynamic pricing that balances peak and low rates. Target weekend travelers or specific events. Offer slightly more flexible terms than peak season.
- Regularly analyze your own performance against these Bad Oberdorf seasonality benchmarks and adjust your pricing and availability strategy accordingly.
Best Areas for Airbnb Investment in Bad Oberdorf (2026)
Exploring the top neighborhoods for short-term rentals in Bad Oberdorf? This section highlights key areas, outlining why they are attractive for hosts and guests, along with notable local attractions. Consider these locations based on your target guest profile and investment strategy.
| Neighborhood / Area | Why Host Here? (Target Guests & Appeal) | Key Attractions & Landmarks |
|---|---|---|
| Bad Oberdorf Center | The main area of Bad Oberdorf offers easy access to local shops, restaurants, and the beautiful landscape of the Bavarian Alps, making it an attractive spot for tourists. | Bavarian Alps, Local shops and cafés, Hiking trails, Bad Oberdorf spa facilities |
| Kurpark | A lovely park area that provides a serene environment, attracting those looking for relaxation and nature. Great for Airbnb stays focused on wellness and tranquility. | Kurpark Gardens, Walking paths, Wellness facilities, Annual local events |
| Alpsee Lake | A stunning lake located just a short distance from Bad Oberdorf, popular for swimming, boating, and scenic views. Perfect for active travelers. | Alpsee Lake boat rentals, Swimming opportunities, Water sports, Picnic areas, Scenic viewpoints |
| Fellhornbahn | A ski resort area that attracts winter sports enthusiasts, making it a prime location for seasonal short-term rentals. | Ski slopes, Cable car access, Mountain hiking in summer, Scenic views |
| Bavarian National Park | Adjacent to Bad Oberdorf, the national park offers incredible hiking trails and wildlife, appealing to nature lovers and adventure seekers. | Hiking trails, Biodiversity, Wildlife observation, Nature tours |
| Oberstdorf | A nearby town known for its ski resorts and summer hiking, Oberstdorf attracts both winter and summer tourists, providing year-round rental opportunities. | Skiing and snowboarding, Hiking trails, Oberstdorf ski jumping, Local festivals |
| Sonthofen | A charming town close to Bad Oberdorf, offering additional amenities and attractions that draw visitors to the area. | Historic town center, Local dining options, Cultural events, Proximity to outdoor activities |
| Café und Weinstube | An area popular for its local cafes and wine bars, attracting visitors looking for authentic Bavarian experiences and culinary delights. | Local wineries, Culinary festivals, Live music events, Scenic outlooks |
Understanding Airbnb License Requirements & STR Laws in Bad Oberdorf (2026)
While Bad Oberdorf, Bavaria, Germany currently shows low STR regulations, specific Airbnb license requirements might still exist or change. Always verify the latest short term rental regulations and Airbnb license requirements directly with local government authorities for Bad Oberdorf to ensure full compliance before hosting.
(Source: AirROI data, 2026, based on 5% licensed listings)
Top Performing Airbnb Properties in Bad Oberdorf (2026)
Benchmark your potential! Explore examples of top-performing Airbnb properties in Bad Oberdorfbased on Trailing Twelve Month (TTM) revenue. Analyze their characteristics, revenue, occupancy rate, and ADR to understand what drives success in this market.
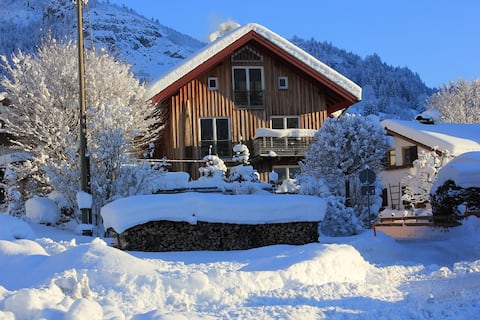
Alpine chalet Panorama Terrace Skiing Wellness
Entire Place • 5 bedrooms
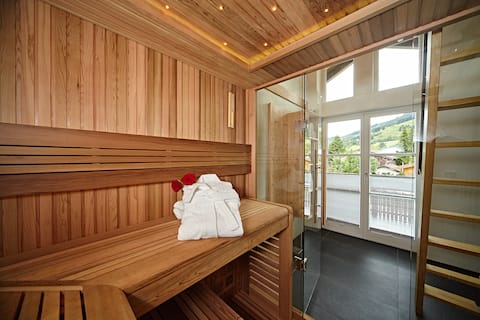
Apartment Hirschbergblick with sauna
Entire Place • 1 bedroom
Vacation apartment in Allgäu "Am Hirschbach"
Entire Place • 2 bedrooms

Panoramic Apt & Free Alpine Pass
Entire Place • 1 bedroom
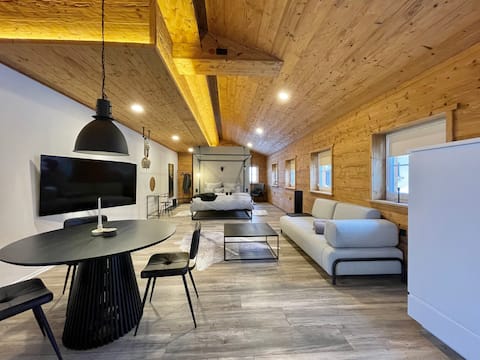
Individual Alpine loft in the Allgäu
Entire Place • N/A
Alpine coziness in the Allgäu
Entire Place • 2 bedrooms
Note: Performance varies based on location, size, amenities, seasonality, and management quality. Data reflects the past 12 months.
Top Performing Airbnb Hosts in Bad Oberdorf (2026)
Learn from the best! This table showcases top-performing Airbnb hosts in Bad Oberdorf based on the number of properties managed and estimated total revenue over the past year. Analyze their scale and performance metrics.
| Host Name | Properties | Grossing Revenue | Stay Reviews | Avg Rating |
|---|---|---|---|---|
| Thorsten | 5 | $165,573 | 75 | 4.96/5.0 |
| Alexander | 1 | $90,759 | 44 | 4.82/5.0 |
| Maria | 3 | $50,668 | 4 | Not Rated |
| Jakob | 2 | $45,385 | 18 | 5.00/5.0 |
| Britta | 1 | $38,198 | 285 | 4.99/5.0 |
| Cornelia | 1 | $25,987 | 104 | 4.97/5.0 |
| Maximilian | 1 | $23,944 | 135 | 4.95/5.0 |
| Alice | 1 | $22,627 | 134 | 4.89/5.0 |
| Daniel | 1 | $21,883 | 53 | 4.77/5.0 |
| Matthias | 1 | $19,274 | 9 | 5.00/5.0 |
Analyzing the strategies of top hosts, such as their property selection, pricing, and guest communication, can offer valuable lessons for optimizing your own Airbnb operations in Bad Oberdorf.
Dive Deeper: Advanced Bad Oberdorf STR Market Data (2026)
Ready to unlock more insights? AirROI provides access to advanced metrics and comprehensive Airbnb data for Bad Oberdorf. Explore detailed analytics beyond this report to refine your investment strategy, optimize pricing, and maximize your vacation rental profits.
Explore Advanced MetricsBad Oberdorf Short-Term Rental Market Composition (2026): Property & Room Types
Room Type Distribution
Property Type Distribution
Market Composition Insights for Bad Oberdorf
- The Bad Oberdorf Airbnb market composition is heavily skewed towards Entire Home/Apt listings, which make up 100% of the 21 active rentals. This indicates strong guest preference for privacy and space.
- Looking at the property type distribution in Bad Oberdorf, Apartment/Condo properties are the most common (81%), reflecting the local real estate landscape.
- Houses represent a significant 19% portion, catering likely to families or larger groups.
Bad Oberdorf Airbnb Room Capacity Analysis (2026): Bedroom Distribution
Distribution of Listings by Number of Bedrooms
Room Capacity Insights for Bad Oberdorf
- The dominant room capacity in Bad Oberdorf is 1 bedroom listings, making up 52.4% of the market. This suggests a strong demand for properties suitable for couples or solo travelers.
- Together, 1 bedroom and 2 bedrooms properties represent 76.2% of the active Airbnb listings in Bad Oberdorf, indicating a high concentration in these sizes.
- With over half the market (52.4%) consisting of studios or 1-bedroom units, Bad Oberdorf is particularly well-suited for individuals or couples.
Bad Oberdorf Vacation Rental Guest Capacity Trends (2026)
Distribution of Listings by Guest Capacity
Guest Capacity Insights for Bad Oberdorf
- The most common guest capacity trend in Bad Oberdorf vacation rentals is listings accommodating 4 guests (42.9%). This suggests the primary traveler segment is likely small families or groups.
- Properties designed for 4 guests and 2 guests dominate the Bad Oberdorf STR market, accounting for 85.8% of listings.
- A significant 42.9% of listings cater specifically to 1-2 guests, highlighting strong demand from couples and solo travelers in Bad Oberdorf.
- Listings for large groups (6+ guests) are relatively rare (4.8%), potentially indicating an opportunity for hosts targeting this segment in Bad Oberdorf.
- On average, properties in Bad Oberdorf are equipped to host 3.3 guests.
Bad Oberdorf Airbnb Booking Patterns (2026): Available vs. Booked Days
Available Days Distribution
Booked Days Distribution
Booking Pattern Insights for Bad Oberdorf
- The most common availability pattern in Bad Oberdorf falls within the 91-180 days range, representing 42.9% of listings. This suggests many properties have significant open periods on their calendars.
- Approximately 47.7% of listings show high availability (181+ days open annually), indicating potential for increased bookings or specific owner usage patterns.
- For booked days, the 181-270 days range is most frequent in Bad Oberdorf (42.9%), reflecting common guest stay durations or potential owner blocking patterns.
- A notable 52.4% of properties secure long booking periods (181+ days booked per year), highlighting successful long-term rental strategies or significant owner usage.
Bad Oberdorf Airbnb Minimum Stay Requirements Analysis
Distribution of Listings by Minimum Night Requirement
2 Nights
3 listings
14.3% of total
3 Nights
1 listings
4.8% of total
4-6 Nights
9 listings
42.9% of total
7-29 Nights
1 listings
4.8% of total
30+ Nights
7 listings
33.3% of total
Key Insights
- The most prevalent minimum stay requirement in Bad Oberdorf is 4-6 Nights, adopted by 42.9% of listings. This highlights the market's preference for longer commitments.
- Very short stays (1-2 nights) are less common (14.3%), suggesting hosts prefer slightly longer bookings to optimize turnover.
- A significant segment (33.3%) caters to monthly stays (30+ nights) in Bad Oberdorf, pointing to opportunities in the extended-stay market.
Recommendations
- Align with the market by considering a 4-6 Nights minimum stay, as 42.9% of Bad Oberdorf hosts use this setting.
- Explore offering discounts for stays of 30+ nights to attract the 33.3% of the market seeking extended stays.
- Adjust minimum nights based on seasonality – potentially shorter during low season and longer during peak demand periods in Bad Oberdorf.
Bad Oberdorf Airbnb Cancellation Policy Trends Analysis (2026)
Super Strict 60 Days
5 listings
23.8% of total
Flexible
1 listings
4.8% of total
Moderate
2 listings
9.5% of total
Firm
12 listings
57.1% of total
Strict
1 listings
4.8% of total
Cancellation Policy Insights for Bad Oberdorf
- The prevailing Airbnb cancellation policy trend in Bad Oberdorf is Firm, used by 57.1% of listings.
- A majority (61.9%) of hosts in Bad Oberdorf utilize Firm or Strict policies, indicating a market where hosts prioritize booking security.
- Strict cancellation policies are quite rare (4.8%), potentially making listings with this policy less competitive unless justified by high demand or property type.
Recommendations for Hosts
- Consider adopting a Firm policy to align with the 57.1% market standard in Bad Oberdorf.
- Using a Strict policy might deter some guests, as only 4.8% of listings use it. Evaluate if potential revenue protection outweighs possible lower booking rates.
- Regularly review your cancellation policy against competitors and market demand shifts in Bad Oberdorf.
Bad Oberdorf STR Booking Lead Time Analysis (2026)
Average Booking Lead Time by Month
Booking Lead Time Insights for Bad Oberdorf
- The overall average booking lead time for vacation rentals in Bad Oberdorf is 109 days.
- Guests book furthest in advance for stays during August (average 156 days), likely coinciding with peak travel demand or local events.
- The shortest booking windows occur for stays in February (average 68 days), indicating more last-minute travel plans during this time.
- Seasonally, Summer (141 days avg.) sees the longest lead times, while Spring (85 days avg.) has the shortest, reflecting typical travel planning cycles.
Recommendations for Hosts
- Use the overall average lead time (109 days) as a baseline for your pricing and availability strategy in Bad Oberdorf.
- For August stays, consider implementing length-of-stay discounts or slightly higher rates for bookings made less than 156 days out to capitalize on advance planning.
- Target marketing efforts for the Summer season well in advance (at least 141 days) to capture early planners.
- Monitor your own booking lead times against these Bad Oberdorf averages to identify opportunities for dynamic pricing adjustments.
Popular & Essential Airbnb Amenities in Bad Oberdorf (2026)
Amenity Prevalence
Amenity Insights for Bad Oberdorf
- Essential amenities in Bad Oberdorf that guests expect include: TV, Hair dryer, Wifi, Free parking on premises, Heating. Lacking these (any) could significantly impact bookings.
- Popular amenities like Kitchen, Smoke alarm, Washer are common but not universal. Offering these can provide a competitive edge.
Recommendations for Hosts
- Ensure your listing includes all essential amenities for Bad Oberdorf: TV, Hair dryer, Wifi, Free parking on premises, Heating.
- Prioritize adding missing essentials: Heating.
- Consider adding popular differentiators like Kitchen or Smoke alarm to increase appeal.
- Highlight unique or less common amenities you offer (e.g., hot tub, dedicated workspace, EV charger) in your listing description and photos.
- Regularly check competitor amenities in Bad Oberdorf to stay competitive.
Bad Oberdorf Airbnb Guest Demographics & Profile Analysis (2026)
Guest Profile Summary for Bad Oberdorf
- The typical guest profile for Airbnb in Bad Oberdorf consists of primarily domestic travelers (93%), often arriving from nearby Stuttgart, typically belonging to the Post-2000s (Gen Z/Alpha) group (50%), primarily speaking German or English.
- Domestic travelers account for 93.1% of guests.
- Key international markets include Germany (93.1%) and Netherlands (3%).
- Top languages spoken are German (39.8%) followed by English (38.9%).
- A significant demographic segment is the Post-2000s (Gen Z/Alpha) group, representing 50% of guests.
Recommendations for Hosts
- Target domestic marketing efforts towards travelers from Stuttgart and Berlin.
- Tailor amenities and listing descriptions to appeal to the dominant Post-2000s (Gen Z/Alpha) demographic (e.g., highlight fast WiFi, smart home features, local guides).
- Highlight unique local experiences or amenities relevant to the primary guest profile.
- Consider seasonal promotions aligned with peak travel times for key origin markets.
Nearby Short-Term Rental Market Comparison
How does the Bad Oberdorf Airbnb market stack up against its neighbors? Compare key performance metrics like average monthly revenue, ADR, and occupancy rates in surrounding areas to understand the broader regional STR landscape.
| Market | Active Properties | Monthly Revenue | Daily Rate | Avg. Occupancy |
|---|---|---|---|---|
| Sankt Pankraz - San Pancrazio | 12 | $6,528 | $633.65 | 29% |
| Balderschwang | 10 | $5,253 | $304.03 | 58% |
| Urtijëi - St. Ulrich in Gröden - Ortisei | 172 | $5,054 | $718.33 | 41% |
| Bürserberg | 45 | $3,783 | $331.48 | 40% |
| Kiens - Chienes | 17 | $3,715 | $377.77 | 48% |
| Brand | 63 | $3,714 | $522.47 | 31% |
| Varenna | 226 | $3,641 | $300.50 | 52% |
| Kramsach | 12 | $3,573 | $272.32 | 48% |
| Moos in Passeier - Moso in Passiria | 20 | $3,504 | $547.30 | 23% |
| Lajen - Laion | 96 | $3,338 | $548.27 | 36% |