Bad Birnbach Airbnb Market Analysis 2026: Short Term Rental Data & Vacation Rental Statistics in Bavaria, Germany
Is Airbnb profitable in Bad Birnbach in 2026? Explore comprehensive Airbnb analytics for Bad Birnbach, Bavaria, Germany to uncover income potential. This 2026 STR market report for Bad Birnbach, based on AirROI data from February 2025 to January 2026, reveals key trends in the niche market of 43 active listings.
Whether you're considering an Airbnb investment in Bad Birnbach, optimizing your existing vacation rental, or exploring rental arbitrage opportunities, understanding the Bad Birnbach Airbnb data is crucial. Leveraging the low regulation environment is key to maximizing your short term rental income potential. Let's dive into the specifics.
Key Bad Birnbach Airbnb Performance Metrics Overview
Monthly Airbnb Revenue Variations & Income Potential in Bad Birnbach (2026)
Understanding the monthly revenue variations for Airbnb listings in Bad Birnbach is key to maximizing your short term rental income potential. Seasonality significantly impacts earnings. Our analysis, based on data from the past 12 months, shows that the peak revenue month for STRs in Bad Birnbach is typically May, while January often presents the lowest earnings, highlighting opportunities for strategic pricing adjustments during shoulder and low seasons. Explore the typical Airbnb income in Bad Birnbach across different performance tiers:
- Best-in-class properties (Top 10%) achieve $1,562+ monthly, often utilizing dynamic pricing and superior guest experiences.
- Strong performing properties (Top 25%) earn $996 or more, indicating effective management and desirable locations/amenities.
- Typical properties (Median) generate around $518 per month, representing the average market performance.
- Entry-level properties (Bottom 25%) see earnings around $265, often with potential for optimization.
Average Monthly Airbnb Earnings Trend in Bad Birnbach
Bad Birnbach Airbnb Occupancy Rate Trends (2026)
Maximize your bookings by understanding the Bad Birnbach STR occupancy trends. Seasonal demand shifts significantly influence how often properties are booked. Typically, Maysees the highest demand (peak season occupancy), while January experiences the lowest (low season). Effective strategies, like adjusting minimum stays or offering promotions, can boost occupancy during slower periods. Here's how different property tiers perform in Bad Birnbach:
- Best-in-class properties (Top 10%) achieve 70%+ occupancy, indicating high desirability and potentially optimized availability.
- Strong performing properties (Top 25%) maintain 46% or higher occupancy, suggesting good market fit and guest satisfaction.
- Typical properties (Median) have an occupancy rate around 25%.
- Entry-level properties (Bottom 25%) average 13% occupancy, potentially facing higher vacancy.
Average Monthly Occupancy Rate Trend in Bad Birnbach
Average Daily Rate (ADR) Airbnb Trends in Bad Birnbach (2026)
Effective short term rental pricing strategy in Bad Birnbach involves understanding monthly ADR fluctuations. The Average Daily Rate (ADR) for Airbnb in Bad Birnbach typically peaks in February and dips lowest during November. Leveraging Airbnb dynamic pricing tools or strategies based on this seasonality can significantly boost revenue. Here's a look at the typical nightly rates achieved:
- Best-in-class properties (Top 10%) command rates of $102+ per night, often due to premium features or locations.
- Strong performing properties (Top 25%) achieve nightly rates of $89 or more.
- Typical properties (Median) charge around $70 per night.
- Entry-level properties (Bottom 25%) earn around $60 per night.
Average Daily Rate (ADR) Trend by Month in Bad Birnbach
Get Live Bad Birnbach Market Intelligence 👇

Explore Real-time Analytics
Airbnb Seasonality Analysis & Trends in Bad Birnbach (2026)
Peak Season (May, March, August)
- Revenue averages $1,001 per month
- Occupancy rates average 42.1%
- Daily rates average $77
Shoulder Season
- Revenue averages $720 per month
- Occupancy maintains around 32.2%
- Daily rates hold near $76
Low Season (January, November, December)
- Revenue drops to average $482 per month
- Occupancy decreases to average 22.9%
- Daily rates adjust to average $73
Seasonality Insights for Bad Birnbach
- The Airbnb seasonality in Bad Birnbach shows highly seasonal trends requiring careful strategy. While the sections above show seasonal averages, it's also insightful to look at the extremes:
- During the high season, the absolute peak month showcases Bad Birnbach's highest earning potential, with monthly revenues capable of climbing to $1,142, occupancy reaching a high of 46.8%, and ADRs peaking at $78.
- Conversely, the slowest single month of the year, typically falling within the low season, marks the market's lowest point. In this month, revenue might dip to $382, occupancy could drop to 18.3%, and ADRs may adjust down to $72.
- Understanding both the seasonal averages and these monthly peaks and troughs in revenue, occupancy, and ADR is crucial for maximizing your Airbnb profit potential in Bad Birnbach.
Seasonal Strategies for Maximizing Profit
- Peak Season: Maximize revenue through premium pricing and potentially longer minimum stays. Ensure high availability.
- Low Season: Offer competitive pricing, special promotions (e.g., extended stay discounts), and flexible cancellation policies. Target off-season travelers like remote workers or budget-conscious guests.
- Shoulder Seasons: Implement dynamic pricing that balances peak and low rates. Target weekend travelers or specific events. Offer slightly more flexible terms than peak season.
- Regularly analyze your own performance against these Bad Birnbach seasonality benchmarks and adjust your pricing and availability strategy accordingly.
Best Areas for Airbnb Investment in Bad Birnbach (2026)
Exploring the top neighborhoods for short-term rentals in Bad Birnbach? This section highlights key areas, outlining why they are attractive for hosts and guests, along with notable local attractions. Consider these locations based on your target guest profile and investment strategy.
| Neighborhood / Area | Why Host Here? (Target Guests & Appeal) | Key Attractions & Landmarks |
|---|---|---|
| Kurpark | The central park area in Bad Birnbach known for its beautiful landscapes and wellness facilities. It attracts visitors looking to relax and enjoy nature, making it ideal for Airbnb hosts targeting wellness tourists. | Kurpark Bad Birnbach, Therme Bad Birnbach, Golfclub Bad Birnbach, Rottal Terme, Wanderwege Bad Birnbach |
| Bad Birnbach Town Center | The heart of Bad Birnbach with charming local shops, cafes, and restaurants. Perfect for guests wanting to experience the local culture and lifestyle. | Local shops, Restaurants, Cafes, Postbräu, Kulturhaus Bad Birnbach |
| Therme Bad Birnbach | Known for its thermal baths and spa facilities, this area attracts many wellness tourists seeking relaxation and rejuvenation. | Therme Bad Birnbach, Spa facilities, Wellness programs, Hot springs, Health retreats |
| Golfplatz Bad Birnbach | A popular golf destination in the region, appealing to golfing enthusiasts and visitors looking for leisure activities. | Golfplatz Bad Birnbach, Golf coaching, Clubhouse, Nature walks, Golf tournaments |
| Bad Birnbach Surrounding Nature | The beautiful countryside and nature surrounding Bad Birnbach attract nature lovers and those looking for tranquility and outdoor activities. | Cycling trails, Hiking paths, Natural parks, Scenic views, Wildlife observation |
| Nearby Villages | Charming nearby villages offer a more rustic and authentic Bavarian experience, appealing to tourists seeking a taste of local life away from larger towns. | Local festivals, Traditional markets, Historic landmarks, Nature trails, Bavarian cuisine |
| Wellness Hotels and Resorts | Several wellness hotels and resorts cater to guests wanting comprehensive wellness experiences, making this a prime location for Airbnb accommodations focused on health and wellness. | Wellness packages, Fitness centers, Yoga classes, Healthy dining options, Relaxation areas |
| Cultural Events in Bad Birnbach | Bad Birnbach hosts various cultural events throughout the year which attract visitors and create a demand for short-term rentals. | Local festivals, Concerts, Theater performances, Art exhibitions, Cultural fairs |
Understanding Airbnb License Requirements & STR Laws in Bad Birnbach (2026)
While Bad Birnbach, Bavaria, Germany currently shows low STR regulations, specific Airbnb license requirements might still exist or change. Always verify the latest short term rental regulations and Airbnb license requirements directly with local government authorities for Bad Birnbach to ensure full compliance before hosting.
(Source: AirROI data, 2026, finding no licensed listings among those analyzed)
Top Performing Airbnb Properties in Bad Birnbach (2026)
Benchmark your potential! Explore examples of top-performing Airbnb properties in Bad Birnbachbased on Trailing Twelve Month (TTM) revenue. Analyze their characteristics, revenue, occupancy rate, and ADR to understand what drives success in this market.

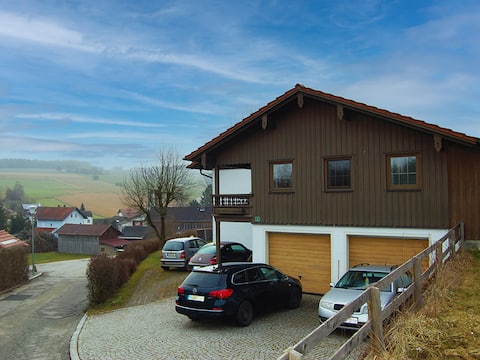
Bavaria "Sun" (Bavaria vacation rentals)
Entire Place • 1 bedroom

Liparis apartment with loggia (Bad Birnbach)
Private Room • 1 bedroom
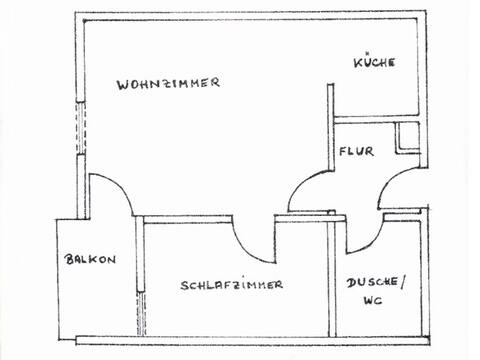
Apartment 1, 45 square meters (Tomandl apartment)
Entire Place • 1 bedroom
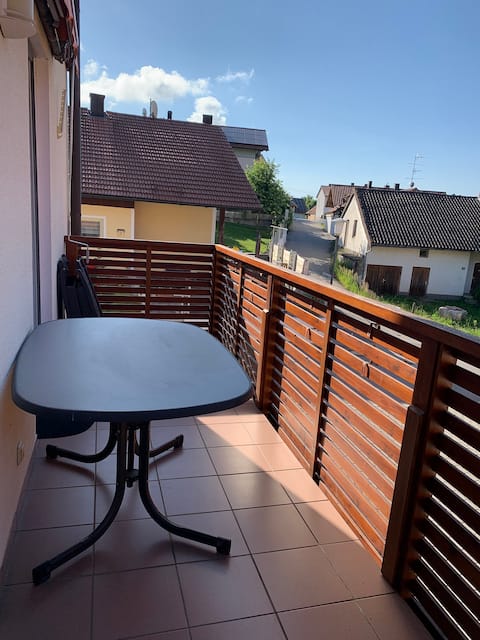
Majo apartment with balcony, 40 sqm (Bad Birnbach)
Entire Place • 1 bedroom
Vacation rental at the Wirtsgarten (Bad Birnbach)
Entire Place • 1 bedroom
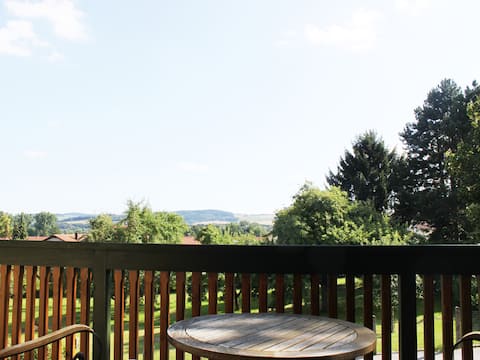
Bavaria "Rottalblick" (Bavaria vacation rentals)
Entire Place • 1 bedroom
Note: Performance varies based on location, size, amenities, seasonality, and management quality. Data reflects the past 12 months.
Top Performing Airbnb Hosts in Bad Birnbach (2026)
Learn from the best! This table showcases top-performing Airbnb hosts in Bad Birnbach based on the number of properties managed and estimated total revenue over the past year. Analyze their scale and performance metrics.
| Host Name | Properties | Grossing Revenue | Stay Reviews | Avg Rating |
|---|---|---|---|---|
| Veronika | 36 | $160,993 | 201 | 4.89/5.0 |
| Daniella | 2 | $11,244 | 132 | 4.62/5.0 |
| Felipe | 2 | $5,387 | 57 | 4.74/5.0 |
| Alex Und Stephi | 1 | $4,879 | 39 | 4.92/5.0 |
| Peter | 2 | $4,820 | 10 | 5.00/5.0 |
Analyzing the strategies of top hosts, such as their property selection, pricing, and guest communication, can offer valuable lessons for optimizing your own Airbnb operations in Bad Birnbach.
Dive Deeper: Advanced Bad Birnbach STR Market Data (2026)
Ready to unlock more insights? AirROI provides access to advanced metrics and comprehensive Airbnb data for Bad Birnbach. Explore detailed analytics beyond this report to refine your investment strategy, optimize pricing, and maximize your vacation rental profits.
Explore Advanced MetricsBad Birnbach Short-Term Rental Market Composition (2026): Property & Room Types
Room Type Distribution
Property Type Distribution
Market Composition Insights for Bad Birnbach
- The Bad Birnbach Airbnb market composition is heavily skewed towards Entire Home/Apt listings, which make up 81.4% of the 43 active rentals. This indicates strong guest preference for privacy and space.
- Looking at the property type distribution in Bad Birnbach, Apartment/Condo properties are the most common (72.1%), reflecting the local real estate landscape.
- The presence of 14% Hotel/Boutique listings indicates integration with traditional hospitality.
- Smaller segments like outdoor/unique (combined 4.7%) offer potential for unique stay experiences.
Bad Birnbach Airbnb Room Capacity Analysis (2026): Bedroom Distribution
Distribution of Listings by Number of Bedrooms
Room Capacity Insights for Bad Birnbach
- The dominant room capacity in Bad Birnbach is 1 bedroom listings, making up 79.1% of the market. This suggests a strong demand for properties suitable for couples or solo travelers.
- Together, 1 bedroom and 2 bedrooms properties represent 93.1% of the active Airbnb listings in Bad Birnbach, indicating a high concentration in these sizes.
- With over half the market (79.1%) consisting of studios or 1-bedroom units, Bad Birnbach is particularly well-suited for individuals or couples.
- Listings with 3+ bedrooms (2.3%) represent a smaller niche, potentially indicating an underserved market for larger group accommodations in Bad Birnbach.
Bad Birnbach Vacation Rental Guest Capacity Trends (2026)
Distribution of Listings by Guest Capacity
Guest Capacity Insights for Bad Birnbach
- The most common guest capacity trend in Bad Birnbach vacation rentals is listings accommodating 2 guests (51.2%). This suggests the primary traveler segment is likely couples or solo travelers.
- Properties designed for 2 guests and 3 guests dominate the Bad Birnbach STR market, accounting for 72.1% of listings.
- A significant 55.9% of listings cater specifically to 1-2 guests, highlighting strong demand from couples and solo travelers in Bad Birnbach.
- Listings for large groups (6+ guests) are relatively rare (2.3%), potentially indicating an opportunity for hosts targeting this segment in Bad Birnbach.
- On average, properties in Bad Birnbach are equipped to host 2.5 guests.
Bad Birnbach Airbnb Booking Patterns (2026): Available vs. Booked Days
Available Days Distribution
Booked Days Distribution
Booking Pattern Insights for Bad Birnbach
- The most common availability pattern in Bad Birnbach falls within the 271-366 days range, representing 76.7% of listings. This suggests many properties have significant open periods on their calendars.
- Approximately 93.0% of listings show high availability (181+ days open annually), indicating potential for increased bookings or specific owner usage patterns.
- For booked days, the 1-30 days range is most frequent in Bad Birnbach (48.8%), reflecting common guest stay durations or potential owner blocking patterns.
- A notable 7.0% of properties secure long booking periods (181+ days booked per year), highlighting successful long-term rental strategies or significant owner usage.
Bad Birnbach Airbnb Minimum Stay Requirements Analysis
Distribution of Listings by Minimum Night Requirement
1 Night
7 listings
16.3% of total
2 Nights
3 listings
7% of total
3 Nights
3 listings
7% of total
4-6 Nights
12 listings
27.9% of total
30+ Nights
18 listings
41.9% of total
Key Insights
- The most prevalent minimum stay requirement in Bad Birnbach is 30+ Nights, adopted by 41.9% of listings. This highlights the market's preference for longer commitments.
- A significant segment (41.9%) caters to monthly stays (30+ nights) in Bad Birnbach, pointing to opportunities in the extended-stay market.
Recommendations
- Align with the market by considering a 30+ Nights minimum stay, as 41.9% of Bad Birnbach hosts use this setting.
- If feasible, allowing 1-night stays, especially midweek or during low season, could capture last-minute bookings, as only 16.3% currently do.
- Explore offering discounts for stays of 30+ nights to attract the 41.9% of the market seeking extended stays.
- Adjust minimum nights based on seasonality – potentially shorter during low season and longer during peak demand periods in Bad Birnbach.
Bad Birnbach Airbnb Cancellation Policy Trends Analysis (2026)
Super Strict 60 Days
2 listings
4.7% of total
Limited
25 listings
58.1% of total
Flexible
2 listings
4.7% of total
Moderate
1 listings
2.3% of total
Firm
11 listings
25.6% of total
Strict
2 listings
4.7% of total
Cancellation Policy Insights for Bad Birnbach
- The prevailing Airbnb cancellation policy trend in Bad Birnbach is Limited, used by 58.1% of listings.
- There's a relatively balanced mix between guest-friendly (7.0%) and stricter (30.3%) policies, offering choices for different guest needs.
- Strict cancellation policies are quite rare (4.7%), potentially making listings with this policy less competitive unless justified by high demand or property type.
Recommendations for Hosts
- Consider adopting a Limited policy to align with the 58.1% market standard in Bad Birnbach.
- Using a Strict policy might deter some guests, as only 4.7% of listings use it. Evaluate if potential revenue protection outweighs possible lower booking rates.
- Regularly review your cancellation policy against competitors and market demand shifts in Bad Birnbach.
Bad Birnbach STR Booking Lead Time Analysis (2026)
Average Booking Lead Time by Month
Booking Lead Time Insights for Bad Birnbach
- The overall average booking lead time for vacation rentals in Bad Birnbach is 97 days.
- Guests book furthest in advance for stays during July (average 105 days), likely coinciding with peak travel demand or local events.
- The shortest booking windows occur for stays in February (average 37 days), indicating more last-minute travel plans during this time.
- Seasonally, Fall (98 days avg.) sees the longest lead times, while Winter (58 days avg.) has the shortest, reflecting typical travel planning cycles.
Recommendations for Hosts
- Use the overall average lead time (97 days) as a baseline for your pricing and availability strategy in Bad Birnbach.
- Target marketing efforts for the Fall season well in advance (at least 98 days) to capture early planners.
- Monitor your own booking lead times against these Bad Birnbach averages to identify opportunities for dynamic pricing adjustments.
Popular & Essential Airbnb Amenities in Bad Birnbach (2026)
Amenity Prevalence
Amenity Insights for Bad Birnbach
- Essential amenities in Bad Birnbach that guests expect include: Bed linens. Lacking these (this) could significantly impact bookings.
- Popular amenities like Free parking on premises, TV, Smoke alarm are common but not universal. Offering these can provide a competitive edge.
- Warning: Wifi is not universally provided but is considered essential globally. Ensure reliable Wifi is offered.
Recommendations for Hosts
- Ensure your listing includes all essential amenities for Bad Birnbach: Bed linens.
- Prioritize adding missing essentials: Bed linens.
- Consider adding popular differentiators like Free parking on premises or TV to increase appeal.
- Highlight unique or less common amenities you offer (e.g., hot tub, dedicated workspace, EV charger) in your listing description and photos.
- Regularly check competitor amenities in Bad Birnbach to stay competitive.
Bad Birnbach Airbnb Guest Demographics & Profile Analysis (2026)
Guest Profile Summary for Bad Birnbach
- The typical guest profile for Airbnb in Bad Birnbach consists of a mix of domestic (53%) and international guests, often arriving from nearby Berlin, typically belonging to the Post-2000s (Gen Z/Alpha) group (50%), primarily speaking English or German.
- Domestic travelers account for 52.7% of guests.
- Key international markets include Germany (52.7%) and Netherlands (10.8%).
- Top languages spoken are English (37.2%) followed by German (33.3%).
- A significant demographic segment is the Post-2000s (Gen Z/Alpha) group, representing 50% of guests.
Recommendations for Hosts
- Balance marketing efforts between domestic and international channels based on the guest mix.
- Tailor amenities and listing descriptions to appeal to the dominant Post-2000s (Gen Z/Alpha) demographic (e.g., highlight fast WiFi, smart home features, local guides).
- Highlight unique local experiences or amenities relevant to the primary guest profile.
- Consider seasonal promotions aligned with peak travel times for key origin markets.
Nearby Short-Term Rental Market Comparison
How does the Bad Birnbach Airbnb market stack up against its neighbors? Compare key performance metrics like average monthly revenue, ADR, and occupancy rates in surrounding areas to understand the broader regional STR landscape.
| Market | Active Properties | Monthly Revenue | Daily Rate | Avg. Occupancy |
|---|---|---|---|---|
| Scheffau am Wilden Kaiser | 12 | $6,669 | $906.83 | 30% |
| Hallstatt | 31 | $4,918 | $293.92 | 62% |
| Going am Wilden Kaiser | 27 | $3,596 | $406.50 | 37% |
| Bayrischzell | 41 | $3,550 | $389.91 | 33% |
| Krimml | 53 | $3,544 | $359.14 | 41% |
| Hof bei Salzburg | 21 | $3,403 | $301.21 | 49% |
| Reith bei Kitzbühel | 49 | $3,385 | $356.25 | 34% |
| Unterach am Attersee | 16 | $3,220 | $285.15 | 43% |
| Molln | 14 | $3,187 | $185.03 | 52% |
| Faistenau | 11 | $3,055 | $276.07 | 40% |