Anger Airbnb Market Analysis 2026: Short Term Rental Data & Vacation Rental Statistics in Bavaria, Germany
Is Airbnb profitable in Anger in 2026? Explore comprehensive Airbnb analytics for Anger, Bavaria, Germany to uncover income potential. This 2026 STR market report for Anger, based on AirROI data from February 2025 to January 2026, reveals key trends in the niche market of 40 active listings.
Whether you're considering an Airbnb investment in Anger, optimizing your existing vacation rental, or exploring rental arbitrage opportunities, understanding the Anger Airbnb data is crucial. Leveraging the low regulation environment is key to maximizing your short term rental income potential. Let's dive into the specifics.
Key Anger Airbnb Performance Metrics Overview
Monthly Airbnb Revenue Variations & Income Potential in Anger (2026)
Understanding the monthly revenue variations for Airbnb listings in Anger is key to maximizing your short term rental income potential. Seasonality significantly impacts earnings. Our analysis, based on data from the past 12 months, shows that the peak revenue month for STRs in Anger is typically August, while January often presents the lowest earnings, highlighting opportunities for strategic pricing adjustments during shoulder and low seasons. Explore the typical Airbnb income in Anger across different performance tiers:
- Best-in-class properties (Top 10%) achieve $3,620+ monthly, often utilizing dynamic pricing and superior guest experiences.
- Strong performing properties (Top 25%) earn $2,109 or more, indicating effective management and desirable locations/amenities.
- Typical properties (Median) generate around $1,181 per month, representing the average market performance.
- Entry-level properties (Bottom 25%) see earnings around $726, often with potential for optimization.
Average Monthly Airbnb Earnings Trend in Anger
Anger Airbnb Occupancy Rate Trends (2026)
Maximize your bookings by understanding the Anger STR occupancy trends. Seasonal demand shifts significantly influence how often properties are booked. Typically, Augustsees the highest demand (peak season occupancy), while January experiences the lowest (low season). Effective strategies, like adjusting minimum stays or offering promotions, can boost occupancy during slower periods. Here's how different property tiers perform in Anger:
- Best-in-class properties (Top 10%) achieve 75%+ occupancy, indicating high desirability and potentially optimized availability.
- Strong performing properties (Top 25%) maintain 57% or higher occupancy, suggesting good market fit and guest satisfaction.
- Typical properties (Median) have an occupancy rate around 37%.
- Entry-level properties (Bottom 25%) average 22% occupancy, potentially facing higher vacancy.
Average Monthly Occupancy Rate Trend in Anger
Average Daily Rate (ADR) Airbnb Trends in Anger (2026)
Effective short term rental pricing strategy in Anger involves understanding monthly ADR fluctuations. The Average Daily Rate (ADR) for Airbnb in Anger typically peaks in January and dips lowest during March. Leveraging Airbnb dynamic pricing tools or strategies based on this seasonality can significantly boost revenue. Here's a look at the typical nightly rates achieved:
- Best-in-class properties (Top 10%) command rates of $242+ per night, often due to premium features or locations.
- Strong performing properties (Top 25%) achieve nightly rates of $136 or more.
- Typical properties (Median) charge around $104 per night.
- Entry-level properties (Bottom 25%) earn around $79 per night.
Average Daily Rate (ADR) Trend by Month in Anger
Get Live Anger Market Intelligence 👇

Explore Real-time Analytics
Airbnb Seasonality Analysis & Trends in Anger (2026)
Peak Season (August, July, September)
- Revenue averages $2,981 per month
- Occupancy rates average 67.1%
- Daily rates average $124
Shoulder Season
- Revenue averages $1,384 per month
- Occupancy maintains around 36.5%
- Daily rates hold near $125
Low Season (January, February, March)
- Revenue drops to average $768 per month
- Occupancy decreases to average 22.4%
- Daily rates adjust to average $120
Seasonality Insights for Anger
- The Airbnb seasonality in Anger shows highly seasonal trends requiring careful strategy. While the sections above show seasonal averages, it's also insightful to look at the extremes:
- During the high season, the absolute peak month showcases Anger's highest earning potential, with monthly revenues capable of climbing to $3,731, occupancy reaching a high of 74.4%, and ADRs peaking at $136.
- Conversely, the slowest single month of the year, typically falling within the low season, marks the market's lowest point. In this month, revenue might dip to $652, occupancy could drop to 15.7%, and ADRs may adjust down to $111.
- Understanding both the seasonal averages and these monthly peaks and troughs in revenue, occupancy, and ADR is crucial for maximizing your Airbnb profit potential in Anger.
Seasonal Strategies for Maximizing Profit
- Peak Season: Maximize revenue through premium pricing and potentially longer minimum stays. Ensure high availability.
- Low Season: Offer competitive pricing, special promotions (e.g., extended stay discounts), and flexible cancellation policies. Target off-season travelers like remote workers or budget-conscious guests.
- Shoulder Seasons: Implement dynamic pricing that balances peak and low rates. Target weekend travelers or specific events. Offer slightly more flexible terms than peak season.
- Regularly analyze your own performance against these Anger seasonality benchmarks and adjust your pricing and availability strategy accordingly.
Best Areas for Airbnb Investment in Anger (2026)
Exploring the top neighborhoods for short-term rentals in Anger? This section highlights key areas, outlining why they are attractive for hosts and guests, along with notable local attractions. Consider these locations based on your target guest profile and investment strategy.
| Neighborhood / Area | Why Host Here? (Target Guests & Appeal) | Key Attractions & Landmarks |
|---|---|---|
| Old Town (Altstadt) | The historic center of Augsburg, filled with medieval architecture, quaint streets, and vibrant culture. Ideal for tourists seeking history and charm. | Augsburg Cathedral, Fuggerei, Town Hall, Perlach Tower, Mozart House |
| Königsplatz | A picturesque square surrounded by neoclassical buildings, art museums, and cafes. Popular with visitors looking to explore art and architecture. | Augsburg Art Gallery, Schaezlerpalais, Augsburg Theater |
| Botmingen | A beautiful residential area with parks, great for families and tourists who enjoy nature. Close to the Botanical Garden and various lakes. | Botanical Garden, Lake Botmingen, natural trails, outdoor recreational areas |
| Lechviertel | A charming neighborhood along the Lech River, known for its beautiful views and quiet ambiance. Attracts nature lovers and those looking for tranquility. | Lech River Park, walks along the river, historic buildings |
| Hochfeld | An up-and-coming neighborhood with a multicultural vibe, appealing to younger crowds and travelers wanting a local experience. | local markets, cafes, community events |
| Oberhausen | A vibrant area with shopping districts and parks, great for visitors interested in modern amenities and lifestyle. | Shopping malls, Leisure facilities, Restaurants |
| Inningen | A quieter suburb with a rustic feel, perfect for families and visitors looking for a peaceful retreat. | local farms, parks, nearby nature |
| Göggingen | A suburb known for its thermal baths and wellness centers, attracting health-conscious travelers and wellness seekers. | Thermal spa, wellness centers, natural surroundings |
Understanding Airbnb License Requirements & STR Laws in Anger (2026)
While Anger, Bavaria, Germany currently shows low STR regulations, specific Airbnb license requirements might still exist or change. Always verify the latest short term rental regulations and Airbnb license requirements directly with local government authorities for Anger to ensure full compliance before hosting.
(Source: AirROI data, 2026, finding no licensed listings among those analyzed)
Top Performing Airbnb Properties in Anger (2026)
Benchmark your potential! Explore examples of top-performing Airbnb properties in Angerbased on Trailing Twelve Month (TTM) revenue. Analyze their characteristics, revenue, occupancy rate, and ADR to understand what drives success in this market.

Vacation on a newly renovated farm
Entire Place • 3 bedrooms
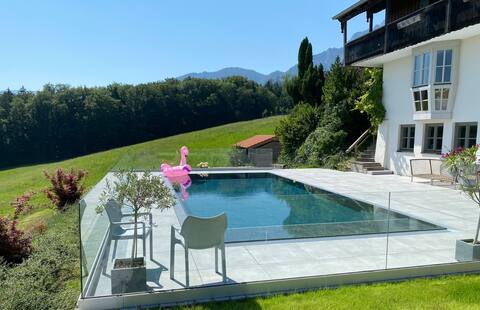
Apartment 1 with sauna and saltwater pool
Entire Place • 2 bedrooms
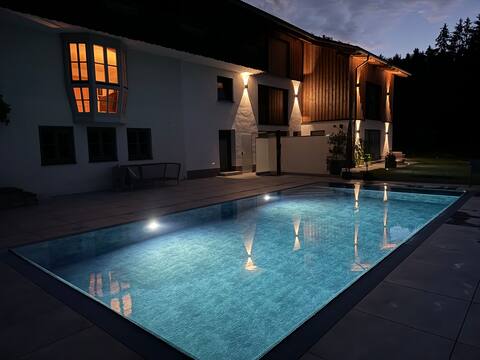
Apartment II (upper floor) with sauna + saltwater pool
Entire Place • 2 bedrooms
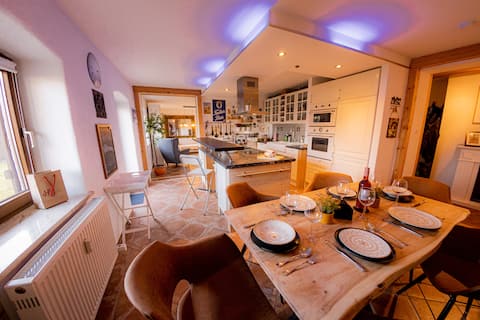
Fireplace | Home Theater | Sauna & Garten
Entire Place • 3 bedrooms

Bergzeit vacation apartment - with balcony & garage
Entire Place • 1 bedroom
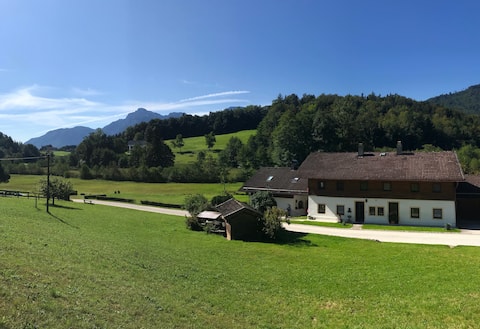
Charming house near lake, Salzburg & Berchtesgaden
Entire Place • 3 bedrooms
Note: Performance varies based on location, size, amenities, seasonality, and management quality. Data reflects the past 12 months.
Top Performing Airbnb Hosts in Anger (2026)
Learn from the best! This table showcases top-performing Airbnb hosts in Anger based on the number of properties managed and estimated total revenue over the past year. Analyze their scale and performance metrics.
| Host Name | Properties | Grossing Revenue | Stay Reviews | Avg Rating |
|---|---|---|---|---|
| Das Team Von Bayern Buchen | 12 | $171,252 | 67 | 4.91/5.0 |
| Josef | 2 | $65,373 | 81 | 4.95/5.0 |
| Franziska | 12 | $36,066 | 121 | 4.94/5.0 |
| Florian | 1 | $28,572 | 81 | 4.63/5.0 |
| Martin | 3 | $21,353 | 8 | 5.00/5.0 |
| Georg | 1 | $20,747 | 31 | 4.94/5.0 |
| Stephanie | 1 | $20,696 | 77 | 4.97/5.0 |
| Tanja | 2 | $19,147 | 23 | 4.67/5.0 |
| Katja | 1 | $15,153 | 15 | 4.67/5.0 |
| Veronika | 1 | $14,506 | 61 | 4.74/5.0 |
Analyzing the strategies of top hosts, such as their property selection, pricing, and guest communication, can offer valuable lessons for optimizing your own Airbnb operations in Anger.
Dive Deeper: Advanced Anger STR Market Data (2026)
Ready to unlock more insights? AirROI provides access to advanced metrics and comprehensive Airbnb data for Anger. Explore detailed analytics beyond this report to refine your investment strategy, optimize pricing, and maximize your vacation rental profits.
Explore Advanced MetricsAnger Short-Term Rental Market Composition (2026): Property & Room Types
Room Type Distribution
Property Type Distribution
Market Composition Insights for Anger
- The Anger Airbnb market composition is heavily skewed towards Entire Home/Apt listings, which make up 97.5% of the 40 active rentals. This indicates strong guest preference for privacy and space.
- Looking at the property type distribution in Anger, Apartment/Condo properties are the most common (87.5%), reflecting the local real estate landscape.
- Smaller segments like outdoor/unique (combined 2.5%) offer potential for unique stay experiences.
Anger Airbnb Room Capacity Analysis (2026): Bedroom Distribution
Distribution of Listings by Number of Bedrooms
Room Capacity Insights for Anger
- The dominant room capacity in Anger is 1 bedroom listings, making up 37.5% of the market. This suggests a strong demand for properties suitable for couples or solo travelers.
- Together, 1 bedroom and 2 bedrooms properties represent 75.0% of the active Airbnb listings in Anger, indicating a high concentration in these sizes.
- A significant 22.5% of listings offer 3+ bedrooms, catering to larger groups and families seeking more space in Anger.
Anger Vacation Rental Guest Capacity Trends (2026)
Distribution of Listings by Guest Capacity
Guest Capacity Insights for Anger
- The most common guest capacity trend in Anger vacation rentals is listings accommodating 4 guests (45%). This suggests the primary traveler segment is likely small families or groups.
- Properties designed for 4 guests and 2 guests dominate the Anger STR market, accounting for 70.0% of listings.
- 12.5% of properties accommodate 6+ guests, serving the market segment for larger families or group travel in Anger.
- On average, properties in Anger are equipped to host 3.6 guests.
Anger Airbnb Booking Patterns (2026): Available vs. Booked Days
Available Days Distribution
Booked Days Distribution
Booking Pattern Insights for Anger
- The most common availability pattern in Anger falls within the 271-366 days range, representing 55% of listings. This suggests many properties have significant open periods on their calendars.
- Approximately 90.0% of listings show high availability (181+ days open annually), indicating potential for increased bookings or specific owner usage patterns.
- For booked days, the 91-180 days range is most frequent in Anger (37.5%), reflecting common guest stay durations or potential owner blocking patterns.
- A notable 10.0% of properties secure long booking periods (181+ days booked per year), highlighting successful long-term rental strategies or significant owner usage.
Anger Airbnb Minimum Stay Requirements Analysis
Distribution of Listings by Minimum Night Requirement
1 Night
2 listings
5% of total
2 Nights
1 listings
2.5% of total
3 Nights
17 listings
42.5% of total
4-6 Nights
7 listings
17.5% of total
30+ Nights
13 listings
32.5% of total
Key Insights
- The most prevalent minimum stay requirement in Anger is 3 Nights, adopted by 42.5% of listings. This highlights the market's preference for longer commitments.
- Very short stays (1-2 nights) are less common (7.5%), suggesting hosts prefer slightly longer bookings to optimize turnover.
- A significant segment (32.5%) caters to monthly stays (30+ nights) in Anger, pointing to opportunities in the extended-stay market.
Recommendations
- Align with the market by considering a 3 Nights minimum stay, as 42.5% of Anger hosts use this setting.
- If feasible, allowing 1-night stays, especially midweek or during low season, could capture last-minute bookings, as only 5% currently do.
- Explore offering discounts for stays of 30+ nights to attract the 32.5% of the market seeking extended stays.
- Adjust minimum nights based on seasonality – potentially shorter during low season and longer during peak demand periods in Anger.
Anger Airbnb Cancellation Policy Trends Analysis (2026)
Super Strict 30 Days
15 listings
37.5% of total
Super Strict 60 Days
1 listings
2.5% of total
Limited
1 listings
2.5% of total
Flexible
2 listings
5% of total
Moderate
5 listings
12.5% of total
Firm
15 listings
37.5% of total
Strict
1 listings
2.5% of total
Cancellation Policy Insights for Anger
- The prevailing Airbnb cancellation policy trend in Anger is Super Strict 30 Days, used by 37.5% of listings.
- There's a relatively balanced mix between guest-friendly (17.5%) and stricter (40.0%) policies, offering choices for different guest needs.
- Strict cancellation policies are quite rare (2.5%), potentially making listings with this policy less competitive unless justified by high demand or property type.
Recommendations for Hosts
- Consider adopting a Super Strict 30 Days policy to align with the 37.5% market standard in Anger.
- Using a Strict policy might deter some guests, as only 2.5% of listings use it. Evaluate if potential revenue protection outweighs possible lower booking rates.
- Regularly review your cancellation policy against competitors and market demand shifts in Anger.
Anger STR Booking Lead Time Analysis (2026)
Average Booking Lead Time by Month
Booking Lead Time Insights for Anger
- The overall average booking lead time for vacation rentals in Anger is 71 days.
- Guests book furthest in advance for stays during August (average 138 days), likely coinciding with peak travel demand or local events.
- The shortest booking windows occur for stays in February (average 27 days), indicating more last-minute travel plans during this time.
- Seasonally, Summer (108 days avg.) sees the longest lead times, while Spring (53 days avg.) has the shortest, reflecting typical travel planning cycles.
Recommendations for Hosts
- Use the overall average lead time (71 days) as a baseline for your pricing and availability strategy in Anger.
- For August stays, consider implementing length-of-stay discounts or slightly higher rates for bookings made less than 138 days out to capitalize on advance planning.
- Target marketing efforts for the Summer season well in advance (at least 108 days) to capture early planners.
- Monitor your own booking lead times against these Anger averages to identify opportunities for dynamic pricing adjustments.
Popular & Essential Airbnb Amenities in Anger (2026)
Amenity Prevalence
Amenity Insights for Anger
- Popular amenities like Free parking on premises, Refrigerator, Bed linens are common but not universal. Offering these can provide a competitive edge.
- Warning: Wifi is not universally provided but is considered essential globally. Ensure reliable Wifi is offered.
Recommendations for Hosts
- Consider adding popular differentiators like Free parking on premises or Refrigerator to increase appeal.
- Highlight unique or less common amenities you offer (e.g., hot tub, dedicated workspace, EV charger) in your listing description and photos.
- Regularly check competitor amenities in Anger to stay competitive.
Anger Airbnb Guest Demographics & Profile Analysis (2026)
Guest Profile Summary for Anger
- The typical guest profile for Airbnb in Anger consists of a mix of domestic (52%) and international guests, often arriving from nearby Cologne, typically belonging to the Post-2000s (Gen Z/Alpha) group (50%), primarily speaking English or German.
- Domestic travelers account for 51.5% of guests.
- Key international markets include Germany (51.5%) and United States (11.8%).
- Top languages spoken are English (40%) followed by German (26.7%).
- A significant demographic segment is the Post-2000s (Gen Z/Alpha) group, representing 50% of guests.
Recommendations for Hosts
- Balance marketing efforts between domestic and international channels based on the guest mix.
- Tailor amenities and listing descriptions to appeal to the dominant Post-2000s (Gen Z/Alpha) demographic (e.g., highlight fast WiFi, smart home features, local guides).
- Highlight unique local experiences or amenities relevant to the primary guest profile.
- Consider seasonal promotions aligned with peak travel times for key origin markets.
Nearby Short-Term Rental Market Comparison
How does the Anger Airbnb market stack up against its neighbors? Compare key performance metrics like average monthly revenue, ADR, and occupancy rates in surrounding areas to understand the broader regional STR landscape.
| Market | Active Properties | Monthly Revenue | Daily Rate | Avg. Occupancy |
|---|---|---|---|---|
| Scheffau am Wilden Kaiser | 12 | $6,669 | $906.83 | 30% |
| Sankt Pankraz - San Pancrazio | 12 | $6,528 | $633.65 | 29% |
| Urtijëi - St. Ulrich in Gröden - Ortisei | 172 | $5,054 | $718.33 | 41% |
| Hallstatt | 31 | $4,918 | $293.92 | 62% |
| Kiens - Chienes | 17 | $3,715 | $377.77 | 48% |
| Cortina d'Ampezzo | 309 | $3,646 | $474.12 | 40% |
| Going am Wilden Kaiser | 27 | $3,596 | $406.50 | 37% |
| Kramsach | 12 | $3,573 | $272.32 | 48% |
| Bayrischzell | 41 | $3,550 | $389.91 | 33% |
| Krimml | 53 | $3,544 | $359.14 | 41% |