Meersburg Airbnb Market Analysis 2026: Short Term Rental Data & Vacation Rental Statistics in Baden-Württemberg, Germany
Is Airbnb profitable in Meersburg in 2026? Explore comprehensive Airbnb analytics for Meersburg, Baden-Württemberg, Germany to uncover income potential. This 2026 STR market report for Meersburg, based on AirROI data from February 2025 to January 2026, reveals key trends in the niche market of 76 active listings.
Whether you're considering an Airbnb investment in Meersburg, optimizing your existing vacation rental, or exploring rental arbitrage opportunities, understanding the Meersburg Airbnb data is crucial. Leveraging the low regulation environment is key to maximizing your short term rental income potential. Let's dive into the specifics.
Key Meersburg Airbnb Performance Metrics Overview
Monthly Airbnb Revenue Variations & Income Potential in Meersburg (2026)
Understanding the monthly revenue variations for Airbnb listings in Meersburg is key to maximizing your short term rental income potential. Seasonality significantly impacts earnings. Our analysis, based on data from the past 12 months, shows that the peak revenue month for STRs in Meersburg is typically August, while January often presents the lowest earnings, highlighting opportunities for strategic pricing adjustments during shoulder and low seasons. Explore the typical Airbnb income in Meersburg across different performance tiers:
- Best-in-class properties (Top 10%) achieve $3,521+ monthly, often utilizing dynamic pricing and superior guest experiences.
- Strong performing properties (Top 25%) earn $2,430 or more, indicating effective management and desirable locations/amenities.
- Typical properties (Median) generate around $1,704 per month, representing the average market performance.
- Entry-level properties (Bottom 25%) see earnings around $1,120, often with potential for optimization.
Average Monthly Airbnb Earnings Trend in Meersburg
Meersburg Airbnb Occupancy Rate Trends (2026)
Maximize your bookings by understanding the Meersburg STR occupancy trends. Seasonal demand shifts significantly influence how often properties are booked. Typically, Augustsees the highest demand (peak season occupancy), while January experiences the lowest (low season). Effective strategies, like adjusting minimum stays or offering promotions, can boost occupancy during slower periods. Here's how different property tiers perform in Meersburg:
- Best-in-class properties (Top 10%) achieve 77%+ occupancy, indicating high desirability and potentially optimized availability.
- Strong performing properties (Top 25%) maintain 64% or higher occupancy, suggesting good market fit and guest satisfaction.
- Typical properties (Median) have an occupancy rate around 47%.
- Entry-level properties (Bottom 25%) average 27% occupancy, potentially facing higher vacancy.
Average Monthly Occupancy Rate Trend in Meersburg
Average Daily Rate (ADR) Airbnb Trends in Meersburg (2026)
Effective short term rental pricing strategy in Meersburg involves understanding monthly ADR fluctuations. The Average Daily Rate (ADR) for Airbnb in Meersburg typically peaks in September and dips lowest during March. Leveraging Airbnb dynamic pricing tools or strategies based on this seasonality can significantly boost revenue. Here's a look at the typical nightly rates achieved:
- Best-in-class properties (Top 10%) command rates of $222+ per night, often due to premium features or locations.
- Strong performing properties (Top 25%) achieve nightly rates of $162 or more.
- Typical properties (Median) charge around $122 per night.
- Entry-level properties (Bottom 25%) earn around $102 per night.
Average Daily Rate (ADR) Trend by Month in Meersburg
Get Live Meersburg Market Intelligence 👇

Explore Real-time Analytics
Airbnb Seasonality Analysis & Trends in Meersburg (2026)
Peak Season (August, July, September)
- Revenue averages $3,167 per month
- Occupancy rates average 70.0%
- Daily rates average $173
Shoulder Season
- Revenue averages $1,731 per month
- Occupancy maintains around 43.9%
- Daily rates hold near $161
Low Season (January, February, November)
- Revenue drops to average $986 per month
- Occupancy decreases to average 27.1%
- Daily rates adjust to average $159
Seasonality Insights for Meersburg
- The Airbnb seasonality in Meersburg shows highly seasonal trends requiring careful strategy. While the sections above show seasonal averages, it's also insightful to look at the extremes:
- During the high season, the absolute peak month showcases Meersburg's highest earning potential, with monthly revenues capable of climbing to $3,458, occupancy reaching a high of 74.4%, and ADRs peaking at $180.
- Conversely, the slowest single month of the year, typically falling within the low season, marks the market's lowest point. In this month, revenue might dip to $766, occupancy could drop to 19.2%, and ADRs may adjust down to $150.
- Understanding both the seasonal averages and these monthly peaks and troughs in revenue, occupancy, and ADR is crucial for maximizing your Airbnb profit potential in Meersburg.
Seasonal Strategies for Maximizing Profit
- Peak Season: Maximize revenue through premium pricing and potentially longer minimum stays. Ensure high availability.
- Low Season: Offer competitive pricing, special promotions (e.g., extended stay discounts), and flexible cancellation policies. Target off-season travelers like remote workers or budget-conscious guests.
- Shoulder Seasons: Implement dynamic pricing that balances peak and low rates. Target weekend travelers or specific events. Offer slightly more flexible terms than peak season.
- Regularly analyze your own performance against these Meersburg seasonality benchmarks and adjust your pricing and availability strategy accordingly.
Best Areas for Airbnb Investment in Meersburg (2026)
Exploring the top neighborhoods for short-term rentals in Meersburg? This section highlights key areas, outlining why they are attractive for hosts and guests, along with notable local attractions. Consider these locations based on your target guest profile and investment strategy.
| Neighborhood / Area | Why Host Here? (Target Guests & Appeal) | Key Attractions & Landmarks |
|---|---|---|
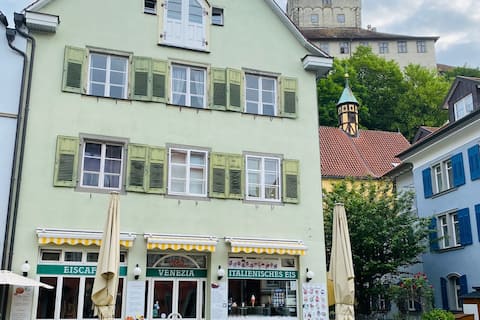
| Altstadt Meersburg | The charming old town of Meersburg with its cobblestone streets and medieval architecture. A popular destination for tourists exploring the history and beauty of the region. | Meersburg Castle, Meersburg Wine Museum, New Castle Meersburg, St. John's Church, Meersburg Ferry, Lake Constance Promenade |
| Bodensee Promenade | The scenic lakeside boulevard perfect for strolls, dining, and boating activities. Attracts visitors for its stunning views of Lake Constance and the Alps. | Lake Constance, Lakeside parks, Boat tours, Cafés and restaurants by the water |
| Burg Meersburg | The historic castle offering panoramic views over Lake Constance and a rich cultural experience. A key attraction drawing history enthusiasts and tourists alike. | Historic exhibitions, Castle tours, Beautiful gardens, Events and festivals |
| Thermalbad Meersburg | A relaxing area close to spa facilities and wellness centers. Ideal for visitors looking to unwind and enjoy the natural hot springs. | Spa treatments, Wellness services, Thermal baths |
| Weinstrasse | The region surrounding Meersburg known for its vineyards and wine production. A must-visit for wine lovers and those looking to experience local traditions. | Wine tasting tours, Vineyard strolls, Local wine festivals |
| Uferpromenade | The promenade that runs along the lake, perfect for sunbathing, picnicking, and enjoying water sports. Ideal for families and outdoor enthusiasts. | Beach access, Playgrounds, Water sports activities |
| Erwins Kapelle | A scenic viewpoint and chapel offering stunning views of Lake Constance. Popular for hikes and leisurely walks. | Hiking trails, Stunning viewpoints, Scenic photography spots |
| Meersburg Markt | The main market area of Meersburg, bustling with shops, cafés, and local crafts. A central point for tourists to experience local culture. | Weekly market, Local shops, Cafés, Cultural events |
Understanding Airbnb License Requirements & STR Laws in Meersburg (2026)
While Meersburg, Baden-Württemberg, Germany currently shows low STR regulations, specific Airbnb license requirements might still exist or change. Always verify the latest short term rental regulations and Airbnb license requirements directly with local government authorities for Meersburg to ensure full compliance before hosting.
(Source: AirROI data, 2026, finding no licensed listings among those analyzed)
Top Performing Airbnb Properties in Meersburg (2026)
Benchmark your potential! Explore examples of top-performing Airbnb properties in Meersburgbased on Trailing Twelve Month (TTM) revenue. Analyze their characteristics, revenue, occupancy rate, and ADR to understand what drives success in this market.
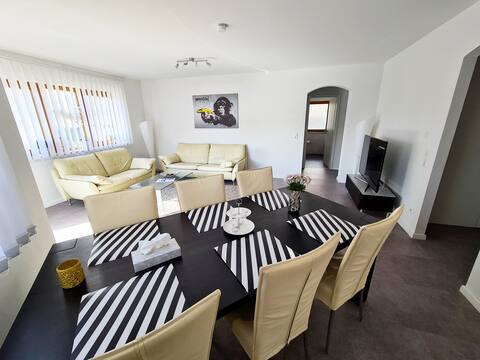
4 Z apartment in Meersburg
Entire Place • 3 bedrooms
Ferienwohnung Seeperle 3
Entire Place • 2 bedrooms
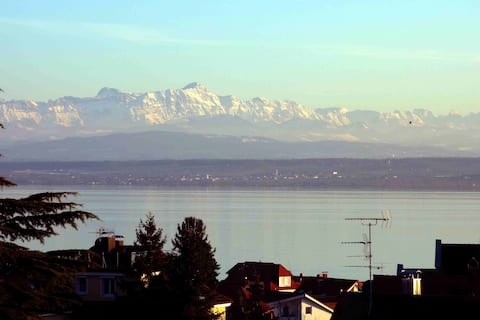
Enjoy the magnificent lake and Alpine views
Entire Place • 2 bedrooms

Ferienwohnung Seeperle 4
Entire Place • 1 bedroom
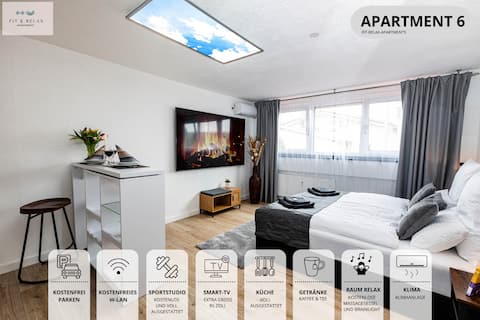
Fit-Relax Apartment at Lake Constance
Entire Place • 1 bedroom

Holidays in Meersburg: Arrive and enjoy!
Entire Place • 1 bedroom
Note: Performance varies based on location, size, amenities, seasonality, and management quality. Data reflects the past 12 months.
Top Performing Airbnb Hosts in Meersburg (2026)
Learn from the best! This table showcases top-performing Airbnb hosts in Meersburg based on the number of properties managed and estimated total revenue over the past year. Analyze their scale and performance metrics.
| Host Name | Properties | Grossing Revenue | Stay Reviews | Avg Rating |
|---|---|---|---|---|
| Maximilian | 4 | $133,727 | 211 | 4.83/5.0 |
| Ralph | 5 | $117,732 | 213 | 4.67/5.0 |
| Michaela | 2 | $80,258 | 58 | 4.76/5.0 |
| Wolfgang | 3 | $77,452 | 98 | 4.95/5.0 |
| Gisela | 4 | $70,311 | 931 | 4.83/5.0 |
| Claudia Und Thomas | 3 | $68,645 | 86 | 4.97/5.0 |
| Petra | 3 | $60,154 | 217 | 4.88/5.0 |
| Christopher Kohler | 4 | $56,898 | 26 | 4.46/5.0 |
| Stefan | 3 | $49,940 | 205 | 4.67/5.0 |
| Enikö | 2 | $48,773 | 101 | 4.88/5.0 |
Analyzing the strategies of top hosts, such as their property selection, pricing, and guest communication, can offer valuable lessons for optimizing your own Airbnb operations in Meersburg.
Dive Deeper: Advanced Meersburg STR Market Data (2026)
Ready to unlock more insights? AirROI provides access to advanced metrics and comprehensive Airbnb data for Meersburg. Explore detailed analytics beyond this report to refine your investment strategy, optimize pricing, and maximize your vacation rental profits.
Explore Advanced MetricsMeersburg Short-Term Rental Market Composition (2026): Property & Room Types
Room Type Distribution
Property Type Distribution
Market Composition Insights for Meersburg
- The Meersburg Airbnb market composition is heavily skewed towards Entire Home/Apt listings, which make up 93.4% of the 76 active rentals. This indicates strong guest preference for privacy and space.
- Looking at the property type distribution in Meersburg, Apartment/Condo properties are the most common (89.5%), reflecting the local real estate landscape.
- The presence of 9.2% Hotel/Boutique listings indicates integration with traditional hospitality.
- Smaller segments like house (combined 1.3%) offer potential for unique stay experiences.
Meersburg Airbnb Room Capacity Analysis (2026): Bedroom Distribution
Distribution of Listings by Number of Bedrooms
Room Capacity Insights for Meersburg
- The dominant room capacity in Meersburg is 1 bedroom listings, making up 64.5% of the market. This suggests a strong demand for properties suitable for couples or solo travelers.
- Together, 1 bedroom and 2 bedrooms properties represent 85.6% of the active Airbnb listings in Meersburg, indicating a high concentration in these sizes.
- With over half the market (64.5%) consisting of studios or 1-bedroom units, Meersburg is particularly well-suited for individuals or couples.
- Listings with 3+ bedrooms (1.3%) represent a smaller niche, potentially indicating an underserved market for larger group accommodations in Meersburg.
Meersburg Vacation Rental Guest Capacity Trends (2026)
Distribution of Listings by Guest Capacity
Guest Capacity Insights for Meersburg
- The most common guest capacity trend in Meersburg vacation rentals is listings accommodating 2 guests (40.8%). This suggests the primary traveler segment is likely couples or solo travelers.
- Properties designed for 2 guests and 4 guests dominate the Meersburg STR market, accounting for 71.1% of listings.
- A significant 42.1% of listings cater specifically to 1-2 guests, highlighting strong demand from couples and solo travelers in Meersburg.
- On average, properties in Meersburg are equipped to host 3.1 guests.
Meersburg Airbnb Booking Patterns (2026): Available vs. Booked Days
Available Days Distribution
Booked Days Distribution
Booking Pattern Insights for Meersburg
- The most common availability pattern in Meersburg falls within the 181-270 days range, representing 40.8% of listings. This suggests many properties have significant open periods on their calendars.
- Approximately 73.7% of listings show high availability (181+ days open annually), indicating potential for increased bookings or specific owner usage patterns.
- For booked days, the 91-180 days range is most frequent in Meersburg (39.5%), reflecting common guest stay durations or potential owner blocking patterns.
- A notable 30.2% of properties secure long booking periods (181+ days booked per year), highlighting successful long-term rental strategies or significant owner usage.
Meersburg Airbnb Minimum Stay Requirements Analysis
Distribution of Listings by Minimum Night Requirement
1 Night
8 listings
10.5% of total
2 Nights
3 listings
3.9% of total
3 Nights
6 listings
7.9% of total
4-6 Nights
25 listings
32.9% of total
7-29 Nights
2 listings
2.6% of total
30+ Nights
32 listings
42.1% of total
Key Insights
- The most prevalent minimum stay requirement in Meersburg is 30+ Nights, adopted by 42.1% of listings. This highlights the market's preference for longer commitments.
- Very short stays (1-2 nights) are less common (14.4%), suggesting hosts prefer slightly longer bookings to optimize turnover.
- A significant segment (42.1%) caters to monthly stays (30+ nights) in Meersburg, pointing to opportunities in the extended-stay market.
Recommendations
- Align with the market by considering a 30+ Nights minimum stay, as 42.1% of Meersburg hosts use this setting.
- If feasible, allowing 1-night stays, especially midweek or during low season, could capture last-minute bookings, as only 10.5% currently do.
- Explore offering discounts for stays of 30+ nights to attract the 42.1% of the market seeking extended stays.
- Adjust minimum nights based on seasonality – potentially shorter during low season and longer during peak demand periods in Meersburg.
Meersburg Airbnb Cancellation Policy Trends Analysis (2026)
Non-refundable
1 listings
1.3% of total
Super Strict 30 Days
1 listings
1.3% of total
Flexible
12 listings
15.8% of total
Moderate
17 listings
22.4% of total
Firm
35 listings
46.1% of total
Strict
10 listings
13.2% of total
Cancellation Policy Insights for Meersburg
- The prevailing Airbnb cancellation policy trend in Meersburg is Firm, used by 46.1% of listings.
- A majority (59.3%) of hosts in Meersburg utilize Firm or Strict policies, indicating a market where hosts prioritize booking security.
Recommendations for Hosts
- Consider adopting a Firm policy to align with the 46.1% market standard in Meersburg.
- Using a Strict policy might deter some guests, as only 13.2% of listings use it. Evaluate if potential revenue protection outweighs possible lower booking rates.
- Regularly review your cancellation policy against competitors and market demand shifts in Meersburg.
Meersburg STR Booking Lead Time Analysis (2026)
Average Booking Lead Time by Month
Booking Lead Time Insights for Meersburg
- The overall average booking lead time for vacation rentals in Meersburg is 94 days.
- Guests book furthest in advance for stays during August (average 139 days), likely coinciding with peak travel demand or local events.
- The shortest booking windows occur for stays in February (average 29 days), indicating more last-minute travel plans during this time.
- Seasonally, Summer (128 days avg.) sees the longest lead times, while Winter (45 days avg.) has the shortest, reflecting typical travel planning cycles.
Recommendations for Hosts
- Use the overall average lead time (94 days) as a baseline for your pricing and availability strategy in Meersburg.
- For August stays, consider implementing length-of-stay discounts or slightly higher rates for bookings made less than 139 days out to capitalize on advance planning.
- Target marketing efforts for the Summer season well in advance (at least 128 days) to capture early planners.
- Monitor your own booking lead times against these Meersburg averages to identify opportunities for dynamic pricing adjustments.
Popular & Essential Airbnb Amenities in Meersburg (2026)
Amenity Prevalence
Amenity Insights for Meersburg
- Essential amenities in Meersburg that guests expect include: Wifi, Heating, TV, Smoke alarm. Lacking these (any) could significantly impact bookings.
- Popular amenities like Kitchen, Hot water, Hangers are common but not universal. Offering these can provide a competitive edge.
Recommendations for Hosts
- Ensure your listing includes all essential amenities for Meersburg: Wifi, Heating, TV, Smoke alarm.
- Prioritize adding missing essentials: Wifi, Heating, TV, Smoke alarm.
- Consider adding popular differentiators like Kitchen or Hot water to increase appeal.
- Highlight unique or less common amenities you offer (e.g., hot tub, dedicated workspace, EV charger) in your listing description and photos.
- Regularly check competitor amenities in Meersburg to stay competitive.
Meersburg Airbnb Guest Demographics & Profile Analysis (2026)
Guest Profile Summary for Meersburg
- The typical guest profile for Airbnb in Meersburg consists of a mix of domestic (63%) and international guests, often arriving from nearby Berlin, typically belonging to the Post-2000s (Gen Z/Alpha) group (50%), primarily speaking English or German.
- Domestic travelers account for 63.4% of guests.
- Key international markets include Germany (63.4%) and Switzerland (9.4%).
- Top languages spoken are English (37.5%) followed by German (32.9%).
- A significant demographic segment is the Post-2000s (Gen Z/Alpha) group, representing 50% of guests.
Recommendations for Hosts
- Target domestic marketing efforts towards travelers from Berlin and Munich.
- Tailor amenities and listing descriptions to appeal to the dominant Post-2000s (Gen Z/Alpha) demographic (e.g., highlight fast WiFi, smart home features, local guides).
- Highlight unique local experiences or amenities relevant to the primary guest profile.
- Consider seasonal promotions aligned with peak travel times for key origin markets.
Nearby Short-Term Rental Market Comparison
How does the Meersburg Airbnb market stack up against its neighbors? Compare key performance metrics like average monthly revenue, ADR, and occupancy rates in surrounding areas to understand the broader regional STR landscape.
| Market | Active Properties | Monthly Revenue | Daily Rate | Avg. Occupancy |
|---|---|---|---|---|
| Brienzwiler | 11 | $7,335 | $514.27 | 60% |
| Grindelwald | 513 | $5,587 | $396.62 | 56% |
| Bassersdorf | 16 | $5,337 | $431.59 | 46% |
| Balderschwang | 10 | $5,253 | $304.03 | 58% |
| Vitznau | 31 | $4,688 | $425.43 | 45% |
| Lucerne | 329 | $4,288 | $310.00 | 53% |
| Ingenbohl | 14 | $4,251 | $219.49 | 63% |
| Brienz (BE) | 157 | $4,232 | $331.88 | 50% |
| Flüelen | 11 | $3,911 | $313.02 | 57% |
| Schwanden bei Brienz | 21 | $3,891 | $254.22 | 63% |