Cartagena Airbnb Market Analysis 2026: Short Term Rental Data & Vacation Rental Statistics in Bolívar, Colombia
Is Airbnb profitable in Cartagena in 2026? Explore comprehensive Airbnb analytics for Cartagena, Bolívar, Colombia to uncover income potential. This 2026 STR market report for Cartagena, based on AirROI data from February 2025 to January 2026, reveals key trends in the bustling market of 7,862 active listings.
Whether you're considering an Airbnb investment in Cartagena, optimizing your existing vacation rental, or exploring rental arbitrage opportunities, understanding the Cartagena Airbnb data is crucial. Navigating the high regulation landscape is key to maximizing your short term rental income potential. Let's dive into the specifics.
Key Cartagena Airbnb Performance Metrics Overview
Monthly Airbnb Revenue Variations & Income Potential in Cartagena (2026)
Understanding the monthly revenue variations for Airbnb listings in Cartagena is key to maximizing your short term rental income potential. Seasonality significantly impacts earnings. Our analysis, based on data from the past 12 months, shows that the peak revenue month for STRs in Cartagena is typically March, while October often presents the lowest earnings, highlighting opportunities for strategic pricing adjustments during shoulder and low seasons. Explore the typical Airbnb income in Cartagena across different performance tiers:
- Best-in-class properties (Top 10%) achieve $3,915+ monthly, often utilizing dynamic pricing and superior guest experiences.
- Strong performing properties (Top 25%) earn $2,199 or more, indicating effective management and desirable locations/amenities.
- Typical properties (Median) generate around $1,118 per month, representing the average market performance.
- Entry-level properties (Bottom 25%) see earnings around $488, often with potential for optimization.
Average Monthly Airbnb Earnings Trend in Cartagena
Cartagena Airbnb Occupancy Rate Trends (2026)
Maximize your bookings by understanding the Cartagena STR occupancy trends. Seasonal demand shifts significantly influence how often properties are booked. Typically, Februarysees the highest demand (peak season occupancy), while May experiences the lowest (low season). Effective strategies, like adjusting minimum stays or offering promotions, can boost occupancy during slower periods. Here's how different property tiers perform in Cartagena:
- Best-in-class properties (Top 10%) achieve 81%+ occupancy, indicating high desirability and potentially optimized availability.
- Strong performing properties (Top 25%) maintain 65% or higher occupancy, suggesting good market fit and guest satisfaction.
- Typical properties (Median) have an occupancy rate around 41%.
- Entry-level properties (Bottom 25%) average 21% occupancy, potentially facing higher vacancy.
Average Monthly Occupancy Rate Trend in Cartagena
Average Daily Rate (ADR) Airbnb Trends in Cartagena (2026)
Effective short term rental pricing strategy in Cartagena involves understanding monthly ADR fluctuations. The Average Daily Rate (ADR) for Airbnb in Cartagena typically peaks in January and dips lowest during September. Leveraging Airbnb dynamic pricing tools or strategies based on this seasonality can significantly boost revenue. Here's a look at the typical nightly rates achieved:
- Best-in-class properties (Top 10%) command rates of $253+ per night, often due to premium features or locations.
- Strong performing properties (Top 25%) achieve nightly rates of $139 or more.
- Typical properties (Median) charge around $89 per night.
- Entry-level properties (Bottom 25%) earn around $55 per night.
Average Daily Rate (ADR) Trend by Month in Cartagena
Get Live Cartagena Market Intelligence 👇

Explore Real-time Analytics
Airbnb Seasonality Analysis & Trends in Cartagena (2026)
Peak Season (March, December, January)
- Revenue averages $2,294 per month
- Occupancy rates average 44.1%
- Daily rates average $164
Shoulder Season
- Revenue averages $2,038 per month
- Occupancy maintains around 45.6%
- Daily rates hold near $149
Low Season (May, September, October)
- Revenue drops to average $1,751 per month
- Occupancy decreases to average 39.1%
- Daily rates adjust to average $145
Seasonality Insights for Cartagena
- The Airbnb seasonality in Cartagena shows moderate seasonality with distinct peak and low periods. While the sections above show seasonal averages, it's also insightful to look at the extremes:
- During the high season, the absolute peak month showcases Cartagena's highest earning potential, with monthly revenues capable of climbing to $2,418, occupancy reaching a high of 52.4%, and ADRs peaking at $174.
- Conversely, the slowest single month of the year, typically falling within the low season, marks the market's lowest point. In this month, revenue might dip to $1,715, occupancy could drop to 37.9%, and ADRs may adjust down to $143.
- Understanding both the seasonal averages and these monthly peaks and troughs in revenue, occupancy, and ADR is crucial for maximizing your Airbnb profit potential in Cartagena.
Seasonal Strategies for Maximizing Profit
- Peak Season: Maximize revenue through premium pricing and potentially longer minimum stays. Ensure high availability.
- Low Season: Offer competitive pricing, special promotions (e.g., extended stay discounts), and flexible cancellation policies. Target off-season travelers like remote workers or budget-conscious guests.
- Shoulder Seasons: Implement dynamic pricing that balances peak and low rates. Target weekend travelers or specific events. Offer slightly more flexible terms than peak season.
- Regularly analyze your own performance against these Cartagena seasonality benchmarks and adjust your pricing and availability strategy accordingly.
Best Areas for Airbnb Investment in Cartagena (2026)
Exploring the top neighborhoods for short-term rentals in Cartagena? This section highlights key areas, outlining why they are attractive for hosts and guests, along with notable local attractions. Consider these locations based on your target guest profile and investment strategy.
| Neighborhood / Area | Why Host Here? (Target Guests & Appeal) | Key Attractions & Landmarks |
|---|---|---|
| Old Town | The historic and vibrant heart of Cartagena, filled with colonial architecture, cobblestone streets, and rich culture. It's a prime location for tourists seeking history and charm. | Castillo San Felipe de Barajas, Plaza Santo Domingo, La Catedral de Cartagena, Palacio de la Inquisición, Museo del Oro Zenu |
| Getsemani | A trendy and bohemian neighborhood known for its artistic vibe and street art. Popular among young travelers and creative spirits looking for a laid-back atmosphere while being close to the action. | Plaza de la Trinidad, Street art murals, Casa de la Cultura, Vida Vaga Cafe, Art galleries |
| Bocagrande | A modern beach neighborhood known for its high-rise buildings, shopping, and nightlife. Ideal for beachgoers and tourists looking for a contemporary lifestyle with access to the beach. | Bocagrande Beach, Centro Comercial Bocagrande, Calle 7, Cartagena de Indias Convention Center, Nightclubs and bars |
| La Boquilla | A quiet coastal area with beautiful beaches and local charm. Popular with families and those looking for a more relaxed beach experience away from the bustling city. | La Boquilla Beach, Wind and kite surfing, Fishing villages, Local restaurants and beach shacks |
| Manga | An upscale residential neighborhood known for its tranquility and proximity to the historical center. Attracts families and longer-term visitors looking for comfort and convenience. | Parque de la Marina, Shopping centers, Local cafes and restaurants, Viewpoints overlooking the bay |
| El Laguito | A beach neighborhood adjacent to Bocagrande, known for its picturesque views of the Caribbean Sea and a mix of residential and tourist accommodations. Popular among both locals and visitors. | Laguito Beach, Shopping malls, Restaurants with sea views, Local cultural events |
| San Diego | A charming area in the Old City known for its colorful streets and local markets. Attracts visitors interested in culture, local cuisine, and shopping. | Plaza San Diego, Local artisan shops, Historic colonial buildings, Cafes and street food |
| Rosario Islands | A stunning archipelago near Cartagena, ideal for eco-tourism and water sports. Attracts visitors looking for nature, relaxation, and adventure. | Isla del Rosario National Park, Coral reefs, Diving and snorkeling spots, Beach resorts |
Understanding Airbnb License Requirements & STR Laws in Cartagena (2026)
Yes, Cartagena, Bolívar, Colombia enforces high STR regulations. Obtaining a license and ensuring compliance is almost certainly required according to current 2026 STR laws. Always verify the latest short term rental regulations and Airbnb license requirements directly with local government authorities for Cartagena to ensure full compliance before hosting.
(Source: AirROI data, 2026, based on 92% licensed listings)
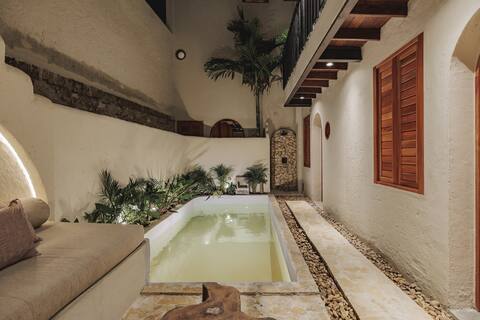
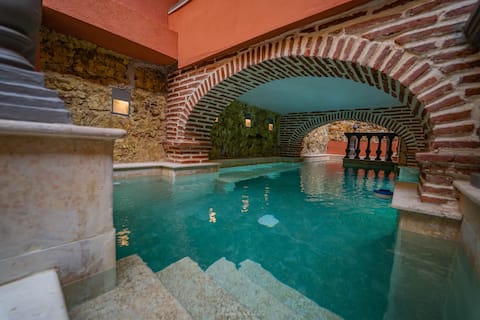
Top Performing Airbnb Properties in Cartagena (2026)
Benchmark your potential! Explore examples of top-performing Airbnb properties in Cartagenabased on Trailing Twelve Month (TTM) revenue. Analyze their characteristics, revenue, occupancy rate, and ADR to understand what drives success in this market.

Private Villa with Pool & Breakfast – Old Town
Entire Place • 13 bedrooms
13 luxury suites 3 pools w Bkfst + cln + sec incl
Entire Place • 13 bedrooms

21 Bedroom Luxury Mansion in the Old City
Entire Place • 21 bedrooms

Luxury 21 bedroom Villa in Old City Best Location
Entire Place • 21 bedrooms
Casa Tien | Private pool in Walled City
Entire Place • 10 bedrooms

Casa Del Hidalgo - Walled City 7BR Colonial Villa
Entire Place • 7 bedrooms
Note: Performance varies based on location, size, amenities, seasonality, and management quality. Data reflects the past 12 months.
Top Performing Airbnb Hosts in Cartagena (2026)
Learn from the best! This table showcases top-performing Airbnb hosts in Cartagena based on the number of properties managed and estimated total revenue over the past year. Analyze their scale and performance metrics.
| Host Name | Properties | Grossing Revenue | Stay Reviews | Avg Rating |
|---|---|---|---|---|
| Mark | 77 | $7,134,491 | 5470 | 4.77/5.0 |
| Bercelio Cartagena Rentals | 29 | $2,920,818 | 1059 | 4.93/5.0 |
| Maria Clemencia | 101 | $2,211,867 | 9735 | 4.87/5.0 |
| Luis | 78 | $2,045,146 | 8274 | 4.71/5.0 |
| David | 10 | $1,940,500 | 1151 | 4.81/5.0 |
| Go Cartagena | 72 | $1,509,818 | 4107 | 4.66/5.0 |
| Saad | 15 | $1,304,415 | 1196 | 4.93/5.0 |
| Luis Manuel | 20 | $1,249,867 | 388 | 4.59/5.0 |
| Luxury Rentals CTG | 88 | $1,239,342 | 5471 | 4.71/5.0 |
| LA SANTISIMA Cartagena | 7 | $1,216,867 | 201 | 4.88/5.0 |
Analyzing the strategies of top hosts, such as their property selection, pricing, and guest communication, can offer valuable lessons for optimizing your own Airbnb operations in Cartagena.
Dive Deeper: Advanced Cartagena STR Market Data (2026)
Ready to unlock more insights? AirROI provides access to advanced metrics and comprehensive Airbnb data for Cartagena. Explore detailed analytics beyond this report to refine your investment strategy, optimize pricing, and maximize your vacation rental profits.
Explore Advanced MetricsCartagena Short-Term Rental Market Composition (2026): Property & Room Types
Room Type Distribution
Property Type Distribution
Market Composition Insights for Cartagena
- The Cartagena Airbnb market composition is heavily skewed towards Entire Home/Apt listings, which make up 83.8% of the 7,862 active rentals. This indicates strong guest preference for privacy and space.
- Looking at the property type distribution in Cartagena, Apartment/Condo properties are the most common (76.4%), reflecting the local real estate landscape.
- Houses represent a significant 15.4% portion, catering likely to families or larger groups.
- The presence of 6.3% Hotel/Boutique listings indicates integration with traditional hospitality.
- Smaller segments like outdoor/unique, others, unique stays (combined 1.9%) offer potential for unique stay experiences.
Cartagena Airbnb Room Capacity Analysis (2026): Bedroom Distribution
Distribution of Listings by Number of Bedrooms
Room Capacity Insights for Cartagena
- The dominant room capacity in Cartagena is 1 bedroom listings, making up 35.4% of the market. This suggests a strong demand for properties suitable for couples or solo travelers.
- Together, 1 bedroom and 2 bedrooms properties represent 67.3% of the active Airbnb listings in Cartagena, indicating a high concentration in these sizes.
- A significant 22.4% of listings offer 3+ bedrooms, catering to larger groups and families seeking more space in Cartagena.
Cartagena Vacation Rental Guest Capacity Trends (2026)
Distribution of Listings by Guest Capacity
Guest Capacity Insights for Cartagena
- The most common guest capacity trend in Cartagena vacation rentals is listings accommodating 4 guests (23.2%). This suggests the primary traveler segment is likely small families or groups.
- Properties designed for 4 guests and 6 guests dominate the Cartagena STR market, accounting for 43.0% of listings.
- 41.5% of properties accommodate 6+ guests, serving the market segment for larger families or group travel in Cartagena.
- On average, properties in Cartagena are equipped to host 4.7 guests.
Cartagena Airbnb Booking Patterns (2026): Available vs. Booked Days
Available Days Distribution
Booked Days Distribution
Booking Pattern Insights for Cartagena
- The most common availability pattern in Cartagena falls within the 271-366 days range, representing 46.6% of listings. This suggests many properties have significant open periods on their calendars.
- Approximately 76.9% of listings show high availability (181+ days open annually), indicating potential for increased bookings or specific owner usage patterns.
- For booked days, the 91-180 days range is most frequent in Cartagena (30.8%), reflecting common guest stay durations or potential owner blocking patterns.
- A notable 24.2% of properties secure long booking periods (181+ days booked per year), highlighting successful long-term rental strategies or significant owner usage.
Cartagena Airbnb Minimum Stay Requirements Analysis
Distribution of Listings by Minimum Night Requirement
1 Night
2478 listings
31.5% of total
2 Nights
2675 listings
34% of total
3 Nights
256 listings
3.3% of total
4-6 Nights
72 listings
0.9% of total
7-29 Nights
101 listings
1.3% of total
30+ Nights
2280 listings
29% of total
Key Insights
- The most prevalent minimum stay requirement in Cartagena is 2 Nights, adopted by 34% of listings. This highlights the market's preference for shorter, flexible bookings.
- A strong majority (65.5%) of the Cartagena Airbnb data shows acceptance of very short stays (1-2 nights), indicating a dynamic, high-turnover market.
- A significant segment (29%) caters to monthly stays (30+ nights) in Cartagena, pointing to opportunities in the extended-stay market.
Recommendations
- Align with the market by considering a 2 Nights minimum stay, as 34% of Cartagena hosts use this setting.
- Explore offering discounts for stays of 30+ nights to attract the 29% of the market seeking extended stays.
- Adjust minimum nights based on seasonality – potentially shorter during low season and longer during peak demand periods in Cartagena.
Cartagena Airbnb Cancellation Policy Trends Analysis (2026)
Super Strict 60 Days
41 listings
0.5% of total
Super Strict 30 Days
38 listings
0.5% of total
Refundable
1 listings
0% of total
Limited
310 listings
4% of total
Non-refundable
1 listings
0% of total
Flexible
2506 listings
32% of total
Moderate
1958 listings
25% of total
Firm
2381 listings
30.4% of total
Strict
595 listings
7.6% of total
Cancellation Policy Insights for Cartagena
- The prevailing Airbnb cancellation policy trend in Cartagena is Flexible, used by 32% of listings.
- There's a relatively balanced mix between guest-friendly (57.0%) and stricter (38.0%) policies, offering choices for different guest needs.
- Strict cancellation policies are quite rare (7.6%), potentially making listings with this policy less competitive unless justified by high demand or property type.
Recommendations for Hosts
- Consider adopting a Flexible policy to align with the 32% market standard in Cartagena.
- Using a Strict policy might deter some guests, as only 7.6% of listings use it. Evaluate if potential revenue protection outweighs possible lower booking rates.
- Regularly review your cancellation policy against competitors and market demand shifts in Cartagena.
Cartagena STR Booking Lead Time Analysis (2026)
Average Booking Lead Time by Month
Booking Lead Time Insights for Cartagena
- The overall average booking lead time for vacation rentals in Cartagena is 34 days.
- Guests book furthest in advance for stays during December (average 52 days), likely coinciding with peak travel demand or local events.
- The shortest booking windows occur for stays in June (average 26 days), indicating more last-minute travel plans during this time.
- Seasonally, Winter (42 days avg.) sees the longest lead times, while Spring (29 days avg.) has the shortest, reflecting typical travel planning cycles.
Recommendations for Hosts
- Use the overall average lead time (34 days) as a baseline for your pricing and availability strategy in Cartagena.
- For December stays, consider implementing length-of-stay discounts or slightly higher rates for bookings made less than 52 days out to capitalize on advance planning.
- Target marketing efforts for the Winter season well in advance (at least 42 days) to capture early planners.
- Monitor your own booking lead times against these Cartagena averages to identify opportunities for dynamic pricing adjustments.
Popular & Essential Airbnb Amenities in Cartagena (2026)
Amenity Prevalence
Amenity Insights for Cartagena
- Essential amenities in Cartagena that guests expect include: Wifi, Air conditioning. Lacking these (any) could significantly impact bookings.
- Popular amenities like TV, Kitchen, Dishes and silverware are common but not universal. Offering these can provide a competitive edge.
Recommendations for Hosts
- Ensure your listing includes all essential amenities for Cartagena: Wifi, Air conditioning.
- Prioritize adding missing essentials: Wifi, Air conditioning.
- Consider adding popular differentiators like TV or Kitchen to increase appeal.
- Highlight unique or less common amenities you offer (e.g., hot tub, dedicated workspace, EV charger) in your listing description and photos.
- Regularly check competitor amenities in Cartagena to stay competitive.
Cartagena Airbnb Guest Demographics & Profile Analysis (2026)
Guest Profile Summary for Cartagena
- The typical guest profile for Airbnb in Cartagena consists of predominantly international visitors (74%), with top international origins including Colombia, typically belonging to the Post-2000s (Gen Z/Alpha) group (50%), primarily speaking English or Spanish.
- Domestic travelers account for 26.5% of guests.
- Key international markets include United States (36.8%) and Colombia (26.5%).
- Top languages spoken are English (42.4%) followed by Spanish (39.4%).
- A significant demographic segment is the Post-2000s (Gen Z/Alpha) group, representing 50% of guests.
Recommendations for Hosts
- Focus marketing internationally, particularly towards travelers from Colombia.
- Tailor amenities and listing descriptions to appeal to the dominant Post-2000s (Gen Z/Alpha) demographic (e.g., highlight fast WiFi, smart home features, local guides).
- Highlight unique local experiences or amenities relevant to the primary guest profile.
- Consider seasonal promotions aligned with peak travel times for key origin markets.
Nearby Short-Term Rental Market Comparison
How does the Cartagena Airbnb market stack up against its neighbors? Compare key performance metrics like average monthly revenue, ADR, and occupancy rates in surrounding areas to understand the broader regional STR landscape.
| Market | Active Properties | Monthly Revenue | Daily Rate | Avg. Occupancy |
|---|---|---|---|---|
| El Pueblito | 37 | $1,723 | $454.65 | 20% |
| San Antero | 62 | $1,230 | $229.19 | 23% |
| Tolú | 287 | $1,210 | $187.24 | 24% |
| Coveñas | 389 | $1,025 | $143.10 | 31% |
| Provincia de Cartagena | 25 | $943 | $136.60 | 31% |
| Sabanilla | 16 | $905 | $194.05 | 19% |
| Manzanillo del Mar | 29 | $790 | $110.84 | 34% |
| Juan de Acosta | 21 | $769 | $205.60 | 20% |
| Santiago de Tolú | 44 | $744 | $144.99 | 25% |
| El Porvenir | 87 | $734 | $146.05 | 23% |