Votorantim Airbnb Market Analysis 2026: Short Term Rental Data & Vacation Rental Statistics in São Paulo, Brazil
Is Airbnb profitable in Votorantim in 2026? Explore comprehensive Airbnb analytics for Votorantim, São Paulo, Brazil to uncover income potential. This 2026 STR market report for Votorantim, based on AirROI data from February 2025 to January 2026, reveals key trends in the niche market of 47 active listings.
Whether you're considering an Airbnb investment in Votorantim, optimizing your existing vacation rental, or exploring rental arbitrage opportunities, understanding the Votorantim Airbnb data is crucial. Leveraging the low regulation environment is key to maximizing your short term rental income potential. Let's dive into the specifics.
Key Votorantim Airbnb Performance Metrics Overview
Monthly Airbnb Revenue Variations & Income Potential in Votorantim (2026)
Understanding the monthly revenue variations for Airbnb listings in Votorantim is key to maximizing your short term rental income potential. Seasonality significantly impacts earnings. Our analysis, based on data from the past 12 months, shows that the peak revenue month for STRs in Votorantim is typically December, while September often presents the lowest earnings, highlighting opportunities for strategic pricing adjustments during shoulder and low seasons. Explore the typical Airbnb income in Votorantim across different performance tiers:
- Best-in-class properties (Top 10%) achieve $1,309+ monthly, often utilizing dynamic pricing and superior guest experiences.
- Strong performing properties (Top 25%) earn $842 or more, indicating effective management and desirable locations/amenities.
- Typical properties (Median) generate around $531 per month, representing the average market performance.
- Entry-level properties (Bottom 25%) see earnings around $265, often with potential for optimization.
Average Monthly Airbnb Earnings Trend in Votorantim
Votorantim Airbnb Occupancy Rate Trends (2026)
Maximize your bookings by understanding the Votorantim STR occupancy trends. Seasonal demand shifts significantly influence how often properties are booked. Typically, Februarysees the highest demand (peak season occupancy), while April experiences the lowest (low season). Effective strategies, like adjusting minimum stays or offering promotions, can boost occupancy during slower periods. Here's how different property tiers perform in Votorantim:
- Best-in-class properties (Top 10%) achieve 77%+ occupancy, indicating high desirability and potentially optimized availability.
- Strong performing properties (Top 25%) maintain 60% or higher occupancy, suggesting good market fit and guest satisfaction.
- Typical properties (Median) have an occupancy rate around 40%.
- Entry-level properties (Bottom 25%) average 21% occupancy, potentially facing higher vacancy.
Average Monthly Occupancy Rate Trend in Votorantim
Average Daily Rate (ADR) Airbnb Trends in Votorantim (2026)
Effective short term rental pricing strategy in Votorantim involves understanding monthly ADR fluctuations. The Average Daily Rate (ADR) for Airbnb in Votorantim typically peaks in December and dips lowest during April. Leveraging Airbnb dynamic pricing tools or strategies based on this seasonality can significantly boost revenue. Here's a look at the typical nightly rates achieved:
- Best-in-class properties (Top 10%) command rates of $179+ per night, often due to premium features or locations.
- Strong performing properties (Top 25%) achieve nightly rates of $55 or more.
- Typical properties (Median) charge around $37 per night.
- Entry-level properties (Bottom 25%) earn around $27 per night.
Average Daily Rate (ADR) Trend by Month in Votorantim
Get Live Votorantim Market Intelligence 👇

Explore Real-time Analytics
Airbnb Seasonality Analysis & Trends in Votorantim (2026)
Peak Season (December, January, February)
- Revenue averages $823 per month
- Occupancy rates average 47.3%
- Daily rates average $68
Shoulder Season
- Revenue averages $682 per month
- Occupancy maintains around 40.9%
- Daily rates hold near $66
Low Season (June, August, September)
- Revenue drops to average $522 per month
- Occupancy decreases to average 40.6%
- Daily rates adjust to average $68
Seasonality Insights for Votorantim
- The Airbnb seasonality in Votorantim shows moderate seasonality with distinct peak and low periods. While the sections above show seasonal averages, it's also insightful to look at the extremes:
- During the high season, the absolute peak month showcases Votorantim's highest earning potential, with monthly revenues capable of climbing to $915, occupancy reaching a high of 52.1%, and ADRs peaking at $73.
- Conversely, the slowest single month of the year, typically falling within the low season, marks the market's lowest point. In this month, revenue might dip to $499, occupancy could drop to 35.7%, and ADRs may adjust down to $61.
- Understanding both the seasonal averages and these monthly peaks and troughs in revenue, occupancy, and ADR is crucial for maximizing your Airbnb profit potential in Votorantim.
Seasonal Strategies for Maximizing Profit
- Peak Season: Maximize revenue through premium pricing and potentially longer minimum stays. Ensure high availability.
- Low Season: Offer competitive pricing, special promotions (e.g., extended stay discounts), and flexible cancellation policies. Target off-season travelers like remote workers or budget-conscious guests.
- Shoulder Seasons: Implement dynamic pricing that balances peak and low rates. Target weekend travelers or specific events. Offer slightly more flexible terms than peak season.
- Regularly analyze your own performance against these Votorantim seasonality benchmarks and adjust your pricing and availability strategy accordingly.
Best Areas for Airbnb Investment in Votorantim (2026)
Exploring the top neighborhoods for short-term rentals in Votorantim? This section highlights key areas, outlining why they are attractive for hosts and guests, along with notable local attractions. Consider these locations based on your target guest profile and investment strategy.
| Neighborhood / Area | Why Host Here? (Target Guests & Appeal) | Key Attractions & Landmarks |
|---|---|---|
| Centro | The main commercial area of Votorantim with a variety of shops, restaurants, and easy access to services. Attracts visitors looking for convenience and local culture. | Igreja Matriz, Estação Ferroviária, Parque dos Pássaros, Vista do Morro do Cruzeiro, Shopping, Mercado Municipal |
| Vale do Ribeira | Known for its natural beauty and eco-tourism, this area is perfect for nature lovers and those looking to escape the city. | Cachoeira do Ribeirão, Parque Natural Municipal, Trilhas Ecológicas, Sítios de Eco-turismo, Pesca esportiva |
| Jardim dos Lagos | A residential area with beautiful parks and lakes, appealing to families and those looking for tranquility. Offers a serene environment near urban conveniences. | Lago do Jardim, Parque da Juventude, Praça da Paz |
| Vila São Carlos | A bustling neighborhood with local markets and eateries, giving visitors an authentic experience of Votorantim's daily life. | Feira Livre, Restaurantes locais, Cafés |
| Cajuru | A picturesque neighborhood with scenic views and community events, attracting visitors who desire a sense of local culture. | Praça da Matriz, Eventos comunitários, Natureza ao redor |
| Parque Jambeiro | This area features recreational parks and open spaces that are perfect for families and outdoor enthusiasts. | Parque Águas do Votorantim, Atividades recreativas, Piçarra e área de lazer |
| Votorantim City Park | A newer development area that’s growing in popularity due to its amenities and modern infrastructure. Attracts both tourists and business travelers. | Shopping Centers, Complexos esportivos, Cafés e Restaurantes modernos |
| Education Hub | Home to various educational institutions, this district attracts students and families visiting the area for academic purposes. | Universidade de Sorocaba, Colégios privados, Eventos educacionais |
Understanding Airbnb License Requirements & STR Laws in Votorantim (2026)
While Votorantim, São Paulo, Brazil currently shows low STR regulations, specific Airbnb license requirements might still exist or change. Always verify the latest short term rental regulations and Airbnb license requirements directly with local government authorities for Votorantim to ensure full compliance before hosting.
(Source: AirROI data, 2026, finding no licensed listings among those analyzed)
Top Performing Airbnb Properties in Votorantim (2026)
Benchmark your potential! Explore examples of top-performing Airbnb properties in Votorantimbased on Trailing Twelve Month (TTM) revenue. Analyze their characteristics, revenue, occupancy rate, and ADR to understand what drives success in this market.
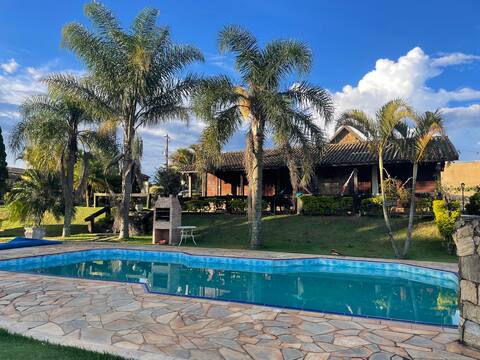
Excellent place for 22 people Beach, Beach Soccer/Soccer
Entire Place • 5 bedrooms

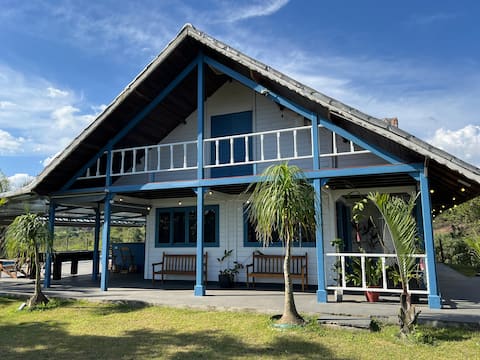
Villa in the countryside near São Paulo (amazing place)
Entire Place • 6 bedrooms
Chalet with a privileged view
Entire Place • 3 bedrooms
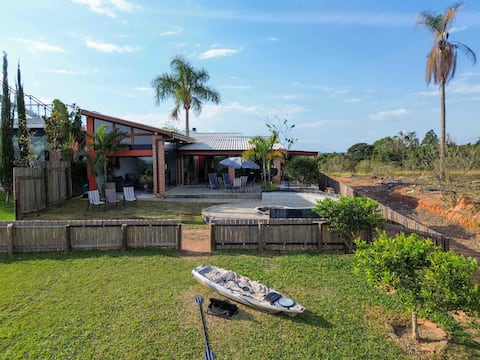
House by the Lake/Dam
Entire Place • 3 bedrooms

Ap Top 3 Dorm no Campolim-Acesso Shopping Iguatemi
Entire Place • 3 bedrooms

Apartment 200 meters from Shopping Iguatemi
Entire Place • 2 bedrooms
Note: Performance varies based on location, size, amenities, seasonality, and management quality. Data reflects the past 12 months.
Top Performing Airbnb Hosts in Votorantim (2026)
Learn from the best! This table showcases top-performing Airbnb hosts in Votorantim based on the number of properties managed and estimated total revenue over the past year. Analyze their scale and performance metrics.
| Host Name | Properties | Grossing Revenue | Stay Reviews | Avg Rating |
|---|---|---|---|---|
| Wagner | 3 | $30,188 | 130 | 4.93/5.0 |
| Val | 4 | $28,150 | 90 | 4.89/5.0 |
| Adriana | 1 | $24,472 | 44 | 4.77/5.0 |
| Pedro Vitor | 1 | $23,955 | 45 | 4.93/5.0 |
| Daniel | 1 | $17,979 | 27 | 4.96/5.0 |
| Ricardo Eli | 1 | $13,511 | 46 | 4.96/5.0 |
| Bru & Sal | 1 | $10,342 | 54 | 4.96/5.0 |
| Ana Carolina | 2 | $10,253 | 122 | 4.79/5.0 |
| Flor Bandeira E Daniel | 1 | $9,461 | 38 | 4.89/5.0 |
| Flavia Galli | 1 | $8,463 | 61 | 4.97/5.0 |
Analyzing the strategies of top hosts, such as their property selection, pricing, and guest communication, can offer valuable lessons for optimizing your own Airbnb operations in Votorantim.
Dive Deeper: Advanced Votorantim STR Market Data (2026)
Ready to unlock more insights? AirROI provides access to advanced metrics and comprehensive Airbnb data for Votorantim. Explore detailed analytics beyond this report to refine your investment strategy, optimize pricing, and maximize your vacation rental profits.
Explore Advanced MetricsVotorantim Short-Term Rental Market Composition (2026): Property & Room Types
Room Type Distribution
Property Type Distribution
Market Composition Insights for Votorantim
- The Votorantim Airbnb market composition is heavily skewed towards Entire Home/Apt listings, which make up 97.9% of the 47 active rentals. This indicates strong guest preference for privacy and space.
- Looking at the property type distribution in Votorantim, Apartment/Condo properties are the most common (78.7%), reflecting the local real estate landscape.
- Houses represent a significant 17% portion, catering likely to families or larger groups.
- Smaller segments like hotel/boutique, outdoor/unique (combined 4.2%) offer potential for unique stay experiences.
Votorantim Airbnb Room Capacity Analysis (2026): Bedroom Distribution
Distribution of Listings by Number of Bedrooms
Room Capacity Insights for Votorantim
- The dominant room capacity in Votorantim is 2 bedrooms listings, making up 70.2% of the market. This suggests a strong demand for properties suitable for couples or solo travelers.
- Together, 2 bedrooms and 3 bedrooms properties represent 87.2% of the active Airbnb listings in Votorantim, indicating a high concentration in these sizes.
- A significant 21.3% of listings offer 3+ bedrooms, catering to larger groups and families seeking more space in Votorantim.
Votorantim Vacation Rental Guest Capacity Trends (2026)
Distribution of Listings by Guest Capacity
Guest Capacity Insights for Votorantim
- The most common guest capacity trend in Votorantim vacation rentals is listings accommodating 4 guests (36.2%). This suggests the primary traveler segment is likely small families or groups.
- Properties designed for 4 guests and 6 guests dominate the Votorantim STR market, accounting for 55.3% of listings.
- 36.1% of properties accommodate 6+ guests, serving the market segment for larger families or group travel in Votorantim.
- On average, properties in Votorantim are equipped to host 4.9 guests.
Votorantim Airbnb Booking Patterns (2026): Available vs. Booked Days
Available Days Distribution
Booked Days Distribution
Booking Pattern Insights for Votorantim
- The most common availability pattern in Votorantim falls within the 181-270 days range, representing 40.4% of listings. This suggests many properties have significant open periods on their calendars.
- Approximately 76.6% of listings show high availability (181+ days open annually), indicating potential for increased bookings or specific owner usage patterns.
- For booked days, the 91-180 days range is most frequent in Votorantim (42.6%), reflecting common guest stay durations or potential owner blocking patterns.
- A notable 23.4% of properties secure long booking periods (181+ days booked per year), highlighting successful long-term rental strategies or significant owner usage.
Votorantim Airbnb Minimum Stay Requirements Analysis
Distribution of Listings by Minimum Night Requirement
1 Night
16 listings
34% of total
2 Nights
10 listings
21.3% of total
3 Nights
6 listings
12.8% of total
4-6 Nights
2 listings
4.3% of total
7-29 Nights
4 listings
8.5% of total
30+ Nights
9 listings
19.1% of total
Key Insights
- The most prevalent minimum stay requirement in Votorantim is 1 Night, adopted by 34% of listings. This highlights the market's preference for shorter, flexible bookings.
- A significant segment (19.1%) caters to monthly stays (30+ nights) in Votorantim, pointing to opportunities in the extended-stay market.
Recommendations
- Align with the market by considering a 1 Night minimum stay, as 34% of Votorantim hosts use this setting.
- Explore offering discounts for stays of 30+ nights to attract the 19.1% of the market seeking extended stays.
- Adjust minimum nights based on seasonality – potentially shorter during low season and longer during peak demand periods in Votorantim.
Votorantim Airbnb Cancellation Policy Trends Analysis (2026)
Limited
2 listings
4.3% of total
Flexible
10 listings
21.3% of total
Moderate
17 listings
36.2% of total
Firm
9 listings
19.1% of total
Strict
9 listings
19.1% of total
Cancellation Policy Insights for Votorantim
- The prevailing Airbnb cancellation policy trend in Votorantim is Moderate, used by 36.2% of listings.
- There's a relatively balanced mix between guest-friendly (57.5%) and stricter (38.2%) policies, offering choices for different guest needs.
Recommendations for Hosts
- Consider adopting a Moderate policy to align with the 36.2% market standard in Votorantim.
- Regularly review your cancellation policy against competitors and market demand shifts in Votorantim.
Votorantim STR Booking Lead Time Analysis (2026)
Average Booking Lead Time by Month
Booking Lead Time Insights for Votorantim
- The overall average booking lead time for vacation rentals in Votorantim is 23 days.
- Guests book furthest in advance for stays during October (average 54 days), likely coinciding with peak travel demand or local events.
- The shortest booking windows occur for stays in September (average 10 days), indicating more last-minute travel plans during this time.
- Seasonally, Fall (28 days avg.) sees the longest lead times, while Spring (13 days avg.) has the shortest, reflecting typical travel planning cycles.
Recommendations for Hosts
- Use the overall average lead time (23 days) as a baseline for your pricing and availability strategy in Votorantim.
- For October stays, consider implementing length-of-stay discounts or slightly higher rates for bookings made less than 54 days out to capitalize on advance planning.
- During September, focus on last-minute booking availability and promotions, as guests book with very short notice (10 days avg.).
- Target marketing efforts for the Fall season well in advance (at least 28 days) to capture early planners.
- Monitor your own booking lead times against these Votorantim averages to identify opportunities for dynamic pricing adjustments.
Popular & Essential Airbnb Amenities in Votorantim (2026)
Amenity Prevalence
Amenity Insights for Votorantim
- Essential amenities in Votorantim that guests expect include: TV, Wifi, Kitchen. Lacking these (any) could significantly impact bookings.
- Popular amenities like Free parking on premises, Refrigerator, Dishes and silverware are common but not universal. Offering these can provide a competitive edge.
Recommendations for Hosts
- Ensure your listing includes all essential amenities for Votorantim: TV, Wifi, Kitchen.
- Prioritize adding missing essentials: Wifi, Kitchen.
- Consider adding popular differentiators like Free parking on premises or Refrigerator to increase appeal.
- Highlight unique or less common amenities you offer (e.g., hot tub, dedicated workspace, EV charger) in your listing description and photos.
- Regularly check competitor amenities in Votorantim to stay competitive.
Votorantim Airbnb Guest Demographics & Profile Analysis (2026)
Guest Profile Summary for Votorantim
- The typical guest profile for Airbnb in Votorantim consists of primarily domestic travelers (86%), often arriving from nearby São Paulo, typically belonging to the Post-2000s (Gen Z/Alpha) group (50%), primarily speaking Portuguese or English.
- Domestic travelers account for 86.3% of guests.
- Key international markets include Brazil (86.3%) and United States (2.7%).
- Top languages spoken are Portuguese (45.5%) followed by English (32.3%).
- A significant demographic segment is the Post-2000s (Gen Z/Alpha) group, representing 50% of guests.
Recommendations for Hosts
- Target domestic marketing efforts towards travelers from São Paulo and Sorocaba.
- Tailor amenities and listing descriptions to appeal to the dominant Post-2000s (Gen Z/Alpha) demographic (e.g., highlight fast WiFi, smart home features, local guides).
- Highlight unique local experiences or amenities relevant to the primary guest profile.
- Consider seasonal promotions aligned with peak travel times for key origin markets.
Nearby Short-Term Rental Market Comparison
How does the Votorantim Airbnb market stack up against its neighbors? Compare key performance metrics like average monthly revenue, ADR, and occupancy rates in surrounding areas to understand the broader regional STR landscape.
| Market | Active Properties | Monthly Revenue | Daily Rate | Avg. Occupancy |
|---|---|---|---|---|
| Riviera de São Lourenço | 10 | $2,868 | $213.78 | 46% |
| Tuiuti | 18 | $1,686 | $156.45 | 30% |
| Itupeva | 136 | $1,561 | $225.82 | 28% |
| Morungaba | 31 | $1,435 | $263.39 | 27% |
| Campo Limpo Paulista | 49 | $1,428 | $181.02 | 30% |
| Valinhos | 61 | $1,370 | $176.28 | 33% |
| Itatiba | 171 | $1,331 | $177.58 | 29% |
| Vargem | 48 | $1,319 | $190.42 | 28% |
| Elias Fausto | 13 | $1,296 | $143.78 | 30% |
| Porto Feliz | 69 | $1,279 | $260.86 | 27% |