Tuiuti Airbnb Market Analysis 2026: Short Term Rental Data & Vacation Rental Statistics in São Paulo, Brazil
Is Airbnb profitable in Tuiuti in 2026? Explore comprehensive Airbnb analytics for Tuiuti, São Paulo, Brazil to uncover income potential. This 2026 STR market report for Tuiuti, based on AirROI data from February 2025 to January 2026, reveals key trends in the niche market of 18 active listings.
Whether you're considering an Airbnb investment in Tuiuti, optimizing your existing vacation rental, or exploring rental arbitrage opportunities, understanding the Tuiuti Airbnb data is crucial. Leveraging the low regulation environment is key to maximizing your short term rental income potential. Let's dive into the specifics.
Key Tuiuti Airbnb Performance Metrics Overview
Monthly Airbnb Revenue Variations & Income Potential in Tuiuti (2026)
Understanding the monthly revenue variations for Airbnb listings in Tuiuti is key to maximizing your short term rental income potential. Seasonality significantly impacts earnings. Our analysis, based on data from the past 12 months, shows that the peak revenue month for STRs in Tuiuti is typically November, while June often presents the lowest earnings, highlighting opportunities for strategic pricing adjustments during shoulder and low seasons. Explore the typical Airbnb income in Tuiuti across different performance tiers:
- Best-in-class properties (Top 10%) achieve $4,506+ monthly, often utilizing dynamic pricing and superior guest experiences.
- Strong performing properties (Top 25%) earn $3,539 or more, indicating effective management and desirable locations/amenities.
- Typical properties (Median) generate around $1,869 per month, representing the average market performance.
- Entry-level properties (Bottom 25%) see earnings around $470, often with potential for optimization.
Average Monthly Airbnb Earnings Trend in Tuiuti
Tuiuti Airbnb Occupancy Rate Trends (2026)
Maximize your bookings by understanding the Tuiuti STR occupancy trends. Seasonal demand shifts significantly influence how often properties are booked. Typically, Novembersees the highest demand (peak season occupancy), while January experiences the lowest (low season). Effective strategies, like adjusting minimum stays or offering promotions, can boost occupancy during slower periods. Here's how different property tiers perform in Tuiuti:
- Best-in-class properties (Top 10%) achieve 74%+ occupancy, indicating high desirability and potentially optimized availability.
- Strong performing properties (Top 25%) maintain 54% or higher occupancy, suggesting good market fit and guest satisfaction.
- Typical properties (Median) have an occupancy rate around 25%.
- Entry-level properties (Bottom 25%) average 10% occupancy, potentially facing higher vacancy.
Average Monthly Occupancy Rate Trend in Tuiuti
Average Daily Rate (ADR) Airbnb Trends in Tuiuti (2026)
Effective short term rental pricing strategy in Tuiuti involves understanding monthly ADR fluctuations. The Average Daily Rate (ADR) for Airbnb in Tuiuti typically peaks in December and dips lowest during April. Leveraging Airbnb dynamic pricing tools or strategies based on this seasonality can significantly boost revenue. Here's a look at the typical nightly rates achieved:
- Best-in-class properties (Top 10%) command rates of $331+ per night, often due to premium features or locations.
- Strong performing properties (Top 25%) achieve nightly rates of $201 or more.
- Typical properties (Median) charge around $141 per night.
- Entry-level properties (Bottom 25%) earn around $39 per night.
Average Daily Rate (ADR) Trend by Month in Tuiuti
Get Live Tuiuti Market Intelligence 👇

Explore Real-time Analytics
Airbnb Seasonality Analysis & Trends in Tuiuti (2026)
Peak Season (November, December, July)
- Revenue averages $2,859 per month
- Occupancy rates average 37.1%
- Daily rates average $197
Shoulder Season
- Revenue averages $2,148 per month
- Occupancy maintains around 34.8%
- Daily rates hold near $183
Low Season (February, April, June)
- Revenue drops to average $1,755 per month
- Occupancy decreases to average 33.8%
- Daily rates adjust to average $166
Seasonality Insights for Tuiuti
- The Airbnb seasonality in Tuiuti shows moderate seasonality with distinct peak and low periods. While the sections above show seasonal averages, it's also insightful to look at the extremes:
- During the high season, the absolute peak month showcases Tuiuti's highest earning potential, with monthly revenues capable of climbing to $2,886, occupancy reaching a high of 46.7%, and ADRs peaking at $224.
- Conversely, the slowest single month of the year, typically falling within the low season, marks the market's lowest point. In this month, revenue might dip to $1,680, occupancy could drop to 22.6%, and ADRs may adjust down to $160.
- Understanding both the seasonal averages and these monthly peaks and troughs in revenue, occupancy, and ADR is crucial for maximizing your Airbnb profit potential in Tuiuti.
Seasonal Strategies for Maximizing Profit
- Peak Season: Maximize revenue through premium pricing and potentially longer minimum stays. Ensure high availability.
- Low Season: Offer competitive pricing, special promotions (e.g., extended stay discounts), and flexible cancellation policies. Target off-season travelers like remote workers or budget-conscious guests.
- Shoulder Seasons: Implement dynamic pricing that balances peak and low rates. Target weekend travelers or specific events. Offer slightly more flexible terms than peak season.
- Regularly analyze your own performance against these Tuiuti seasonality benchmarks and adjust your pricing and availability strategy accordingly.
Best Areas for Airbnb Investment in Tuiuti (2026)
Exploring the top neighborhoods for short-term rentals in Tuiuti? This section highlights key areas, outlining why they are attractive for hosts and guests, along with notable local attractions. Consider these locations based on your target guest profile and investment strategy.
| Neighborhood / Area | Why Host Here? (Target Guests & Appeal) | Key Attractions & Landmarks |
|---|---|---|
| Centro | Main commercial and cultural hub of Tuiuti, known for its vibrant atmosphere and proximity to local attractions. Ideal for tourists looking for an authentic experience in the heart of the city. | Museu de Tuiuti, Parque das Águas, Teatro Municipal, feiras e mercados locais, restaurantes e bares |
| Serra da Mantiqueira | A beautiful mountainous area near Tuiuti, attracting nature lovers and those seeking relaxation. Popular for its scenic views and outdoor activities. | Caminhadas e trilhas, Mirantes, Cascatas, Turismo rural, Fazendas históricas |
| Bairro Alto | A charming residential area offering a glimpse into local life with traditional houses and community markets. Great for guests wanting a peaceful yet authentic experience. | Praças e parques locais, Artesanato, Gastronomia típica, Eventos culturais |
| Jardim São Paulo | A tranquil neighborhood with green spaces and local cafes. Perfect for families and travelers looking for a quiet retreat within reach of urban amenities. | Parque Municipal, Cafés e Bistrôs, Feira de artesanato, Caminhadas |
| Parque Ecológico Tuiuti | An ecological park perfect for eco-tourism, offering activities like bird watching and hiking. Attractive for visitors interested in nature and biodiversity. | Trilhas ecológicas, Espaços para piqueniques, Fazendas de atividades, Observação de aves |
| Estrada dos Pinhões | A scenic route known for its natural beauty and rural attractions. Ideal for guests looking for a rural getaway, art, and gastronomy experiences. | Vinícolas, Culinária pivado, Comércio de produtos rurais, Arte local |
| Bairro da Estação | A historical area with a rich railway heritage, bringing in tourists interested in history and culture. An interesting spot for educational perspectives and local stories. | Antiga Estação Ferroviária, Museus, Cafés históricos, Caminhadas pela cidade |
| Vila Tuiuti | A residential area with a friendly atmosphere, popular for short-term rentals due to its community vibe. Guests can enjoy local shops and eateries. | Praças, Feiras de produtos locais, Lugares para comer, Eventos sociais |
Understanding Airbnb License Requirements & STR Laws in Tuiuti (2026)
While Tuiuti, São Paulo, Brazil currently shows low STR regulations, specific Airbnb license requirements might still exist or change. Always verify the latest short term rental regulations and Airbnb license requirements directly with local government authorities for Tuiuti to ensure full compliance before hosting.
(Source: AirROI data, 2026, finding no licensed listings among those analyzed)
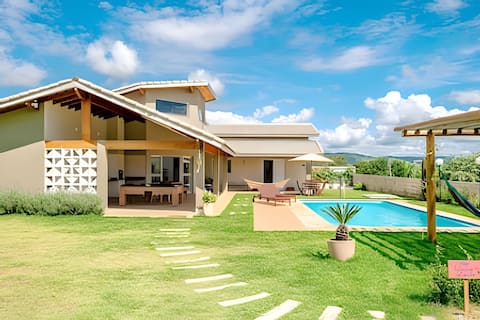
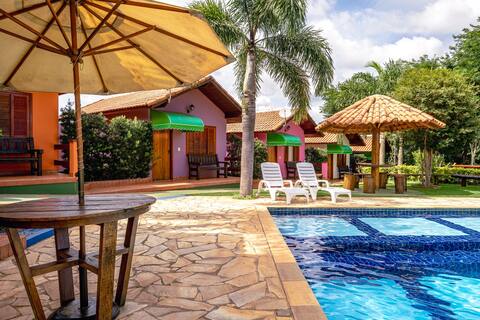
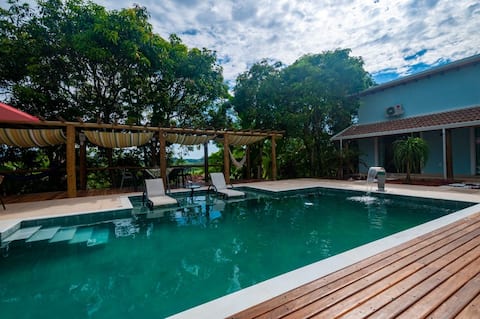
Top Performing Airbnb Properties in Tuiuti (2026)
Benchmark your potential! Explore examples of top-performing Airbnb properties in Tuiutibased on Trailing Twelve Month (TTM) revenue. Analyze their characteristics, revenue, occupancy rate, and ADR to understand what drives success in this market.
Swimming Pool Air Conditioning l PET Friendly l Wifi 341 l 100 km SP
Entire Place • 3 bedrooms
TOP Farmhouse with Mountain VIEWS, PET Friendly
Entire Place • 5 bedrooms

Beautiful house in the SWISS CHALET style
Entire Place • 2 bedrooms

House with incredible VIEWS and LAKE in Bragança Paulista
Entire Place • 2 bedrooms
Amazing country house with beach tennis court!
Entire Place • 6 bedrooms

Charming Farmhouse with Pool and Lakes
Entire Place • 14 bedrooms
Note: Performance varies based on location, size, amenities, seasonality, and management quality. Data reflects the past 12 months.
Top Performing Airbnb Hosts in Tuiuti (2026)
Learn from the best! This table showcases top-performing Airbnb hosts in Tuiuti based on the number of properties managed and estimated total revenue over the past year. Analyze their scale and performance metrics.
| Host Name | Properties | Grossing Revenue | Stay Reviews | Avg Rating |
|---|---|---|---|---|
| Janaina | 2 | $87,153 | 422 | 5.00/5.0 |
| Raquel | 1 | $70,222 | 71 | 4.99/5.0 |
| Rosana | 1 | $55,031 | 71 | 4.97/5.0 |
| Alessandro | 1 | $36,220 | 2 | Not Rated |
| Hélio | 1 | $35,396 | 35 | 4.94/5.0 |
| Ellen Tavares | 1 | $20,595 | 14 | 5.00/5.0 |
| Felipe | 1 | $17,878 | 26 | 5.00/5.0 |
| Luís Fernando | 1 | $11,132 | 45 | 4.98/5.0 |
| Michelly Cristina | 1 | $10,948 | 39 | 4.97/5.0 |
| Edson | 1 | $8,321 | 23 | 4.61/5.0 |
Analyzing the strategies of top hosts, such as their property selection, pricing, and guest communication, can offer valuable lessons for optimizing your own Airbnb operations in Tuiuti.
Dive Deeper: Advanced Tuiuti STR Market Data (2026)
Ready to unlock more insights? AirROI provides access to advanced metrics and comprehensive Airbnb data for Tuiuti. Explore detailed analytics beyond this report to refine your investment strategy, optimize pricing, and maximize your vacation rental profits.
Explore Advanced MetricsTuiuti Short-Term Rental Market Composition (2026): Property & Room Types
Room Type Distribution
Property Type Distribution
Market Composition Insights for Tuiuti
- The Tuiuti Airbnb market composition is heavily skewed towards Entire Home/Apt listings, which make up 94.4% of the 18 active rentals. This indicates strong guest preference for privacy and space.
- Looking at the property type distribution in Tuiuti, House properties are the most common (77.8%), reflecting the local real estate landscape.
- Houses represent a significant 77.8% portion, catering likely to families or larger groups.
Tuiuti Airbnb Room Capacity Analysis (2026): Bedroom Distribution
Distribution of Listings by Number of Bedrooms
Room Capacity Insights for Tuiuti
- The dominant room capacity in Tuiuti is 2 bedrooms listings, making up 33.3% of the market. This suggests a strong demand for properties suitable for couples or solo travelers.
- Together, 2 bedrooms and 5+ bedrooms properties represent 66.6% of the active Airbnb listings in Tuiuti, indicating a high concentration in these sizes.
- A significant 55.5% of listings offer 3+ bedrooms, catering to larger groups and families seeking more space in Tuiuti.
Tuiuti Vacation Rental Guest Capacity Trends (2026)
Distribution of Listings by Guest Capacity
Guest Capacity Insights for Tuiuti
- The most common guest capacity trend in Tuiuti vacation rentals is listings accommodating 8+ guests (66.7%). This suggests the primary traveler segment is likely larger groups.
- Properties designed for 8+ guests and 5 guests dominate the Tuiuti STR market, accounting for 83.4% of listings.
- 72.3% of properties accommodate 6+ guests, serving the market segment for larger families or group travel in Tuiuti.
- On average, properties in Tuiuti are equipped to host 6.8 guests.
Tuiuti Airbnb Booking Patterns (2026): Available vs. Booked Days
Available Days Distribution
Booked Days Distribution
Booking Pattern Insights for Tuiuti
- The most common availability pattern in Tuiuti falls within the 271-366 days range, representing 55.6% of listings. This suggests many properties have significant open periods on their calendars.
- Approximately 77.8% of listings show high availability (181+ days open annually), indicating potential for increased bookings or specific owner usage patterns.
- For booked days, the 1-30 days range is most frequent in Tuiuti (33.3%), reflecting common guest stay durations or potential owner blocking patterns.
- A notable 22.3% of properties secure long booking periods (181+ days booked per year), highlighting successful long-term rental strategies or significant owner usage.
Tuiuti Airbnb Minimum Stay Requirements Analysis
Distribution of Listings by Minimum Night Requirement
1 Night
6 listings
33.3% of total
2 Nights
11 listings
61.1% of total
30+ Nights
1 listings
5.6% of total
Key Insights
- The most prevalent minimum stay requirement in Tuiuti is 2 Nights, adopted by 61.1% of listings. This highlights the market's preference for shorter, flexible bookings.
- A strong majority (94.4%) of the Tuiuti Airbnb data shows acceptance of very short stays (1-2 nights), indicating a dynamic, high-turnover market.
Recommendations
- Align with the market by considering a 2 Nights minimum stay, as 61.1% of Tuiuti hosts use this setting.
- Explore offering discounts for stays of 30+ nights to attract the 5.6% of the market seeking extended stays.
- Adjust minimum nights based on seasonality – potentially shorter during low season and longer during peak demand periods in Tuiuti.
Tuiuti Airbnb Cancellation Policy Trends Analysis (2026)
Flexible
3 listings
16.7% of total
Moderate
7 listings
38.9% of total
Firm
8 listings
44.4% of total
Cancellation Policy Insights for Tuiuti
- The prevailing Airbnb cancellation policy trend in Tuiuti is Firm, used by 44.4% of listings.
- There's a relatively balanced mix between guest-friendly (55.6%) and stricter (44.4%) policies, offering choices for different guest needs.
Recommendations for Hosts
- Consider adopting a Firm policy to align with the 44.4% market standard in Tuiuti.
- Regularly review your cancellation policy against competitors and market demand shifts in Tuiuti.
Tuiuti STR Booking Lead Time Analysis (2026)
Average Booking Lead Time by Month
Booking Lead Time Insights for Tuiuti
- The overall average booking lead time for vacation rentals in Tuiuti is 39 days.
- Guests book furthest in advance for stays during December (average 86 days), likely coinciding with peak travel demand or local events.
- The shortest booking windows occur for stays in June (average 17 days), indicating more last-minute travel plans during this time.
- Seasonally, Winter (57 days avg.) sees the longest lead times, while Summer (22 days avg.) has the shortest, reflecting typical travel planning cycles.
Recommendations for Hosts
- Use the overall average lead time (39 days) as a baseline for your pricing and availability strategy in Tuiuti.
- For December stays, consider implementing length-of-stay discounts or slightly higher rates for bookings made less than 86 days out to capitalize on advance planning.
- Target marketing efforts for the Winter season well in advance (at least 57 days) to capture early planners.
- Monitor your own booking lead times against these Tuiuti averages to identify opportunities for dynamic pricing adjustments.
Popular & Essential Airbnb Amenities in Tuiuti (2026)
Amenity Prevalence
Amenity Insights for Tuiuti
- Essential amenities in Tuiuti that guests expect include: Free parking on premises, Pool, Wifi, Kitchen. Lacking these (any) could significantly impact bookings.
- Popular amenities like Dishes and silverware, BBQ grill, Pets allowed are common but not universal. Offering these can provide a competitive edge.
Recommendations for Hosts
- Ensure your listing includes all essential amenities for Tuiuti: Free parking on premises, Pool, Wifi, Kitchen.
- Consider adding popular differentiators like Dishes and silverware or BBQ grill to increase appeal.
- Highlight unique or less common amenities you offer (e.g., hot tub, dedicated workspace, EV charger) in your listing description and photos.
- Regularly check competitor amenities in Tuiuti to stay competitive.
Tuiuti Airbnb Guest Demographics & Profile Analysis (2026)
Guest Profile Summary for Tuiuti
- The typical guest profile for Airbnb in Tuiuti consists of primarily domestic travelers (97%), often arriving from nearby São Paulo, typically belonging to the Post-2000s (Gen Z/Alpha) group (50%), primarily speaking Portuguese or English.
- Domestic travelers account for 97.2% of guests.
- Key international markets include Brazil (97.2%) and Argentina (0.7%).
- Top languages spoken are Portuguese (54.9%) followed by English (22.5%).
- A significant demographic segment is the Post-2000s (Gen Z/Alpha) group, representing 50% of guests.
Recommendations for Hosts
- Target domestic marketing efforts towards travelers from São Paulo and São Bernardo do Campo.
- Tailor amenities and listing descriptions to appeal to the dominant Post-2000s (Gen Z/Alpha) demographic (e.g., highlight fast WiFi, smart home features, local guides).
- Highlight unique local experiences or amenities relevant to the primary guest profile.
- Consider seasonal promotions aligned with peak travel times for key origin markets.
Nearby Short-Term Rental Market Comparison
How does the Tuiuti Airbnb market stack up against its neighbors? Compare key performance metrics like average monthly revenue, ADR, and occupancy rates in surrounding areas to understand the broader regional STR landscape.
| Market | Active Properties | Monthly Revenue | Daily Rate | Avg. Occupancy |
|---|---|---|---|---|
| Riviera de São Lourenço | 10 | $2,868 | $213.78 | 46% |
| Itupeva | 136 | $1,561 | $225.82 | 28% |
| Morungaba | 31 | $1,435 | $263.39 | 27% |
| Campo Limpo Paulista | 49 | $1,428 | $181.02 | 30% |
| Valinhos | 61 | $1,370 | $176.28 | 33% |
| Itatiba | 171 | $1,331 | $177.58 | 29% |
| Vargem | 48 | $1,319 | $190.42 | 28% |
| Elias Fausto | 13 | $1,296 | $143.78 | 30% |
| Porto Feliz | 69 | $1,279 | $260.86 | 27% |
| Tietê | 14 | $1,245 | $237.69 | 25% |