São Paulo Airbnb Market Analysis 2026: Short Term Rental Data & Vacation Rental Statistics in São Paulo, Brazil
Is Airbnb profitable in São Paulo in 2026? Explore comprehensive Airbnb analytics for São Paulo, São Paulo, Brazil to uncover income potential. This 2026 STR market report for São Paulo, based on AirROI data from February 2025 to January 2026, reveals key trends in the bustling market of 29,129 active listings.
Whether you're considering an Airbnb investment in São Paulo, optimizing your existing vacation rental, or exploring rental arbitrage opportunities, understanding the São Paulo Airbnb data is crucial. Leveraging the low regulation environment is key to maximizing your short term rental income potential. Let's dive into the specifics.
Key São Paulo Airbnb Performance Metrics Overview
Monthly Airbnb Revenue Variations & Income Potential in São Paulo (2026)
Understanding the monthly revenue variations for Airbnb listings in São Paulo is key to maximizing your short term rental income potential. Seasonality significantly impacts earnings. Our analysis, based on data from the past 12 months, shows that the peak revenue month for STRs in São Paulo is typically November, while January often presents the lowest earnings, highlighting opportunities for strategic pricing adjustments during shoulder and low seasons. Explore the typical Airbnb income in São Paulo across different performance tiers:
- Best-in-class properties (Top 10%) achieve $1,470+ monthly, often utilizing dynamic pricing and superior guest experiences.
- Strong performing properties (Top 25%) earn $986 or more, indicating effective management and desirable locations/amenities.
- Typical properties (Median) generate around $597 per month, representing the average market performance.
- Entry-level properties (Bottom 25%) see earnings around $297, often with potential for optimization.
Average Monthly Airbnb Earnings Trend in São Paulo
São Paulo Airbnb Occupancy Rate Trends (2026)
Maximize your bookings by understanding the São Paulo STR occupancy trends. Seasonal demand shifts significantly influence how often properties are booked. Typically, Marchsees the highest demand (peak season occupancy), while January experiences the lowest (low season). Effective strategies, like adjusting minimum stays or offering promotions, can boost occupancy during slower periods. Here's how different property tiers perform in São Paulo:
- Best-in-class properties (Top 10%) achieve 83%+ occupancy, indicating high desirability and potentially optimized availability.
- Strong performing properties (Top 25%) maintain 67% or higher occupancy, suggesting good market fit and guest satisfaction.
- Typical properties (Median) have an occupancy rate around 45%.
- Entry-level properties (Bottom 25%) average 23% occupancy, potentially facing higher vacancy.
Average Monthly Occupancy Rate Trend in São Paulo
Average Daily Rate (ADR) Airbnb Trends in São Paulo (2026)
Effective short term rental pricing strategy in São Paulo involves understanding monthly ADR fluctuations. The Average Daily Rate (ADR) for Airbnb in São Paulo typically peaks in November and dips lowest during February. Leveraging Airbnb dynamic pricing tools or strategies based on this seasonality can significantly boost revenue. Here's a look at the typical nightly rates achieved:
- Best-in-class properties (Top 10%) command rates of $89+ per night, often due to premium features or locations.
- Strong performing properties (Top 25%) achieve nightly rates of $62 or more.
- Typical properties (Median) charge around $45 per night.
- Entry-level properties (Bottom 25%) earn around $34 per night.
Average Daily Rate (ADR) Trend by Month in São Paulo
Get Live São Paulo Market Intelligence 👇

Explore Real-time Analytics
Airbnb Seasonality Analysis & Trends in São Paulo (2026)
Peak Season (November, October, March)
- Revenue averages $861 per month
- Occupancy rates average 48.9%
- Daily rates average $60
Shoulder Season
- Revenue averages $757 per month
- Occupancy maintains around 45.6%
- Daily rates hold near $58
Low Season (January, February, May)
- Revenue drops to average $651 per month
- Occupancy decreases to average 42.2%
- Daily rates adjust to average $56
Seasonality Insights for São Paulo
- The Airbnb seasonality in São Paulo shows moderate seasonality with distinct peak and low periods. While the sections above show seasonal averages, it's also insightful to look at the extremes:
- During the high season, the absolute peak month showcases São Paulo's highest earning potential, with monthly revenues capable of climbing to $958, occupancy reaching a high of 52.2%, and ADRs peaking at $65.
- Conversely, the slowest single month of the year, typically falling within the low season, marks the market's lowest point. In this month, revenue might dip to $627, occupancy could drop to 36.3%, and ADRs may adjust down to $51.
- Understanding both the seasonal averages and these monthly peaks and troughs in revenue, occupancy, and ADR is crucial for maximizing your Airbnb profit potential in São Paulo.
Seasonal Strategies for Maximizing Profit
- Peak Season: Maximize revenue through premium pricing and potentially longer minimum stays. Ensure high availability.
- Low Season: Offer competitive pricing, special promotions (e.g., extended stay discounts), and flexible cancellation policies. Target off-season travelers like remote workers or budget-conscious guests.
- Shoulder Seasons: Implement dynamic pricing that balances peak and low rates. Target weekend travelers or specific events. Offer slightly more flexible terms than peak season.
- Regularly analyze your own performance against these São Paulo seasonality benchmarks and adjust your pricing and availability strategy accordingly.
Best Areas for Airbnb Investment in São Paulo (2026)
Exploring the top neighborhoods for short-term rentals in São Paulo? This section highlights key areas, outlining why they are attractive for hosts and guests, along with notable local attractions. Consider these locations based on your target guest profile and investment strategy.
| Neighborhood / Area | Why Host Here? (Target Guests & Appeal) | Key Attractions & Landmarks |
|---|---|---|
| Jardins | Upscale neighborhood known for its luxury boutiques, fine dining restaurants, and cultural attractions. Ideal for tourists seeking a sophisticated urban experience and close proximity to parks and nightlife. | Avenida Paulista, Ibirapuera Park, São Paulo Museum of Art, Shopping Pátio Higienópolis, Rua Oscar Freire |
| Vila Madalena | Artistic and bohemian neighborhood famous for its vibrant street art and nightlife. Popular with young travelers and those seeking a lively atmosphere filled with bars and restaurants. | Beco do Batman, Vila Madalena nightlife, Casa de Cultura Vila Madalena, street art tours, local craft shops |
| Centro | The historic downtown of São Paulo, full of cultural landmarks, museums, and business activity. Attractive for tourists interested in history and architecture. | Municipal Market of São Paulo, São Paulo Cathedral, Theatro Municipal, Pinacoteca do Estado de São Paulo, Edifício Copan |
| Pinheiros | Trendy neighborhood known for its culinary scene, bars, and vibrant culture. Attracts both locals and tourists looking for a mix of dining and nightlife. | Praça Benedito Calixto, feira de antiguidades, Rua dos Três Irmãos, Cinemateca Brasileira, Vila Butantan |
| Brooklin | Modern area with a mix of residential and corporate spaces. Ideal for business travelers due to its proximity to major offices and convention centers. | Berrini Avenue, Shopping Market Place, Morumbi Shopping, Ibirapuera Park, WTC Business Center |
| Moema | Charming and residential area with easy access to Ibirapuera Park. Great for families and those looking for a quieter stay close to activities. | Ibirapuera Park, Shopping Ibirapuera, Moema restaurants, Cinemas, Aeroporto de Congonhas |
| Lapa | Known for its lively nightlife and cultural scene. Popular with visitors seeking entertainment and a taste of local music and arts. | Arcos da Lapa, Selvagem Club, Circo Voador, Teatro Odisséia, local bars and samba clubs |
| Santana | Residential area with a large park and family-friendly atmosphere. Attractive for those seeking a more local experience away from typical tourist spots. | Horto Florestal, Parque da Juventude, Santana shopping centers, local markets, cultural festivals |
Understanding Airbnb License Requirements & STR Laws in São Paulo (2026)
While São Paulo, São Paulo, Brazil currently shows low STR regulations, specific Airbnb license requirements might still exist or change. Always verify the latest short term rental regulations and Airbnb license requirements directly with local government authorities for São Paulo to ensure full compliance before hosting.
(Source: AirROI data, 2026, based on 0% licensed listings)
Top Performing Airbnb Properties in São Paulo (2026)
Benchmark your potential! Explore examples of top-performing Airbnb properties in São Paulobased on Trailing Twelve Month (TTM) revenue. Analyze their characteristics, revenue, occupancy rate, and ADR to understand what drives success in this market.
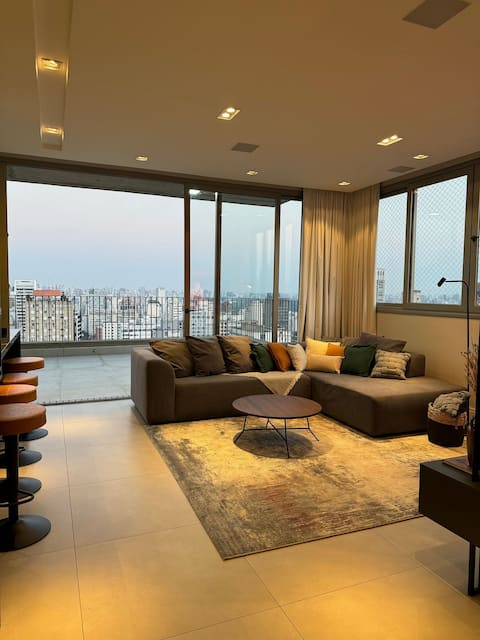
Cobertura located in the best region of São Paulo
Entire Place • 2 bedrooms
High standard house 1000m2-15p with cook/cleaning
Entire Place • 8 bedrooms
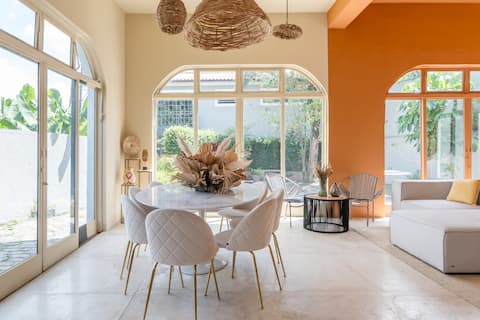
Jardim Paulista New Designer Ultra Modern
Entire Place • 3 bedrooms

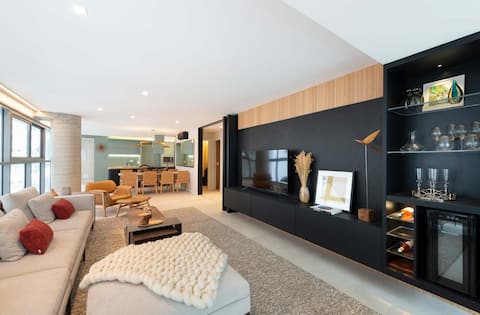
2 bedroom apartment near São Paulo
Entire Place • 2 bedrooms

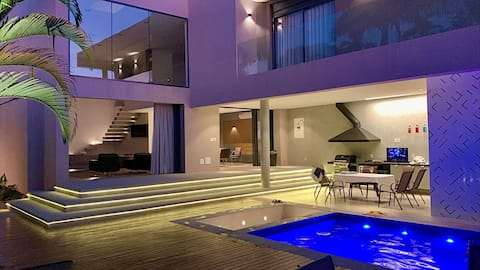
Wonderful House - Resort in São Paulo
Entire Place • 5 bedrooms
New house, complete, total leisure
Entire Place • 3 bedrooms
Note: Performance varies based on location, size, amenities, seasonality, and management quality. Data reflects the past 12 months.
Top Performing Airbnb Hosts in São Paulo (2026)
Learn from the best! This table showcases top-performing Airbnb hosts in São Paulo based on the number of properties managed and estimated total revenue over the past year. Analyze their scale and performance metrics.
| Host Name | Properties | Grossing Revenue | Stay Reviews | Avg Rating |
|---|---|---|---|---|
| Tabas | 384 | $2,581,413 | 4511 | 4.30/5.0 |
| Cyclinn Locações Por Temporada | 130 | $2,198,804 | 11942 | 4.84/5.0 |
| Rafaela - Easy Star | 214 | $1,931,229 | 12222 | 4.77/5.0 |
| Gustavo | 232 | $1,908,586 | 11637 | 4.72/5.0 |
| Conviva Stay | 326 | $1,785,109 | 5258 | 4.53/5.0 |
| Débora | 129 | $1,424,297 | 5128 | 4.78/5.0 |
| Agência Meu Anfitrião | 203 | $1,328,930 | 3543 | 4.53/5.0 |
| Bluehaus | 86 | $1,323,088 | 5547 | 4.80/5.0 |
| Priscilla | 176 | $1,321,441 | 23915 | 4.64/5.0 |
| Isabella | 121 | $1,293,708 | 5331 | 4.91/5.0 |
Analyzing the strategies of top hosts, such as their property selection, pricing, and guest communication, can offer valuable lessons for optimizing your own Airbnb operations in São Paulo.
Dive Deeper: Advanced São Paulo STR Market Data (2026)
Ready to unlock more insights? AirROI provides access to advanced metrics and comprehensive Airbnb data for São Paulo. Explore detailed analytics beyond this report to refine your investment strategy, optimize pricing, and maximize your vacation rental profits.
Explore Advanced MetricsSão Paulo Short-Term Rental Market Composition (2026): Property & Room Types
Room Type Distribution
Property Type Distribution
Market Composition Insights for São Paulo
- The São Paulo Airbnb market composition is heavily skewed towards Entire Home/Apt listings, which make up 88.4% of the 29,129 active rentals. This indicates strong guest preference for privacy and space.
- Looking at the property type distribution in São Paulo, Apartment/Condo properties are the most common (87.8%), reflecting the local real estate landscape.
- Smaller segments like hotel/boutique, others (combined 3.5%) offer potential for unique stay experiences.
São Paulo Airbnb Room Capacity Analysis (2026): Bedroom Distribution
Distribution of Listings by Number of Bedrooms
Room Capacity Insights for São Paulo
- The dominant room capacity in São Paulo is 1 bedroom listings, making up 71% of the market. This suggests a strong demand for properties suitable for couples or solo travelers.
- Together, 1 bedroom and 2 bedrooms properties represent 82.2% of the active Airbnb listings in São Paulo, indicating a high concentration in these sizes.
- With over half the market (71%) consisting of studios or 1-bedroom units, São Paulo is particularly well-suited for individuals or couples.
- Listings with 3+ bedrooms (2.9%) represent a smaller niche, potentially indicating an underserved market for larger group accommodations in São Paulo.
São Paulo Vacation Rental Guest Capacity Trends (2026)
Distribution of Listings by Guest Capacity
Guest Capacity Insights for São Paulo
- The most common guest capacity trend in São Paulo vacation rentals is listings accommodating 2 guests (48.9%). This suggests the primary traveler segment is likely couples or solo travelers.
- Properties designed for 2 guests and 4 guests dominate the São Paulo STR market, accounting for 67.2% of listings.
- A significant 50.3% of listings cater specifically to 1-2 guests, highlighting strong demand from couples and solo travelers in São Paulo.
- Listings for large groups (6+ guests) are relatively rare (4.9%), potentially indicating an opportunity for hosts targeting this segment in São Paulo.
- On average, properties in São Paulo are equipped to host 2.7 guests.
São Paulo Airbnb Booking Patterns (2026): Available vs. Booked Days
Available Days Distribution
Booked Days Distribution
Booking Pattern Insights for São Paulo
- The most common availability pattern in São Paulo falls within the 271-366 days range, representing 43.7% of listings. This suggests many properties have significant open periods on their calendars.
- Approximately 75.5% of listings show high availability (181+ days open annually), indicating potential for increased bookings or specific owner usage patterns.
- For booked days, the 91-180 days range is most frequent in São Paulo (32.4%), reflecting common guest stay durations or potential owner blocking patterns.
- A notable 25.6% of properties secure long booking periods (181+ days booked per year), highlighting successful long-term rental strategies or significant owner usage.
São Paulo Airbnb Minimum Stay Requirements Analysis
Distribution of Listings by Minimum Night Requirement
1 Night
11936 listings
41% of total
2 Nights
6125 listings
21% of total
3 Nights
1245 listings
4.3% of total
4-6 Nights
1052 listings
3.6% of total
7-29 Nights
1022 listings
3.5% of total
30+ Nights
7746 listings
26.6% of total
Key Insights
- The most prevalent minimum stay requirement in São Paulo is 1 Night, adopted by 41% of listings. This highlights the market's preference for shorter, flexible bookings.
- A strong majority (62.0%) of the São Paulo Airbnb data shows acceptance of very short stays (1-2 nights), indicating a dynamic, high-turnover market.
- A significant segment (26.6%) caters to monthly stays (30+ nights) in São Paulo, pointing to opportunities in the extended-stay market.
Recommendations
- Align with the market by considering a 1 Night minimum stay, as 41% of São Paulo hosts use this setting.
- Explore offering discounts for stays of 30+ nights to attract the 26.6% of the market seeking extended stays.
- Adjust minimum nights based on seasonality – potentially shorter during low season and longer during peak demand periods in São Paulo.
São Paulo Airbnb Cancellation Policy Trends Analysis (2026)
Super Strict 60 Days
231 listings
0.8% of total
Limited
382 listings
1.3% of total
Super Strict 30 Days
197 listings
0.7% of total
Refundable
2 listings
0% of total
Non-refundable
5 listings
0% of total
Flexible
10281 listings
35.4% of total
Moderate
9415 listings
32.4% of total
Firm
6326 listings
21.8% of total
Strict
2223 listings
7.6% of total
Cancellation Policy Insights for São Paulo
- The prevailing Airbnb cancellation policy trend in São Paulo is Flexible, used by 35.4% of listings.
- There's a relatively balanced mix between guest-friendly (67.8%) and stricter (29.4%) policies, offering choices for different guest needs.
- Strict cancellation policies are quite rare (7.6%), potentially making listings with this policy less competitive unless justified by high demand or property type.
Recommendations for Hosts
- Consider adopting a Flexible policy to align with the 35.4% market standard in São Paulo.
- Using a Strict policy might deter some guests, as only 7.6% of listings use it. Evaluate if potential revenue protection outweighs possible lower booking rates.
- Regularly review your cancellation policy against competitors and market demand shifts in São Paulo.
São Paulo STR Booking Lead Time Analysis (2026)
Average Booking Lead Time by Month
Booking Lead Time Insights for São Paulo
- The overall average booking lead time for vacation rentals in São Paulo is 23 days.
- Guests book furthest in advance for stays during November (average 37 days), likely coinciding with peak travel demand or local events.
- The shortest booking windows occur for stays in February (average 16 days), indicating more last-minute travel plans during this time.
- Seasonally, Fall (28 days avg.) sees the longest lead times, while Spring (20 days avg.) has the shortest, reflecting typical travel planning cycles.
Recommendations for Hosts
- Use the overall average lead time (23 days) as a baseline for your pricing and availability strategy in São Paulo.
- For November stays, consider implementing length-of-stay discounts or slightly higher rates for bookings made less than 37 days out to capitalize on advance planning.
- Target marketing efforts for the Fall season well in advance (at least 28 days) to capture early planners.
- Monitor your own booking lead times against these São Paulo averages to identify opportunities for dynamic pricing adjustments.
Popular & Essential Airbnb Amenities in São Paulo (2026)
Amenity Prevalence
Amenity Insights for São Paulo
- Essential amenities in São Paulo that guests expect include: Wifi. Lacking these (this) could significantly impact bookings.
- Popular amenities like TV, Kitchen, Hot water are common but not universal. Offering these can provide a competitive edge.
Recommendations for Hosts
- Ensure your listing includes all essential amenities for São Paulo: Wifi.
- Prioritize adding missing essentials: Wifi.
- Consider adding popular differentiators like TV or Kitchen to increase appeal.
- Highlight unique or less common amenities you offer (e.g., hot tub, dedicated workspace, EV charger) in your listing description and photos.
- Regularly check competitor amenities in São Paulo to stay competitive.
São Paulo Airbnb Guest Demographics & Profile Analysis (2026)
Guest Profile Summary for São Paulo
- The typical guest profile for Airbnb in São Paulo consists of primarily domestic travelers (86%), often arriving from nearby São Paulo, typically belonging to the Post-2000s (Gen Z/Alpha) group (50%), primarily speaking Portuguese or English.
- Domestic travelers account for 85.8% of guests.
- Key international markets include Brazil (85.8%) and United States (3.7%).
- Top languages spoken are Portuguese (40.7%) followed by English (32.5%).
- A significant demographic segment is the Post-2000s (Gen Z/Alpha) group, representing 50% of guests.
Recommendations for Hosts
- Target domestic marketing efforts towards travelers from São Paulo and Rio de Janeiro.
- Tailor amenities and listing descriptions to appeal to the dominant Post-2000s (Gen Z/Alpha) demographic (e.g., highlight fast WiFi, smart home features, local guides).
- Highlight unique local experiences or amenities relevant to the primary guest profile.
- Consider seasonal promotions aligned with peak travel times for key origin markets.
Nearby Short-Term Rental Market Comparison
How does the São Paulo Airbnb market stack up against its neighbors? Compare key performance metrics like average monthly revenue, ADR, and occupancy rates in surrounding areas to understand the broader regional STR landscape.
| Market | Active Properties | Monthly Revenue | Daily Rate | Avg. Occupancy |
|---|---|---|---|---|
| Riviera de São Lourenço | 10 | $2,868 | $213.78 | 46% |
| Tuiuti | 18 | $1,686 | $156.45 | 30% |
| Itupeva | 136 | $1,561 | $225.82 | 28% |
| Morungaba | 31 | $1,435 | $263.39 | 27% |
| Campo Limpo Paulista | 49 | $1,428 | $181.02 | 30% |
| Valinhos | 61 | $1,370 | $176.28 | 33% |
| Itatiba | 171 | $1,331 | $177.58 | 29% |
| Vargem | 48 | $1,319 | $190.42 | 28% |
| Elias Fausto | 13 | $1,296 | $143.78 | 30% |
| Porto Feliz | 69 | $1,279 | $260.86 | 27% |