São Bernardo do Campo Airbnb Market Analysis 2026: Short Term Rental Data & Vacation Rental Statistics in São Paulo, Brazil
Is Airbnb profitable in São Bernardo do Campo in 2026? Explore comprehensive Airbnb analytics for São Bernardo do Campo, São Paulo, Brazil to uncover income potential. This 2026 STR market report for São Bernardo do Campo, based on AirROI data from February 2025 to January 2026, reveals key trends in the niche market of 192 active listings.
Whether you're considering an Airbnb investment in São Bernardo do Campo, optimizing your existing vacation rental, or exploring rental arbitrage opportunities, understanding the São Bernardo do Campo Airbnb data is crucial. Leveraging the low regulation environment is key to maximizing your short term rental income potential. Let's dive into the specifics.
Key São Bernardo do Campo Airbnb Performance Metrics Overview
Monthly Airbnb Revenue Variations & Income Potential in São Bernardo do Campo (2026)
Understanding the monthly revenue variations for Airbnb listings in São Bernardo do Campo is key to maximizing your short term rental income potential. Seasonality significantly impacts earnings. Our analysis, based on data from the past 12 months, shows that the peak revenue month for STRs in São Bernardo do Campo is typically December, while February often presents the lowest earnings, highlighting opportunities for strategic pricing adjustments during shoulder and low seasons. Explore the typical Airbnb income in São Bernardo do Campo across different performance tiers:
- Best-in-class properties (Top 10%) achieve $1,520+ monthly, often utilizing dynamic pricing and superior guest experiences.
- Strong performing properties (Top 25%) earn $862 or more, indicating effective management and desirable locations/amenities.
- Typical properties (Median) generate around $459 per month, representing the average market performance.
- Entry-level properties (Bottom 25%) see earnings around $186, often with potential for optimization.
Average Monthly Airbnb Earnings Trend in São Bernardo do Campo
São Bernardo do Campo Airbnb Occupancy Rate Trends (2026)
Maximize your bookings by understanding the São Bernardo do Campo STR occupancy trends. Seasonal demand shifts significantly influence how often properties are booked. Typically, Julysees the highest demand (peak season occupancy), while January experiences the lowest (low season). Effective strategies, like adjusting minimum stays or offering promotions, can boost occupancy during slower periods. Here's how different property tiers perform in São Bernardo do Campo:
- Best-in-class properties (Top 10%) achieve 81%+ occupancy, indicating high desirability and potentially optimized availability.
- Strong performing properties (Top 25%) maintain 63% or higher occupancy, suggesting good market fit and guest satisfaction.
- Typical properties (Median) have an occupancy rate around 39%.
- Entry-level properties (Bottom 25%) average 19% occupancy, potentially facing higher vacancy.
Average Monthly Occupancy Rate Trend in São Bernardo do Campo
Average Daily Rate (ADR) Airbnb Trends in São Bernardo do Campo (2026)
Effective short term rental pricing strategy in São Bernardo do Campo involves understanding monthly ADR fluctuations. The Average Daily Rate (ADR) for Airbnb in São Bernardo do Campo typically peaks in December and dips lowest during February. Leveraging Airbnb dynamic pricing tools or strategies based on this seasonality can significantly boost revenue. Here's a look at the typical nightly rates achieved:
- Best-in-class properties (Top 10%) command rates of $86+ per night, often due to premium features or locations.
- Strong performing properties (Top 25%) achieve nightly rates of $51 or more.
- Typical properties (Median) charge around $34 per night.
- Entry-level properties (Bottom 25%) earn around $21 per night.
Average Daily Rate (ADR) Trend by Month in São Bernardo do Campo
Get Live São Bernardo do Campo Market Intelligence 👇

Explore Real-time Analytics
Airbnb Seasonality Analysis & Trends in São Bernardo do Campo (2026)
Peak Season (December, September, October)
- Revenue averages $826 per month
- Occupancy rates average 42.3%
- Daily rates average $55
Shoulder Season
- Revenue averages $704 per month
- Occupancy maintains around 41.3%
- Daily rates hold near $50
Low Season (February, April, August)
- Revenue drops to average $608 per month
- Occupancy decreases to average 43.0%
- Daily rates adjust to average $46
Seasonality Insights for São Bernardo do Campo
- The Airbnb seasonality in São Bernardo do Campo shows moderate seasonality with distinct peak and low periods. While the sections above show seasonal averages, it's also insightful to look at the extremes:
- During the high season, the absolute peak month showcases São Bernardo do Campo's highest earning potential, with monthly revenues capable of climbing to $937, occupancy reaching a high of 45.9%, and ADRs peaking at $58.
- Conversely, the slowest single month of the year, typically falling within the low season, marks the market's lowest point. In this month, revenue might dip to $577, occupancy could drop to 36.5%, and ADRs may adjust down to $44.
- Understanding both the seasonal averages and these monthly peaks and troughs in revenue, occupancy, and ADR is crucial for maximizing your Airbnb profit potential in São Bernardo do Campo.
Seasonal Strategies for Maximizing Profit
- Peak Season: Maximize revenue through premium pricing and potentially longer minimum stays. Ensure high availability.
- Low Season: Offer competitive pricing, special promotions (e.g., extended stay discounts), and flexible cancellation policies. Target off-season travelers like remote workers or budget-conscious guests.
- Shoulder Seasons: Implement dynamic pricing that balances peak and low rates. Target weekend travelers or specific events. Offer slightly more flexible terms than peak season.
- Regularly analyze your own performance against these São Bernardo do Campo seasonality benchmarks and adjust your pricing and availability strategy accordingly.
Best Areas for Airbnb Investment in São Bernardo do Campo (2026)
Exploring the top neighborhoods for short-term rentals in São Bernardo do Campo? This section highlights key areas, outlining why they are attractive for hosts and guests, along with notable local attractions. Consider these locations based on your target guest profile and investment strategy.
| Neighborhood / Area | Why Host Here? (Target Guests & Appeal) | Key Attractions & Landmarks |
|---|---|---|
| Vila São Pedro | A family-friendly neighborhood with parks and schools, making it ideal for vacationing families and longer stays. | Parque Estadual da Serra do Mar, Shopping Metrópole, Centro Histórico de São Bernardo, Parque dos Pássaros, Catedral de São Bernardo do Campo |
| Centro | The downtown area with a variety of shops, restaurants, and cultural attractions. Perfect for guests looking for convenience and easy access to public transport. | Vila de São Bernardo, Praça dos Cidadãos, Museu do Transporte Público, Teatro Lauro Gomes, Shopping São Bernardo Plaza |
| Rudge Ramos | A vibrant area known for its energetic nightlife and entertainment options. Attracts young crowds and those looking for a dynamic atmosphere. | Clube de Regatas São Bernardo, Casa de Cultura de São Bernardo, Rudge Ramos Shopping, Parque Rudge Ramos, Cervejaria Cidadã |
| Baeta Neves | A quiet and residential neighborhood that offers good schools and parks, suitable for family stays. | Parque Baeta Neves, Parque Natural Municipal da Serra do Mar, Shopping Metropolitano, Praça dos Três Poderes, Igreja São Bernando |
| Jardim do Mar | A scenic area with beautiful homes and beach-like ambiance, highly rated for leisure and relaxation. | Praia de Jardim do Mar, Parque Municipal da Estação da Luz, Restaurantes à beira-mar, Praça da Paz, Caminho dos Pescadores |
| Planalto | Residential neighborhood that offers easy access to commercial areas and is great for both short and extended stays | Parque Natural Municipal, Planalto Shopping, Igreja de São João Batista, Feirinha do Planalto, Praça do Planalto |
| Jardim das Flores | Known for its local charm and community vibe, this area attracts those looking for peace and local experiences during their stays. | Parque Jardim das Flores, Feira Livre, Igreja São Benedito, Praça da Liberdade, Caminho das Flores |
| Alto da Boa Vista | Offers stunning views and a mix of nature and urban living, making it popular for those seeking a tranquil escape from the city bustle. | Mirante do Alto da Boa Vista, Parque da Lagoa da Boa Vista, Caminhada na Serra, Café Mirante, Pontos turísticos locais |
Understanding Airbnb License Requirements & STR Laws in São Bernardo do Campo (2026)
While São Bernardo do Campo, São Paulo, Brazil currently shows low STR regulations, specific Airbnb license requirements might still exist or change. Always verify the latest short term rental regulations and Airbnb license requirements directly with local government authorities for São Bernardo do Campo to ensure full compliance before hosting.
(Source: AirROI data, 2026, finding no licensed listings among those analyzed)
Top Performing Airbnb Properties in São Bernardo do Campo (2026)
Benchmark your potential! Explore examples of top-performing Airbnb properties in São Bernardo do Campobased on Trailing Twelve Month (TTM) revenue. Analyze their characteristics, revenue, occupancy rate, and ADR to understand what drives success in this market.

Dutch Charm Villa
Entire Place • 10 bedrooms

Farm | Dam | Condominium | Serra do Mar | 4 Houses
Entire Place • 7 bedrooms

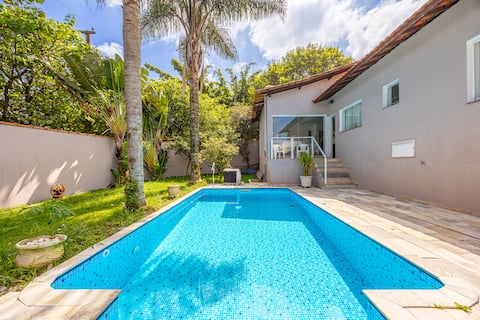
House with pool in ABC Next to Saopauloexpo
Entire Place • 3 bedrooms

farmhouse for seasons and weekends. SBC
Entire Place • 5 bedrooms
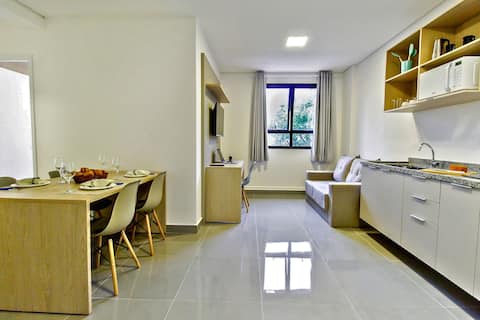
Family Apartment | Pool + Parking + AC and Full Leisure
Entire Place • 2 bedrooms
Casa Espaçosa with pool and gourmet area
Entire Place • 4 bedrooms
Note: Performance varies based on location, size, amenities, seasonality, and management quality. Data reflects the past 12 months.
Top Performing Airbnb Hosts in São Bernardo do Campo (2026)
Learn from the best! This table showcases top-performing Airbnb hosts in São Bernardo do Campo based on the number of properties managed and estimated total revenue over the past year. Analyze their scale and performance metrics.
| Host Name | Properties | Grossing Revenue | Stay Reviews | Avg Rating |
|---|---|---|---|---|
| Victor | 15 | $162,643 | 265 | 4.81/5.0 |
| João | 1 | $95,713 | 84 | 4.87/5.0 |
| Fernando V | 4 | $64,806 | 178 | 4.36/5.0 |
| Rodrigo | 5 | $45,466 | 105 | 4.87/5.0 |
| Marcio | 6 | $38,576 | 366 | 4.89/5.0 |
| Rafael | 15 | $36,088 | 176 | 4.96/5.0 |
| Thais | 1 | $32,890 | 64 | 4.97/5.0 |
| Andreia | 1 | $25,884 | 47 | 4.87/5.0 |
| Rafael | 3 | $23,615 | 102 | 4.55/5.0 |
| Kennya | 5 | $23,062 | 145 | 4.92/5.0 |
Analyzing the strategies of top hosts, such as their property selection, pricing, and guest communication, can offer valuable lessons for optimizing your own Airbnb operations in São Bernardo do Campo.
Dive Deeper: Advanced São Bernardo do Campo STR Market Data (2026)
Ready to unlock more insights? AirROI provides access to advanced metrics and comprehensive Airbnb data for São Bernardo do Campo. Explore detailed analytics beyond this report to refine your investment strategy, optimize pricing, and maximize your vacation rental profits.
Explore Advanced MetricsSão Bernardo do Campo Short-Term Rental Market Composition (2026): Property & Room Types
Room Type Distribution
Property Type Distribution
Market Composition Insights for São Bernardo do Campo
- The São Bernardo do Campo Airbnb market composition is heavily skewed towards Entire Home/Apt listings, which make up 76% of the 192 active rentals. This indicates strong guest preference for privacy and space.
- Looking at the property type distribution in São Bernardo do Campo, Apartment/Condo properties are the most common (58.9%), reflecting the local real estate landscape.
- Houses represent a significant 34.4% portion, catering likely to families or larger groups.
- The presence of 5.7% Hotel/Boutique listings indicates integration with traditional hospitality.
- Smaller segments like others (combined 1.0%) offer potential for unique stay experiences.
São Bernardo do Campo Airbnb Room Capacity Analysis (2026): Bedroom Distribution
Distribution of Listings by Number of Bedrooms
Room Capacity Insights for São Bernardo do Campo
- The dominant room capacity in São Bernardo do Campo is 1 bedroom listings, making up 46.4% of the market. This suggests a strong demand for properties suitable for couples or solo travelers.
- Together, 1 bedroom and 2 bedrooms properties represent 69.3% of the active Airbnb listings in São Bernardo do Campo, indicating a high concentration in these sizes.
São Bernardo do Campo Vacation Rental Guest Capacity Trends (2026)
Distribution of Listings by Guest Capacity
Guest Capacity Insights for São Bernardo do Campo
- The most common guest capacity trend in São Bernardo do Campo vacation rentals is listings accommodating 2 guests (28.1%). This suggests the primary traveler segment is likely couples or solo travelers.
- Properties designed for 2 guests and 4 guests dominate the São Bernardo do Campo STR market, accounting for 44.2% of listings.
- 17.7% of properties accommodate 6+ guests, serving the market segment for larger families or group travel in São Bernardo do Campo.
- On average, properties in São Bernardo do Campo are equipped to host 3.1 guests.
São Bernardo do Campo Airbnb Booking Patterns (2026): Available vs. Booked Days
Available Days Distribution
Booked Days Distribution
Booking Pattern Insights for São Bernardo do Campo
- The most common availability pattern in São Bernardo do Campo falls within the 271-366 days range, representing 46.9% of listings. This suggests many properties have significant open periods on their calendars.
- Approximately 83.4% of listings show high availability (181+ days open annually), indicating potential for increased bookings or specific owner usage patterns.
- For booked days, the 91-180 days range is most frequent in São Bernardo do Campo (38%), reflecting common guest stay durations or potential owner blocking patterns.
- A notable 17.1% of properties secure long booking periods (181+ days booked per year), highlighting successful long-term rental strategies or significant owner usage.
São Bernardo do Campo Airbnb Minimum Stay Requirements Analysis
Distribution of Listings by Minimum Night Requirement
1 Night
62 listings
32.3% of total
2 Nights
33 listings
17.2% of total
3 Nights
20 listings
10.4% of total
4-6 Nights
5 listings
2.6% of total
7-29 Nights
18 listings
9.4% of total
30+ Nights
54 listings
28.1% of total
Key Insights
- The most prevalent minimum stay requirement in São Bernardo do Campo is 1 Night, adopted by 32.3% of listings. This highlights the market's preference for shorter, flexible bookings.
- A significant segment (28.1%) caters to monthly stays (30+ nights) in São Bernardo do Campo, pointing to opportunities in the extended-stay market.
Recommendations
- Align with the market by considering a 1 Night minimum stay, as 32.3% of São Bernardo do Campo hosts use this setting.
- Explore offering discounts for stays of 30+ nights to attract the 28.1% of the market seeking extended stays.
- Adjust minimum nights based on seasonality – potentially shorter during low season and longer during peak demand periods in São Bernardo do Campo.
São Bernardo do Campo Airbnb Cancellation Policy Trends Analysis (2026)
Limited
3 listings
1.6% of total
Flexible
69 listings
35.9% of total
Moderate
36 listings
18.8% of total
Firm
60 listings
31.3% of total
Strict
24 listings
12.5% of total
Cancellation Policy Insights for São Bernardo do Campo
- The prevailing Airbnb cancellation policy trend in São Bernardo do Campo is Flexible, used by 35.9% of listings.
- There's a relatively balanced mix between guest-friendly (54.7%) and stricter (43.8%) policies, offering choices for different guest needs.
Recommendations for Hosts
- Consider adopting a Flexible policy to align with the 35.9% market standard in São Bernardo do Campo.
- Using a Strict policy might deter some guests, as only 12.5% of listings use it. Evaluate if potential revenue protection outweighs possible lower booking rates.
- Regularly review your cancellation policy against competitors and market demand shifts in São Bernardo do Campo.
São Bernardo do Campo STR Booking Lead Time Analysis (2026)
Average Booking Lead Time by Month
Booking Lead Time Insights for São Bernardo do Campo
- The overall average booking lead time for vacation rentals in São Bernardo do Campo is 18 days.
- Guests book furthest in advance for stays during December (average 27 days), likely coinciding with peak travel demand or local events.
- The shortest booking windows occur for stays in May (average 13 days), indicating more last-minute travel plans during this time.
- Seasonally, Winter (19 days avg.) sees the longest lead times, while Spring (15 days avg.) has the shortest, reflecting typical travel planning cycles.
Recommendations for Hosts
- Use the overall average lead time (18 days) as a baseline for your pricing and availability strategy in São Bernardo do Campo.
- Target marketing efforts for the Winter season well in advance (at least 19 days) to capture early planners.
- Monitor your own booking lead times against these São Bernardo do Campo averages to identify opportunities for dynamic pricing adjustments.
Popular & Essential Airbnb Amenities in São Bernardo do Campo (2026)
Amenity Prevalence
Amenity Insights for São Bernardo do Campo
- Essential amenities in São Bernardo do Campo that guests expect include: Wifi. Lacking these (this) could significantly impact bookings.
- Popular amenities like Kitchen, TV, Dishes and silverware are common but not universal. Offering these can provide a competitive edge.
Recommendations for Hosts
- Ensure your listing includes all essential amenities for São Bernardo do Campo: Wifi.
- Prioritize adding missing essentials: Wifi.
- Consider adding popular differentiators like Kitchen or TV to increase appeal.
- Highlight unique or less common amenities you offer (e.g., hot tub, dedicated workspace, EV charger) in your listing description and photos.
- Regularly check competitor amenities in São Bernardo do Campo to stay competitive.
São Bernardo do Campo Airbnb Guest Demographics & Profile Analysis (2026)
Guest Profile Summary for São Bernardo do Campo
- The typical guest profile for Airbnb in São Bernardo do Campo consists of primarily domestic travelers (87%), often arriving from nearby São Paulo, typically belonging to the Post-2000s (Gen Z/Alpha) group (50%), primarily speaking Portuguese or English.
- Domestic travelers account for 87.4% of guests.
- Key international markets include Brazil (87.4%) and Netherlands (3.3%).
- Top languages spoken are Portuguese (44.9%) followed by English (28.3%).
- A significant demographic segment is the Post-2000s (Gen Z/Alpha) group, representing 50% of guests.
Recommendations for Hosts
- Target domestic marketing efforts towards travelers from São Paulo and Rio de Janeiro.
- Tailor amenities and listing descriptions to appeal to the dominant Post-2000s (Gen Z/Alpha) demographic (e.g., highlight fast WiFi, smart home features, local guides).
- Highlight unique local experiences or amenities relevant to the primary guest profile.
- Consider seasonal promotions aligned with peak travel times for key origin markets.
Nearby Short-Term Rental Market Comparison
How does the São Bernardo do Campo Airbnb market stack up against its neighbors? Compare key performance metrics like average monthly revenue, ADR, and occupancy rates in surrounding areas to understand the broader regional STR landscape.
| Market | Active Properties | Monthly Revenue | Daily Rate | Avg. Occupancy |
|---|---|---|---|---|
| Riviera de São Lourenço | 10 | $2,868 | $213.78 | 46% |
| Tuiuti | 18 | $1,686 | $156.45 | 30% |
| Itupeva | 136 | $1,561 | $225.82 | 28% |
| Morungaba | 31 | $1,435 | $263.39 | 27% |
| Campo Limpo Paulista | 49 | $1,428 | $181.02 | 30% |
| Valinhos | 61 | $1,370 | $176.28 | 33% |
| Itatiba | 171 | $1,331 | $177.58 | 29% |
| Vargem | 48 | $1,319 | $190.42 | 28% |
| Elias Fausto | 13 | $1,296 | $143.78 | 30% |
| Porto Feliz | 69 | $1,279 | $260.86 | 27% |