Sorocaba Airbnb Market Analysis 2026: Short Term Rental Data & Vacation Rental Statistics in São Paulo, Brazil
Is Airbnb profitable in Sorocaba in 2026? Explore comprehensive Airbnb analytics for Sorocaba, São Paulo, Brazil to uncover income potential. This 2026 STR market report for Sorocaba, based on AirROI data from February 2025 to January 2026, reveals key trends in the market of 571 active listings.
Whether you're considering an Airbnb investment in Sorocaba, optimizing your existing vacation rental, or exploring rental arbitrage opportunities, understanding the Sorocaba Airbnb data is crucial. Leveraging the low regulation environment is key to maximizing your short term rental income potential. Let's dive into the specifics.
Key Sorocaba Airbnb Performance Metrics Overview
Monthly Airbnb Revenue Variations & Income Potential in Sorocaba (2026)
Understanding the monthly revenue variations for Airbnb listings in Sorocaba is key to maximizing your short term rental income potential. Seasonality significantly impacts earnings. Our analysis, based on data from the past 12 months, shows that the peak revenue month for STRs in Sorocaba is typically December, while May often presents the lowest earnings, highlighting opportunities for strategic pricing adjustments during shoulder and low seasons. Explore the typical Airbnb income in Sorocaba across different performance tiers:
- Best-in-class properties (Top 10%) achieve $1,100+ monthly, often utilizing dynamic pricing and superior guest experiences.
- Strong performing properties (Top 25%) earn $688 or more, indicating effective management and desirable locations/amenities.
- Typical properties (Median) generate around $383 per month, representing the average market performance.
- Entry-level properties (Bottom 25%) see earnings around $179, often with potential for optimization.
Average Monthly Airbnb Earnings Trend in Sorocaba
Sorocaba Airbnb Occupancy Rate Trends (2026)
Maximize your bookings by understanding the Sorocaba STR occupancy trends. Seasonal demand shifts significantly influence how often properties are booked. Typically, Februarysees the highest demand (peak season occupancy), while January experiences the lowest (low season). Effective strategies, like adjusting minimum stays or offering promotions, can boost occupancy during slower periods. Here's how different property tiers perform in Sorocaba:
- Best-in-class properties (Top 10%) achieve 78%+ occupancy, indicating high desirability and potentially optimized availability.
- Strong performing properties (Top 25%) maintain 59% or higher occupancy, suggesting good market fit and guest satisfaction.
- Typical properties (Median) have an occupancy rate around 35%.
- Entry-level properties (Bottom 25%) average 17% occupancy, potentially facing higher vacancy.
Average Monthly Occupancy Rate Trend in Sorocaba
Average Daily Rate (ADR) Airbnb Trends in Sorocaba (2026)
Effective short term rental pricing strategy in Sorocaba involves understanding monthly ADR fluctuations. The Average Daily Rate (ADR) for Airbnb in Sorocaba typically peaks in December and dips lowest during February. Leveraging Airbnb dynamic pricing tools or strategies based on this seasonality can significantly boost revenue. Here's a look at the typical nightly rates achieved:
- Best-in-class properties (Top 10%) command rates of $95+ per night, often due to premium features or locations.
- Strong performing properties (Top 25%) achieve nightly rates of $45 or more.
- Typical properties (Median) charge around $31 per night.
- Entry-level properties (Bottom 25%) earn around $21 per night.
Average Daily Rate (ADR) Trend by Month in Sorocaba
Get Live Sorocaba Market Intelligence 👇

Explore Real-time Analytics
Airbnb Seasonality Analysis & Trends in Sorocaba (2026)
Peak Season (December, October, January)
- Revenue averages $714 per month
- Occupancy rates average 37.5%
- Daily rates average $56
Shoulder Season
- Revenue averages $536 per month
- Occupancy maintains around 42.2%
- Daily rates hold near $49
Low Season (May, June, August)
- Revenue drops to average $442 per month
- Occupancy decreases to average 36.0%
- Daily rates adjust to average $48
Seasonality Insights for Sorocaba
- The Airbnb seasonality in Sorocaba shows highly seasonal trends requiring careful strategy. While the sections above show seasonal averages, it's also insightful to look at the extremes:
- During the high season, the absolute peak month showcases Sorocaba's highest earning potential, with monthly revenues capable of climbing to $831, occupancy reaching a high of 47.6%, and ADRs peaking at $57.
- Conversely, the slowest single month of the year, typically falling within the low season, marks the market's lowest point. In this month, revenue might dip to $408, occupancy could drop to 32.6%, and ADRs may adjust down to $45.
- Understanding both the seasonal averages and these monthly peaks and troughs in revenue, occupancy, and ADR is crucial for maximizing your Airbnb profit potential in Sorocaba.
Seasonal Strategies for Maximizing Profit
- Peak Season: Maximize revenue through premium pricing and potentially longer minimum stays. Ensure high availability.
- Low Season: Offer competitive pricing, special promotions (e.g., extended stay discounts), and flexible cancellation policies. Target off-season travelers like remote workers or budget-conscious guests.
- Shoulder Seasons: Implement dynamic pricing that balances peak and low rates. Target weekend travelers or specific events. Offer slightly more flexible terms than peak season.
- Regularly analyze your own performance against these Sorocaba seasonality benchmarks and adjust your pricing and availability strategy accordingly.
Best Areas for Airbnb Investment in Sorocaba (2026)
Exploring the top neighborhoods for short-term rentals in Sorocaba? This section highlights key areas, outlining why they are attractive for hosts and guests, along with notable local attractions. Consider these locations based on your target guest profile and investment strategy.
| Neighborhood / Area | Why Host Here? (Target Guests & Appeal) | Key Attractions & Landmarks |
|---|---|---|
| Centro | The vibrant heart of Sorocaba known for its rich history and cultural attractions. Perfect for guests looking to explore local shops, dining, and nightlife. | Sorocaba Historical Museum, Parque Carlos Alberto de Souza, Igreja de São Bento, Catedral Metropolitana de Sorocaba, Shopping Center Iguatemi Sorocaba |
| Campolim | A high-end neighborhood famous for its upscale shops and restaurants. Ideal for those looking for a luxurious stay in Sorocaba. | Parque Natural Municipal de Sorocaba, Shopping Pátio Cianê, Cinemark Sorocaba, Igreja Matriz de Nossa Senhora da Ponte, Clube de Campo de Sorocaba |
| Vila Hortência | A well-established neighborhood known for its family-friendly atmosphere and green parks. Attracts families and those seeking a more relaxed environment. | Parque Vicente Pallotti, Igreja de São Francisco, Supermercados e comércios locais, Praça da Bandeira, Feira Municipal de Sorocaba |
| Éden | A delightful residential neighborhood favored by families and expats. Offers peaceful surroundings with easy access to local amenities. | Parque das Águas, Escola de Educação Infantil, Igreja de São Judas Tadeu, Pontos de ônibus para o centro |
| Jardim das Laranjeiras | A popular area for locals, featuring parks and great recreational facilities. Appeals to active guests looking for outdoor activities. | Parque das Laranjeiras, Pista de caminhada, Praça Europa, Igreja de São Pio X, Centros de yoga |
| Ipanema | A newer neighborhood known for its residential developments and proximity to nature, perfect for guests who enjoy tranquility and outdoor activities. | Parque da Água Vidas, Vistas verdes, Igreja Batista de Sorocaba, Mercado Municipal de Sorocaba, Centros de recreação |
| Sorocaba's Industrial District | A strategic location attracting business travelers and those involved in regional trade. High demand for short-term stays during weekdays. | Empresas locais, Parques industriais, Acessos rápidos a rodovias, Espaços para eventos, Restaurantes de negócios |
| Habitacional Vila Liana | A residential area known for its affordability and community vibe, appealing to budget travelers and long-term visitors. | Praças comunitárias, Supermercados próximos, Igreja Evangélica, Feiras de fim de semana, Parques infantis |
Understanding Airbnb License Requirements & STR Laws in Sorocaba (2026)
While Sorocaba, São Paulo, Brazil currently shows low STR regulations, specific Airbnb license requirements might still exist or change. Always verify the latest short term rental regulations and Airbnb license requirements directly with local government authorities for Sorocaba to ensure full compliance before hosting.
(Source: AirROI data, 2026, based on 0% licensed listings)
Top Performing Airbnb Properties in Sorocaba (2026)
Benchmark your potential! Explore examples of top-performing Airbnb properties in Sorocababased on Trailing Twelve Month (TTM) revenue. Analyze their characteristics, revenue, occupancy rate, and ADR to understand what drives success in this market.

Beautiful place in Sorocaba!
Entire Place • 7 bedrooms

Luxury Home w/ Pool & Beach Tennis in Condominium
Entire Place • 4 bedrooms

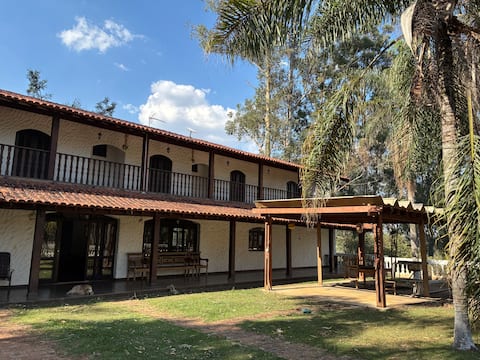
Country House near SP - Sorocaba
Entire Place • 6 bedrooms

Recanto Jacuzzi Sorocaba - Complete house with pool
Entire Place • 5 bedrooms
Place in Sorocaba, in the midst of nature. Quiet.
Entire Place • 6 bedrooms

With Heated Pool. Up to 35 people, negotiable.
Entire Place • 4 bedrooms
Note: Performance varies based on location, size, amenities, seasonality, and management quality. Data reflects the past 12 months.
Top Performing Airbnb Hosts in Sorocaba (2026)
Learn from the best! This table showcases top-performing Airbnb hosts in Sorocaba based on the number of properties managed and estimated total revenue over the past year. Analyze their scale and performance metrics.
| Host Name | Properties | Grossing Revenue | Stay Reviews | Avg Rating |
|---|---|---|---|---|
| Atlas Prime Stay | 24 | $143,412 | 1161 | 4.81/5.0 |
| Eva | 11 | $138,886 | 1191 | 4.96/5.0 |
| Isabela | 1 | $88,282 | 43 | 5.00/5.0 |
| Raimundo | 13 | $75,450 | 326 | 4.90/5.0 |
| Maria Fernanda | 1 | $67,842 | 20 | 5.00/5.0 |
| Isabela | 15 | $58,524 | 507 | 4.88/5.0 |
| Marcos | 9 | $44,848 | 440 | 4.92/5.0 |
| Flat 14 | 9 | $33,035 | 420 | 4.86/5.0 |
| Cesar | 10 | $32,688 | 626 | 4.84/5.0 |
| Stela | 9 | $32,513 | 205 | 4.85/5.0 |
Analyzing the strategies of top hosts, such as their property selection, pricing, and guest communication, can offer valuable lessons for optimizing your own Airbnb operations in Sorocaba.
Dive Deeper: Advanced Sorocaba STR Market Data (2026)
Ready to unlock more insights? AirROI provides access to advanced metrics and comprehensive Airbnb data for Sorocaba. Explore detailed analytics beyond this report to refine your investment strategy, optimize pricing, and maximize your vacation rental profits.
Explore Advanced MetricsSorocaba Short-Term Rental Market Composition (2026): Property & Room Types
Room Type Distribution
Property Type Distribution
Market Composition Insights for Sorocaba
- The Sorocaba Airbnb market composition is heavily skewed towards Entire Home/Apt listings, which make up 85.5% of the 571 active rentals. This indicates strong guest preference for privacy and space.
- Looking at the property type distribution in Sorocaba, Apartment/Condo properties are the most common (57.4%), reflecting the local real estate landscape.
- Houses represent a significant 35.9% portion, catering likely to families or larger groups.
- The presence of 6% Hotel/Boutique listings indicates integration with traditional hospitality.
- Smaller segments like others, outdoor/unique (combined 0.8%) offer potential for unique stay experiences.
Sorocaba Airbnb Room Capacity Analysis (2026): Bedroom Distribution
Distribution of Listings by Number of Bedrooms
Room Capacity Insights for Sorocaba
- The dominant room capacity in Sorocaba is 1 bedroom listings, making up 42.9% of the market. This suggests a strong demand for properties suitable for couples or solo travelers.
- Together, 1 bedroom and 2 bedrooms properties represent 76.0% of the active Airbnb listings in Sorocaba, indicating a high concentration in these sizes.
Sorocaba Vacation Rental Guest Capacity Trends (2026)
Distribution of Listings by Guest Capacity
Guest Capacity Insights for Sorocaba
- The most common guest capacity trend in Sorocaba vacation rentals is listings accommodating 2 guests (28%). This suggests the primary traveler segment is likely couples or solo travelers.
- Properties designed for 2 guests and 4 guests dominate the Sorocaba STR market, accounting for 49.2% of listings.
- 19.1% of properties accommodate 6+ guests, serving the market segment for larger families or group travel in Sorocaba.
- On average, properties in Sorocaba are equipped to host 3.5 guests.
Sorocaba Airbnb Booking Patterns (2026): Available vs. Booked Days
Available Days Distribution
Booked Days Distribution
Booking Pattern Insights for Sorocaba
- The most common availability pattern in Sorocaba falls within the 271-366 days range, representing 53.1% of listings. This suggests many properties have significant open periods on their calendars.
- Approximately 83.9% of listings show high availability (181+ days open annually), indicating potential for increased bookings or specific owner usage patterns.
- For booked days, the 91-180 days range is most frequent in Sorocaba (31.2%), reflecting common guest stay durations or potential owner blocking patterns.
- A notable 17.3% of properties secure long booking periods (181+ days booked per year), highlighting successful long-term rental strategies or significant owner usage.
Sorocaba Airbnb Minimum Stay Requirements Analysis
Distribution of Listings by Minimum Night Requirement
1 Night
193 listings
33.8% of total
2 Nights
122 listings
21.4% of total
3 Nights
43 listings
7.5% of total
4-6 Nights
54 listings
9.5% of total
7-29 Nights
33 listings
5.8% of total
30+ Nights
126 listings
22.1% of total
Key Insights
- The most prevalent minimum stay requirement in Sorocaba is 1 Night, adopted by 33.8% of listings. This highlights the market's preference for shorter, flexible bookings.
- A significant segment (22.1%) caters to monthly stays (30+ nights) in Sorocaba, pointing to opportunities in the extended-stay market.
Recommendations
- Align with the market by considering a 1 Night minimum stay, as 33.8% of Sorocaba hosts use this setting.
- Explore offering discounts for stays of 30+ nights to attract the 22.1% of the market seeking extended stays.
- Adjust minimum nights based on seasonality – potentially shorter during low season and longer during peak demand periods in Sorocaba.
Sorocaba Airbnb Cancellation Policy Trends Analysis (2026)
Limited
7 listings
1.2% of total
Super Strict 60 Days
2 listings
0.4% of total
Flexible
173 listings
30.3% of total
Moderate
212 listings
37.1% of total
Firm
140 listings
24.5% of total
Strict
37 listings
6.5% of total
Cancellation Policy Insights for Sorocaba
- The prevailing Airbnb cancellation policy trend in Sorocaba is Moderate, used by 37.1% of listings.
- There's a relatively balanced mix between guest-friendly (67.4%) and stricter (31.0%) policies, offering choices for different guest needs.
- Strict cancellation policies are quite rare (6.5%), potentially making listings with this policy less competitive unless justified by high demand or property type.
Recommendations for Hosts
- Consider adopting a Moderate policy to align with the 37.1% market standard in Sorocaba.
- Using a Strict policy might deter some guests, as only 6.5% of listings use it. Evaluate if potential revenue protection outweighs possible lower booking rates.
- Regularly review your cancellation policy against competitors and market demand shifts in Sorocaba.
Sorocaba STR Booking Lead Time Analysis (2026)
Average Booking Lead Time by Month
Booking Lead Time Insights for Sorocaba
- The overall average booking lead time for vacation rentals in Sorocaba is 24 days.
- Guests book furthest in advance for stays during October (average 61 days), likely coinciding with peak travel demand or local events.
- The shortest booking windows occur for stays in September (average 12 days), indicating more last-minute travel plans during this time.
- Seasonally, Fall (31 days avg.) sees the longest lead times, while Spring (15 days avg.) has the shortest, reflecting typical travel planning cycles.
Recommendations for Hosts
- Use the overall average lead time (24 days) as a baseline for your pricing and availability strategy in Sorocaba.
- For October stays, consider implementing length-of-stay discounts or slightly higher rates for bookings made less than 61 days out to capitalize on advance planning.
- During September, focus on last-minute booking availability and promotions, as guests book with very short notice (12 days avg.).
- Target marketing efforts for the Fall season well in advance (at least 31 days) to capture early planners.
- Monitor your own booking lead times against these Sorocaba averages to identify opportunities for dynamic pricing adjustments.
Popular & Essential Airbnb Amenities in Sorocaba (2026)
Amenity Prevalence
Amenity Insights for Sorocaba
- Essential amenities in Sorocaba that guests expect include: Wifi. Lacking these (this) could significantly impact bookings.
- Popular amenities like Kitchen, TV, Free parking on premises are common but not universal. Offering these can provide a competitive edge.
Recommendations for Hosts
- Ensure your listing includes all essential amenities for Sorocaba: Wifi.
- Prioritize adding missing essentials: Wifi.
- Consider adding popular differentiators like Kitchen or TV to increase appeal.
- Highlight unique or less common amenities you offer (e.g., hot tub, dedicated workspace, EV charger) in your listing description and photos.
- Regularly check competitor amenities in Sorocaba to stay competitive.
Sorocaba Airbnb Guest Demographics & Profile Analysis (2026)
Guest Profile Summary for Sorocaba
- The typical guest profile for Airbnb in Sorocaba consists of primarily domestic travelers (93%), often arriving from nearby São Paulo, typically belonging to the Post-2000s (Gen Z/Alpha) group (50%), primarily speaking Portuguese or English.
- Domestic travelers account for 93.2% of guests.
- Key international markets include Brazil (93.2%) and United States (1.5%).
- Top languages spoken are Portuguese (46.7%) followed by English (29.8%).
- A significant demographic segment is the Post-2000s (Gen Z/Alpha) group, representing 50% of guests.
Recommendations for Hosts
- Target domestic marketing efforts towards travelers from São Paulo and Sorocaba.
- Tailor amenities and listing descriptions to appeal to the dominant Post-2000s (Gen Z/Alpha) demographic (e.g., highlight fast WiFi, smart home features, local guides).
- Highlight unique local experiences or amenities relevant to the primary guest profile.
- Consider seasonal promotions aligned with peak travel times for key origin markets.
Nearby Short-Term Rental Market Comparison
How does the Sorocaba Airbnb market stack up against its neighbors? Compare key performance metrics like average monthly revenue, ADR, and occupancy rates in surrounding areas to understand the broader regional STR landscape.
| Market | Active Properties | Monthly Revenue | Daily Rate | Avg. Occupancy |
|---|---|---|---|---|
| Riviera de São Lourenço | 10 | $2,868 | $213.78 | 46% |
| Tuiuti | 18 | $1,686 | $156.45 | 30% |
| Itupeva | 136 | $1,561 | $225.82 | 28% |
| Morungaba | 31 | $1,435 | $263.39 | 27% |
| Campo Limpo Paulista | 49 | $1,428 | $181.02 | 30% |
| Valinhos | 61 | $1,370 | $176.28 | 33% |
| Itatiba | 171 | $1,331 | $177.58 | 29% |
| Vargem | 48 | $1,319 | $190.42 | 28% |
| Elias Fausto | 13 | $1,296 | $143.78 | 30% |
| Porto Feliz | 69 | $1,279 | $260.86 | 27% |