Serra Negra Airbnb Market Analysis 2026: Short Term Rental Data & Vacation Rental Statistics in São Paulo, Brazil
Is Airbnb profitable in Serra Negra in 2026? Explore comprehensive Airbnb analytics for Serra Negra, São Paulo, Brazil to uncover income potential. This 2026 STR market report for Serra Negra, based on AirROI data from February 2025 to January 2026, reveals key trends in the market of 482 active listings.
Whether you're considering an Airbnb investment in Serra Negra, optimizing your existing vacation rental, or exploring rental arbitrage opportunities, understanding the Serra Negra Airbnb data is crucial. Leveraging the low regulation environment is key to maximizing your short term rental income potential. Let's dive into the specifics.
Key Serra Negra Airbnb Performance Metrics Overview
Monthly Airbnb Revenue Variations & Income Potential in Serra Negra (2026)
Understanding the monthly revenue variations for Airbnb listings in Serra Negra is key to maximizing your short term rental income potential. Seasonality significantly impacts earnings. Our analysis, based on data from the past 12 months, shows that the peak revenue month for STRs in Serra Negra is typically December, while February often presents the lowest earnings, highlighting opportunities for strategic pricing adjustments during shoulder and low seasons. Explore the typical Airbnb income in Serra Negra across different performance tiers:
- Best-in-class properties (Top 10%) achieve $1,812+ monthly, often utilizing dynamic pricing and superior guest experiences.
- Strong performing properties (Top 25%) earn $1,023 or more, indicating effective management and desirable locations/amenities.
- Typical properties (Median) generate around $564 per month, representing the average market performance.
- Entry-level properties (Bottom 25%) see earnings around $264, often with potential for optimization.
Average Monthly Airbnb Earnings Trend in Serra Negra
Serra Negra Airbnb Occupancy Rate Trends (2026)
Maximize your bookings by understanding the Serra Negra STR occupancy trends. Seasonal demand shifts significantly influence how often properties are booked. Typically, Julysees the highest demand (peak season occupancy), while January experiences the lowest (low season). Effective strategies, like adjusting minimum stays or offering promotions, can boost occupancy during slower periods. Here's how different property tiers perform in Serra Negra:
- Best-in-class properties (Top 10%) achieve 68%+ occupancy, indicating high desirability and potentially optimized availability.
- Strong performing properties (Top 25%) maintain 47% or higher occupancy, suggesting good market fit and guest satisfaction.
- Typical properties (Median) have an occupancy rate around 28%.
- Entry-level properties (Bottom 25%) average 14% occupancy, potentially facing higher vacancy.
Average Monthly Occupancy Rate Trend in Serra Negra
Average Daily Rate (ADR) Airbnb Trends in Serra Negra (2026)
Effective short term rental pricing strategy in Serra Negra involves understanding monthly ADR fluctuations. The Average Daily Rate (ADR) for Airbnb in Serra Negra typically peaks in December and dips lowest during April. Leveraging Airbnb dynamic pricing tools or strategies based on this seasonality can significantly boost revenue. Here's a look at the typical nightly rates achieved:
- Best-in-class properties (Top 10%) command rates of $148+ per night, often due to premium features or locations.
- Strong performing properties (Top 25%) achieve nightly rates of $99 or more.
- Typical properties (Median) charge around $64 per night.
- Entry-level properties (Bottom 25%) earn around $47 per night.
Average Daily Rate (ADR) Trend by Month in Serra Negra
Get Live Serra Negra Market Intelligence 👇

Explore Real-time Analytics
Airbnb Seasonality Analysis & Trends in Serra Negra (2026)
Peak Season (December, July, January)
- Revenue averages $1,012 per month
- Occupancy rates average 35.1%
- Daily rates average $90
Shoulder Season
- Revenue averages $771 per month
- Occupancy maintains around 31.8%
- Daily rates hold near $80
Low Season (February, April, September)
- Revenue drops to average $700 per month
- Occupancy decreases to average 31.0%
- Daily rates adjust to average $78
Seasonality Insights for Serra Negra
- The Airbnb seasonality in Serra Negra shows moderate seasonality with distinct peak and low periods. While the sections above show seasonal averages, it's also insightful to look at the extremes:
- During the high season, the absolute peak month showcases Serra Negra's highest earning potential, with monthly revenues capable of climbing to $1,113, occupancy reaching a high of 44.2%, and ADRs peaking at $96.
- Conversely, the slowest single month of the year, typically falling within the low season, marks the market's lowest point. In this month, revenue might dip to $678, occupancy could drop to 27.6%, and ADRs may adjust down to $75.
- Understanding both the seasonal averages and these monthly peaks and troughs in revenue, occupancy, and ADR is crucial for maximizing your Airbnb profit potential in Serra Negra.
Seasonal Strategies for Maximizing Profit
- Peak Season: Maximize revenue through premium pricing and potentially longer minimum stays. Ensure high availability.
- Low Season: Offer competitive pricing, special promotions (e.g., extended stay discounts), and flexible cancellation policies. Target off-season travelers like remote workers or budget-conscious guests.
- Shoulder Seasons: Implement dynamic pricing that balances peak and low rates. Target weekend travelers or specific events. Offer slightly more flexible terms than peak season.
- Regularly analyze your own performance against these Serra Negra seasonality benchmarks and adjust your pricing and availability strategy accordingly.
Best Areas for Airbnb Investment in Serra Negra (2026)
Exploring the top neighborhoods for short-term rentals in Serra Negra? This section highlights key areas, outlining why they are attractive for hosts and guests, along with notable local attractions. Consider these locations based on your target guest profile and investment strategy.
| Neighborhood / Area | Why Host Here? (Target Guests & Appeal) | Key Attractions & Landmarks |
|---|---|---|
| Centro | The bustling heart of Serra Negra, filled with shops, restaurants, and local culture. Ideal for guests who want to be close to city amenities and attractions. | Matriz de Nossa Senhora do Perpétuo Socorro, Pico do Fonseca, Serra Negra Park, Cascata do Evaristo, Riacho das Pedras |
| Vila Figueiredo | A charming neighborhood surrounded by nature, perfect for guests seeking tranquility while still being near the town center. Great for families and nature lovers. | Cristo Redentor, Horto Florestal, Águas de São Pedro, Trilha da Pedra do Baú, Mirante do Cristo |
| Lagoa do Araujo | Known for its scenic lake and recreational opportunities, this area attracts visitors looking for outdoor activities and natural beauty. | Lagoa do Araujo, Caminhada da Lagoa, Praça da Lagoa, Picnic Spots, Bird Watching |
| Parque Rua do Ouro | A serene park area frequented by locals and tourists alike. Offers a peaceful retreat with access to hiking trails and picnic spots. | Parque Natural da Rua do Ouro, Trilhas Ecólogicas, Ponto de Observação da Natureza, Espaço para Eventos, Parquinho para Crianças |
| São Francisco | A picturesque district known for its colonial architecture and historic significance. Offers a unique perspective on Serra Negra's history. | Igreja de São Francisco, Praça do São Francisco, Museu da Cidade, Vinhas do São Francisco, Casa da Cultura |
| São João | A welcoming neighborhood that provides an authentic experience of local life, perfect for guests wanting to connect with the culture and community. | Festa de São João, Mercado Municipal, Pracinha do São João, Parque de Diversões, Eventos Culturais |
| Serra Negra Mountain | This area is popular for those who enjoy mountain activities and incredible views. Great for adventure seekers and nature enthusiasts. | Trilhas para caminhadas, Mirantes, Escaladas, Piqueniques nas montanhas, Excursões de natureza |
| Rural Serra Negra | The rural part of Serra Negra offers a tranquil escape, featuring farms and sustainability experiences. Ideal for guests looking to unwind from city life. | Visitas a Fazendas, Turismo rural, Degustação de produtos locais, Atividades ao ar livre, Caminhadas por trilhas rurais |
Understanding Airbnb License Requirements & STR Laws in Serra Negra (2026)
While Serra Negra, São Paulo, Brazil currently shows low STR regulations, specific Airbnb license requirements might still exist or change. Always verify the latest short term rental regulations and Airbnb license requirements directly with local government authorities for Serra Negra to ensure full compliance before hosting.
(Source: AirROI data, 2026, based on 0% licensed listings)
Top Performing Airbnb Properties in Serra Negra (2026)
Benchmark your potential! Explore examples of top-performing Airbnb properties in Serra Negrabased on Trailing Twelve Month (TTM) revenue. Analyze their characteristics, revenue, occupancy rate, and ADR to understand what drives success in this market.

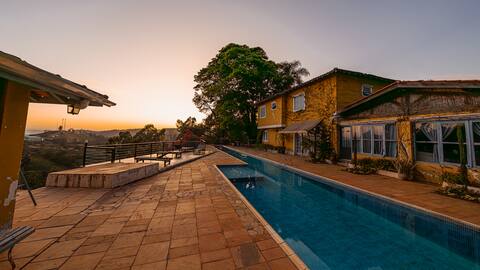
AgroRancho Farmhouse in Serra Negra - 20 people
Entire Place • 6 bedrooms

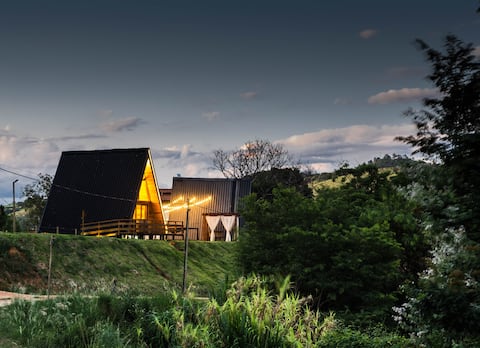
Boutique Cabin - Heated Pool & Breakfast
Entire Place • 1 bedroom

Casa Vista - Heated pool and breakfast
Entire Place • 1 bedroom
Jardineto Ranch - Serra Negra
Entire Place • 7 bedrooms

Cabanas do Morro - View of Serra da Mantiqueira
Private Room • 1 bedroom
Amazing cabin with exclusive cinema and hot tub
Entire Place • 1 bedroom
Note: Performance varies based on location, size, amenities, seasonality, and management quality. Data reflects the past 12 months.
Top Performing Airbnb Hosts in Serra Negra (2026)
Learn from the best! This table showcases top-performing Airbnb hosts in Serra Negra based on the number of properties managed and estimated total revenue over the past year. Analyze their scale and performance metrics.
| Host Name | Properties | Grossing Revenue | Stay Reviews | Avg Rating |
|---|---|---|---|---|
| Ariel | 12 | $168,565 | 1166 | 4.82/5.0 |
| Michelle | 8 | $146,366 | 204 | 4.98/5.0 |
| Pousada Ar Da Montanha | 14 | $139,058 | 622 | 4.81/5.0 |
| Reserva Mantiqueira | 2 | $122,977 | 64 | 5.00/5.0 |
| Marcos Possagnolo | 3 | $121,591 | 295 | 5.00/5.0 |
| Diogo | 14 | $88,904 | 598 | 4.93/5.0 |
| Evandro | 3 | $83,464 | 484 | 4.89/5.0 |
| Maria Isabella | 5 | $61,420 | 178 | 4.90/5.0 |
| Silvia Maris Macera | 7 | $57,660 | 871 | 4.98/5.0 |
| Vue Hospedagens | 5 | $56,604 | 84 | 4.91/5.0 |
Analyzing the strategies of top hosts, such as their property selection, pricing, and guest communication, can offer valuable lessons for optimizing your own Airbnb operations in Serra Negra.
Dive Deeper: Advanced Serra Negra STR Market Data (2026)
Ready to unlock more insights? AirROI provides access to advanced metrics and comprehensive Airbnb data for Serra Negra. Explore detailed analytics beyond this report to refine your investment strategy, optimize pricing, and maximize your vacation rental profits.
Explore Advanced MetricsSerra Negra Short-Term Rental Market Composition (2026): Property & Room Types
Room Type Distribution
Property Type Distribution
Market Composition Insights for Serra Negra
- The Serra Negra Airbnb market composition is heavily skewed towards Entire Home/Apt listings, which make up 91.3% of the 482 active rentals. This indicates strong guest preference for privacy and space.
- Looking at the property type distribution in Serra Negra, House properties are the most common (47.3%), reflecting the local real estate landscape.
- Houses represent a significant 47.3% portion, catering likely to families or larger groups.
- The presence of 7.7% Hotel/Boutique listings indicates integration with traditional hospitality.
- Smaller segments like outdoor/unique, others, unique stays (combined 4.3%) offer potential for unique stay experiences.
Serra Negra Airbnb Room Capacity Analysis (2026): Bedroom Distribution
Distribution of Listings by Number of Bedrooms
Room Capacity Insights for Serra Negra
- The dominant room capacity in Serra Negra is 1 bedroom listings, making up 33.6% of the market. This suggests a strong demand for properties suitable for couples or solo travelers.
- Together, 1 bedroom and 2 bedrooms properties represent 63.3% of the active Airbnb listings in Serra Negra, indicating a high concentration in these sizes.
- A significant 29.4% of listings offer 3+ bedrooms, catering to larger groups and families seeking more space in Serra Negra.
Serra Negra Vacation Rental Guest Capacity Trends (2026)
Distribution of Listings by Guest Capacity
Guest Capacity Insights for Serra Negra
- The most common guest capacity trend in Serra Negra vacation rentals is listings accommodating 8+ guests (24.7%). This suggests the primary traveler segment is likely larger groups.
- Properties designed for 8+ guests and 4 guests dominate the Serra Negra STR market, accounting for 44.0% of listings.
- 44.6% of properties accommodate 6+ guests, serving the market segment for larger families or group travel in Serra Negra.
- On average, properties in Serra Negra are equipped to host 4.9 guests.
Serra Negra Airbnb Booking Patterns (2026): Available vs. Booked Days
Available Days Distribution
Booked Days Distribution
Booking Pattern Insights for Serra Negra
- The most common availability pattern in Serra Negra falls within the 271-366 days range, representing 61.2% of listings. This suggests many properties have significant open periods on their calendars.
- Approximately 87.5% of listings show high availability (181+ days open annually), indicating potential for increased bookings or specific owner usage patterns.
- For booked days, the 31-90 days range is most frequent in Serra Negra (37.3%), reflecting common guest stay durations or potential owner blocking patterns.
- A notable 12.9% of properties secure long booking periods (181+ days booked per year), highlighting successful long-term rental strategies or significant owner usage.
Serra Negra Airbnb Minimum Stay Requirements Analysis
Distribution of Listings by Minimum Night Requirement
1 Night
141 listings
29.3% of total
2 Nights
179 listings
37.1% of total
3 Nights
10 listings
2.1% of total
4-6 Nights
2 listings
0.4% of total
7-29 Nights
2 listings
0.4% of total
30+ Nights
148 listings
30.7% of total
Key Insights
- The most prevalent minimum stay requirement in Serra Negra is 2 Nights, adopted by 37.1% of listings. This highlights the market's preference for shorter, flexible bookings.
- A strong majority (66.4%) of the Serra Negra Airbnb data shows acceptance of very short stays (1-2 nights), indicating a dynamic, high-turnover market.
- A significant segment (30.7%) caters to monthly stays (30+ nights) in Serra Negra, pointing to opportunities in the extended-stay market.
Recommendations
- Align with the market by considering a 2 Nights minimum stay, as 37.1% of Serra Negra hosts use this setting.
- If feasible, allowing 1-night stays, especially midweek or during low season, could capture last-minute bookings, as only 29.3% currently do.
- Explore offering discounts for stays of 30+ nights to attract the 30.7% of the market seeking extended stays.
- Adjust minimum nights based on seasonality – potentially shorter during low season and longer during peak demand periods in Serra Negra.
Serra Negra Airbnb Cancellation Policy Trends Analysis (2026)
Super Strict 30 Days
27 listings
5.6% of total
Limited
14 listings
2.9% of total
Flexible
143 listings
29.8% of total
Moderate
146 listings
30.4% of total
Firm
119 listings
24.8% of total
Strict
31 listings
6.5% of total
Cancellation Policy Insights for Serra Negra
- The prevailing Airbnb cancellation policy trend in Serra Negra is Moderate, used by 30.4% of listings.
- There's a relatively balanced mix between guest-friendly (60.2%) and stricter (31.3%) policies, offering choices for different guest needs.
- Strict cancellation policies are quite rare (6.5%), potentially making listings with this policy less competitive unless justified by high demand or property type.
Recommendations for Hosts
- Consider adopting a Moderate policy to align with the 30.4% market standard in Serra Negra.
- Using a Strict policy might deter some guests, as only 6.5% of listings use it. Evaluate if potential revenue protection outweighs possible lower booking rates.
- Regularly review your cancellation policy against competitors and market demand shifts in Serra Negra.
Serra Negra STR Booking Lead Time Analysis (2026)
Average Booking Lead Time by Month
Booking Lead Time Insights for Serra Negra
- The overall average booking lead time for vacation rentals in Serra Negra is 28 days.
- Guests book furthest in advance for stays during December (average 49 days), likely coinciding with peak travel demand or local events.
- The shortest booking windows occur for stays in September (average 19 days), indicating more last-minute travel plans during this time.
- Seasonally, Winter (36 days avg.) sees the longest lead times, while Fall (23 days avg.) has the shortest, reflecting typical travel planning cycles.
Recommendations for Hosts
- Use the overall average lead time (28 days) as a baseline for your pricing and availability strategy in Serra Negra.
- For December stays, consider implementing length-of-stay discounts or slightly higher rates for bookings made less than 49 days out to capitalize on advance planning.
- Target marketing efforts for the Winter season well in advance (at least 36 days) to capture early planners.
- Monitor your own booking lead times against these Serra Negra averages to identify opportunities for dynamic pricing adjustments.
Popular & Essential Airbnb Amenities in Serra Negra (2026)
Amenity Prevalence
Amenity Insights for Serra Negra
- Essential amenities in Serra Negra that guests expect include: TV. Lacking these (this) could significantly impact bookings.
- Popular amenities like Wifi, Free parking on premises, Kitchen are common but not universal. Offering these can provide a competitive edge.
- Warning: Wifi is not universally provided but is considered essential globally. Ensure reliable Wifi is offered.
Recommendations for Hosts
- Ensure your listing includes all essential amenities for Serra Negra: TV.
- Prioritize adding missing essentials: TV.
- Consider adding popular differentiators like Wifi or Free parking on premises to increase appeal.
- Highlight unique or less common amenities you offer (e.g., hot tub, dedicated workspace, EV charger) in your listing description and photos.
- Regularly check competitor amenities in Serra Negra to stay competitive.
Serra Negra Airbnb Guest Demographics & Profile Analysis (2026)
Guest Profile Summary for Serra Negra
- The typical guest profile for Airbnb in Serra Negra consists of primarily domestic travelers (99%), often arriving from nearby São Paulo, typically belonging to the Post-2000s (Gen Z/Alpha) group (50%), primarily speaking Portuguese or English.
- Domestic travelers account for 98.7% of guests.
- Key international markets include Brazil (98.7%) and United States (0.2%).
- Top languages spoken are Portuguese (54.7%) followed by English (27.7%).
- A significant demographic segment is the Post-2000s (Gen Z/Alpha) group, representing 50% of guests.
Recommendations for Hosts
- Target domestic marketing efforts towards travelers from São Paulo and Campinas.
- Tailor amenities and listing descriptions to appeal to the dominant Post-2000s (Gen Z/Alpha) demographic (e.g., highlight fast WiFi, smart home features, local guides).
- Highlight unique local experiences or amenities relevant to the primary guest profile.
- Consider seasonal promotions aligned with peak travel times for key origin markets.
Nearby Short-Term Rental Market Comparison
How does the Serra Negra Airbnb market stack up against its neighbors? Compare key performance metrics like average monthly revenue, ADR, and occupancy rates in surrounding areas to understand the broader regional STR landscape.
| Market | Active Properties | Monthly Revenue | Daily Rate | Avg. Occupancy |
|---|---|---|---|---|
| Riviera de São Lourenço | 10 | $2,868 | $213.78 | 46% |
| Tuiuti | 18 | $1,686 | $156.45 | 30% |
| Itupeva | 136 | $1,561 | $225.82 | 28% |
| Morungaba | 31 | $1,435 | $263.39 | 27% |
| Campo Limpo Paulista | 49 | $1,428 | $181.02 | 30% |
| Valinhos | 61 | $1,370 | $176.28 | 33% |
| Itatiba | 171 | $1,331 | $177.58 | 29% |
| Vargem | 48 | $1,319 | $190.42 | 28% |
| Elias Fausto | 13 | $1,296 | $143.78 | 30% |
| Porto Feliz | 69 | $1,279 | $260.86 | 27% |