Sao Jose do Barreiro Airbnb Market Analysis 2026: Short Term Rental Data & Vacation Rental Statistics in São Paulo, Brazil
Is Airbnb profitable in Sao Jose do Barreiro in 2026? Explore comprehensive Airbnb analytics for Sao Jose do Barreiro, São Paulo, Brazil to uncover income potential. This 2026 STR market report for Sao Jose do Barreiro, based on AirROI data from February 2025 to January 2026, reveals key trends in the niche market of 38 active listings.
Whether you're considering an Airbnb investment in Sao Jose do Barreiro, optimizing your existing vacation rental, or exploring rental arbitrage opportunities, understanding the Sao Jose do Barreiro Airbnb data is crucial. Leveraging the low regulation environment is key to maximizing your short term rental income potential. Let's dive into the specifics.
Key Sao Jose do Barreiro Airbnb Performance Metrics Overview
Monthly Airbnb Revenue Variations & Income Potential in Sao Jose do Barreiro (2026)
Understanding the monthly revenue variations for Airbnb listings in Sao Jose do Barreiro is key to maximizing your short term rental income potential. Seasonality significantly impacts earnings. Our analysis, based on data from the past 12 months, shows that the peak revenue month for STRs in Sao Jose do Barreiro is typically December, while February often presents the lowest earnings, highlighting opportunities for strategic pricing adjustments during shoulder and low seasons. Explore the typical Airbnb income in Sao Jose do Barreiro across different performance tiers:
- Best-in-class properties (Top 10%) achieve $904+ monthly, often utilizing dynamic pricing and superior guest experiences.
- Strong performing properties (Top 25%) earn $526 or more, indicating effective management and desirable locations/amenities.
- Typical properties (Median) generate around $225 per month, representing the average market performance.
- Entry-level properties (Bottom 25%) see earnings around $114, often with potential for optimization.
Average Monthly Airbnb Earnings Trend in Sao Jose do Barreiro
Sao Jose do Barreiro Airbnb Occupancy Rate Trends (2026)
Maximize your bookings by understanding the Sao Jose do Barreiro STR occupancy trends. Seasonal demand shifts significantly influence how often properties are booked. Typically, Januarysees the highest demand (peak season occupancy), while February experiences the lowest (low season). Effective strategies, like adjusting minimum stays or offering promotions, can boost occupancy during slower periods. Here's how different property tiers perform in Sao Jose do Barreiro:
- Best-in-class properties (Top 10%) achieve 36%+ occupancy, indicating high desirability and potentially optimized availability.
- Strong performing properties (Top 25%) maintain 22% or higher occupancy, suggesting good market fit and guest satisfaction.
- Typical properties (Median) have an occupancy rate around 13%.
- Entry-level properties (Bottom 25%) average 8% occupancy, potentially facing higher vacancy.
Average Monthly Occupancy Rate Trend in Sao Jose do Barreiro
Average Daily Rate (ADR) Airbnb Trends in Sao Jose do Barreiro (2026)
Effective short term rental pricing strategy in Sao Jose do Barreiro involves understanding monthly ADR fluctuations. The Average Daily Rate (ADR) for Airbnb in Sao Jose do Barreiro typically peaks in December and dips lowest during February. Leveraging Airbnb dynamic pricing tools or strategies based on this seasonality can significantly boost revenue. Here's a look at the typical nightly rates achieved:
- Best-in-class properties (Top 10%) command rates of $157+ per night, often due to premium features or locations.
- Strong performing properties (Top 25%) achieve nightly rates of $95 or more.
- Typical properties (Median) charge around $60 per night.
- Entry-level properties (Bottom 25%) earn around $39 per night.
Average Daily Rate (ADR) Trend by Month in Sao Jose do Barreiro
Get Live Sao Jose do Barreiro Market Intelligence 👇

Explore Real-time Analytics
Airbnb Seasonality Analysis & Trends in Sao Jose do Barreiro (2026)
Peak Season (December, January, May)
- Revenue averages $570 per month
- Occupancy rates average 21.3%
- Daily rates average $86
Shoulder Season
- Revenue averages $369 per month
- Occupancy maintains around 17.3%
- Daily rates hold near $82
Low Season (February, April, August)
- Revenue drops to average $207 per month
- Occupancy decreases to average 13.7%
- Daily rates adjust to average $77
Seasonality Insights for Sao Jose do Barreiro
- The Airbnb seasonality in Sao Jose do Barreiro shows highly seasonal trends requiring careful strategy. While the sections above show seasonal averages, it's also insightful to look at the extremes:
- During the high season, the absolute peak month showcases Sao Jose do Barreiro's highest earning potential, with monthly revenues capable of climbing to $699, occupancy reaching a high of 24.0%, and ADRs peaking at $90.
- Conversely, the slowest single month of the year, typically falling within the low season, marks the market's lowest point. In this month, revenue might dip to $162, occupancy could drop to 10.5%, and ADRs may adjust down to $74.
- Understanding both the seasonal averages and these monthly peaks and troughs in revenue, occupancy, and ADR is crucial for maximizing your Airbnb profit potential in Sao Jose do Barreiro.
Seasonal Strategies for Maximizing Profit
- Peak Season: Maximize revenue through premium pricing and potentially longer minimum stays. Ensure high availability.
- Low Season: Offer competitive pricing, special promotions (e.g., extended stay discounts), and flexible cancellation policies. Target off-season travelers like remote workers or budget-conscious guests.
- Shoulder Seasons: Implement dynamic pricing that balances peak and low rates. Target weekend travelers or specific events. Offer slightly more flexible terms than peak season.
- Regularly analyze your own performance against these Sao Jose do Barreiro seasonality benchmarks and adjust your pricing and availability strategy accordingly.
Best Areas for Airbnb Investment in Sao Jose do Barreiro (2026)
Exploring the top neighborhoods for short-term rentals in Sao Jose do Barreiro? This section highlights key areas, outlining why they are attractive for hosts and guests, along with notable local attractions. Consider these locations based on your target guest profile and investment strategy.
| Neighborhood / Area | Why Host Here? (Target Guests & Appeal) | Key Attractions & Landmarks |
|---|---|---|
| Centro Histórico | Cultural hub of São José do Barreiro, featuring colonial architecture and historical landmarks. Perfect for tourists interested in history and culture, with easy access to local attractions. | Igreja Matriz de São José, Museu Histórico, Praça dos Três Poderes, Centro Cultural, Cascata dos Amores |
| Parque Nacional da Serra da Bocaina | Natural paradise with stunning landscapes and abundant outdoor activities. Ideal for nature lovers and ecotourism, attracting visitors who seek adventure and tranquility in nature. | Trilhas para Cachoeiras, Pico do Papagaio, Fazenda da Esperança, Mirante do Sima, Rota das Cachoeiras |
| Cachoeira dos Amores | Famous for its beautiful waterfall, this area offers picturesque views and relaxation spots. A great spot for guests looking for a serene getaway and a connection with nature. | Cachoeira dos Amores, Trilhas Ecológicas, Áreas para Piquenique, Mirantes Panorâmicos |
| Praça da Matriz | The town square is the heart of local activities, surrounded by cafés and shops. It's appealing for both tourists and locals, serving as a social hub with events throughout the year. | Eventos Locais, Feira de Artesanato, Cafés e Restaurantes, Espaços Culturais |
| Serra do Mar | A mountainous region offering breathtaking views and hiking opportunities. It attracts visitors looking for adventure, hiking trails, and beautiful scenery. | Trilhas de Caminhada, Mirantes Naturais, DIVERSAS CACHOEIRAS, Observação de Aves |
| Ribeirão do Itaquá | A rural area with agricultural activities, offering a unique experience of local life. It appeals to guests interested in rural tourism and experiencing the local culture. | Atividades Agrícolas, Feiras de Produtos Locais, Rios e Piscinas Naturais |
| Tremembé | Known for its picturesque landscapes and quiet atmosphere, perfect for a peaceful retreat away from the city hustle. Ideal for families and couples seeking a romantic getaway. | Mirantes, Caminhos de Terra, Trilhas, Áreas para Camping |
| Açude do Barreiro | A tranquil water reservoir area, perfect for relaxation and family outings. It draws visitors looking for peaceful nature experiences and water activities. | Pesca, Passeios de Barco, Zonas de Lazer, Pontos de Observação |
Understanding Airbnb License Requirements & STR Laws in Sao Jose do Barreiro (2026)
While Sao Jose do Barreiro, São Paulo, Brazil currently shows low STR regulations, specific Airbnb license requirements might still exist or change. Always verify the latest short term rental regulations and Airbnb license requirements directly with local government authorities for Sao Jose do Barreiro to ensure full compliance before hosting.
(Source: AirROI data, 2026, finding no licensed listings among those analyzed)
Top Performing Airbnb Properties in Sao Jose do Barreiro (2026)
Benchmark your potential! Explore examples of top-performing Airbnb properties in Sao Jose do Barreirobased on Trailing Twelve Month (TTM) revenue. Analyze their characteristics, revenue, occupancy rate, and ADR to understand what drives success in this market.
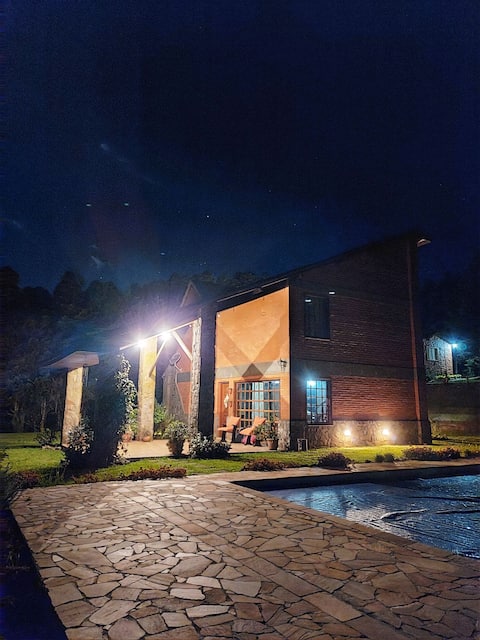
Mountain Refuge, Serra da Bocaina/Mata Atlantic
Entire Place • 3 bedrooms
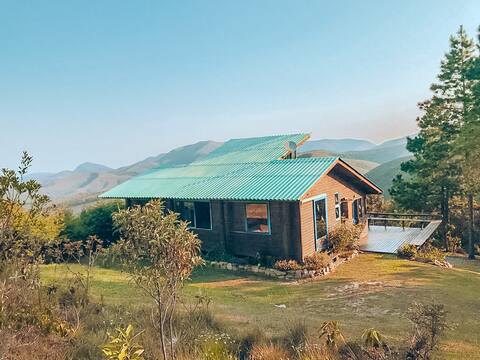
Cozy chalet in the high part of Serra da Bocaina
Entire Place • 3 bedrooms

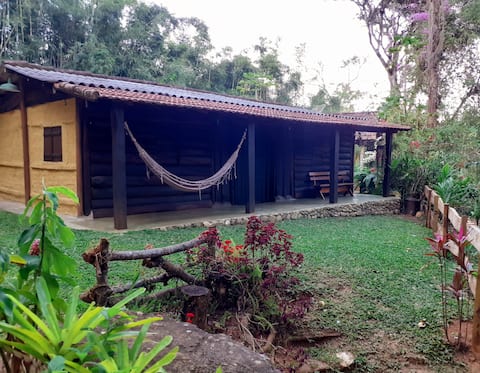
Fazenda Bodoquena. An unforgettable sunset!
Entire Place • 4 bedrooms

Country House with private stream
Entire Place • 2 bedrooms
Cabana de Campo no Vale Histórico. (EASY ACCESS)
Entire Place • 2 bedrooms

Chalé Bocaina, the Perfect Refuge
Entire Place • 1 bedroom
Note: Performance varies based on location, size, amenities, seasonality, and management quality. Data reflects the past 12 months.
Top Performing Airbnb Hosts in Sao Jose do Barreiro (2026)
Learn from the best! This table showcases top-performing Airbnb hosts in Sao Jose do Barreiro based on the number of properties managed and estimated total revenue over the past year. Analyze their scale and performance metrics.
| Host Name | Properties | Grossing Revenue | Stay Reviews | Avg Rating |
|---|---|---|---|---|
| Paulo Cesar | 2 | $11,320 | 55 | 4.83/5.0 |
| Libania | 2 | $9,449 | 26 | 5.00/5.0 |
| Isa | 1 | $8,791 | 16 | 4.81/5.0 |
| Ana Cristina | 1 | $8,771 | 37 | 4.92/5.0 |
| Mi | 2 | $8,482 | 49 | 4.98/5.0 |
| Wilson Martins | 5 | $8,430 | 70 | 4.92/5.0 |
| Lupércio | 6 | $8,242 | 57 | 4.98/5.0 |
| Regiane | 1 | $5,925 | 136 | 4.92/5.0 |
| Sonia Maria | 2 | $5,841 | 71 | 4.92/5.0 |
| Fernando Roge | 1 | $4,302 | 166 | 4.72/5.0 |
Analyzing the strategies of top hosts, such as their property selection, pricing, and guest communication, can offer valuable lessons for optimizing your own Airbnb operations in Sao Jose do Barreiro.
Dive Deeper: Advanced Sao Jose do Barreiro STR Market Data (2026)
Ready to unlock more insights? AirROI provides access to advanced metrics and comprehensive Airbnb data for Sao Jose do Barreiro. Explore detailed analytics beyond this report to refine your investment strategy, optimize pricing, and maximize your vacation rental profits.
Explore Advanced MetricsSao Jose do Barreiro Short-Term Rental Market Composition (2026): Property & Room Types
Room Type Distribution
Property Type Distribution
Market Composition Insights for Sao Jose do Barreiro
- The Sao Jose do Barreiro Airbnb market composition is heavily skewed towards Entire Home/Apt listings, which make up 73.7% of the 38 active rentals. This indicates strong guest preference for privacy and space.
- Looking at the property type distribution in Sao Jose do Barreiro, House properties are the most common (71.1%), reflecting the local real estate landscape.
- Houses represent a significant 71.1% portion, catering likely to families or larger groups.
- The presence of 21.1% Hotel/Boutique listings indicates integration with traditional hospitality.
- Smaller segments like unique stays, others, apartment/condo (combined 7.8%) offer potential for unique stay experiences.
Sao Jose do Barreiro Airbnb Room Capacity Analysis (2026): Bedroom Distribution
Distribution of Listings by Number of Bedrooms
Room Capacity Insights for Sao Jose do Barreiro
- The dominant room capacity in Sao Jose do Barreiro is 1 bedroom listings, making up 31.6% of the market. This suggests a strong demand for properties suitable for couples or solo travelers.
- Together, 1 bedroom and 2 bedrooms properties represent 52.7% of the active Airbnb listings in Sao Jose do Barreiro, indicating a high concentration in these sizes.
- A significant 34.2% of listings offer 3+ bedrooms, catering to larger groups and families seeking more space in Sao Jose do Barreiro.
Sao Jose do Barreiro Vacation Rental Guest Capacity Trends (2026)
Distribution of Listings by Guest Capacity
Guest Capacity Insights for Sao Jose do Barreiro
- The most common guest capacity trend in Sao Jose do Barreiro vacation rentals is listings accommodating 8+ guests (23.7%). This suggests the primary traveler segment is likely larger groups.
- Properties designed for 8+ guests and 4 guests dominate the Sao Jose do Barreiro STR market, accounting for 42.1% of listings.
- 42.1% of properties accommodate 6+ guests, serving the market segment for larger families or group travel in Sao Jose do Barreiro.
- On average, properties in Sao Jose do Barreiro are equipped to host 4.5 guests.
Sao Jose do Barreiro Airbnb Booking Patterns (2026): Available vs. Booked Days
Available Days Distribution
Booked Days Distribution
Booking Pattern Insights for Sao Jose do Barreiro
- The most common availability pattern in Sao Jose do Barreiro falls within the 271-366 days range, representing 92.1% of listings. This suggests many properties have significant open periods on their calendars.
- Approximately 100.0% of listings show high availability (181+ days open annually), indicating potential for increased bookings or specific owner usage patterns.
- For booked days, the 1-30 days range is most frequent in Sao Jose do Barreiro (47.4%), reflecting common guest stay durations or potential owner blocking patterns.
Sao Jose do Barreiro Airbnb Minimum Stay Requirements Analysis
Distribution of Listings by Minimum Night Requirement
1 Night
14 listings
36.8% of total
2 Nights
19 listings
50% of total
3 Nights
1 listings
2.6% of total
30+ Nights
4 listings
10.5% of total
Key Insights
- The most prevalent minimum stay requirement in Sao Jose do Barreiro is 2 Nights, adopted by 50% of listings. This highlights the market's preference for shorter, flexible bookings.
- A strong majority (86.8%) of the Sao Jose do Barreiro Airbnb data shows acceptance of very short stays (1-2 nights), indicating a dynamic, high-turnover market.
- A significant segment (10.5%) caters to monthly stays (30+ nights) in Sao Jose do Barreiro, pointing to opportunities in the extended-stay market.
Recommendations
- Align with the market by considering a 2 Nights minimum stay, as 50% of Sao Jose do Barreiro hosts use this setting.
- Explore offering discounts for stays of 30+ nights to attract the 10.5% of the market seeking extended stays.
- Adjust minimum nights based on seasonality – potentially shorter during low season and longer during peak demand periods in Sao Jose do Barreiro.
Sao Jose do Barreiro Airbnb Cancellation Policy Trends Analysis (2026)
Limited
5 listings
13.2% of total
Flexible
12 listings
31.6% of total
Moderate
13 listings
34.2% of total
Firm
8 listings
21.1% of total
Cancellation Policy Insights for Sao Jose do Barreiro
- The prevailing Airbnb cancellation policy trend in Sao Jose do Barreiro is Moderate, used by 34.2% of listings.
- There's a relatively balanced mix between guest-friendly (65.8%) and stricter (21.1%) policies, offering choices for different guest needs.
Recommendations for Hosts
- Consider adopting a Moderate policy to align with the 34.2% market standard in Sao Jose do Barreiro.
- Regularly review your cancellation policy against competitors and market demand shifts in Sao Jose do Barreiro.
Sao Jose do Barreiro STR Booking Lead Time Analysis (2026)
Average Booking Lead Time by Month
Booking Lead Time Insights for Sao Jose do Barreiro
- The overall average booking lead time for vacation rentals in Sao Jose do Barreiro is 34 days.
- Guests book furthest in advance for stays during July (average 53 days), likely coinciding with peak travel demand or local events.
- The shortest booking windows occur for stays in September (average 19 days), indicating more last-minute travel plans during this time.
- Seasonally, Winter (37 days avg.) sees the longest lead times, while Fall (24 days avg.) has the shortest, reflecting typical travel planning cycles.
Recommendations for Hosts
- Use the overall average lead time (34 days) as a baseline for your pricing and availability strategy in Sao Jose do Barreiro.
- For July stays, consider implementing length-of-stay discounts or slightly higher rates for bookings made less than 53 days out to capitalize on advance planning.
- Target marketing efforts for the Winter season well in advance (at least 37 days) to capture early planners.
- Monitor your own booking lead times against these Sao Jose do Barreiro averages to identify opportunities for dynamic pricing adjustments.
Popular & Essential Airbnb Amenities in Sao Jose do Barreiro (2026)
Amenity Prevalence
Amenity Insights for Sao Jose do Barreiro
- Popular amenities like Free parking on premises, Wifi, TV are common but not universal. Offering these can provide a competitive edge.
- Warning: Wifi is not universally provided but is considered essential globally. Ensure reliable Wifi is offered.
Recommendations for Hosts
- Consider adding popular differentiators like Free parking on premises or Wifi to increase appeal.
- Highlight unique or less common amenities you offer (e.g., hot tub, dedicated workspace, EV charger) in your listing description and photos.
- Regularly check competitor amenities in Sao Jose do Barreiro to stay competitive.
Sao Jose do Barreiro Airbnb Guest Demographics & Profile Analysis (2026)
Guest Profile Summary for Sao Jose do Barreiro
- The typical guest profile for Airbnb in Sao Jose do Barreiro consists of primarily domestic travelers (99%), often arriving from nearby São Paulo, typically belonging to the Post-2000s (Gen Z/Alpha) group (50%), primarily speaking Portuguese or English.
- Domestic travelers account for 98.6% of guests.
- Key international markets include Brazil (98.6%) and Morocco (1.4%).
- Top languages spoken are Portuguese (46.7%) followed by English (23.3%).
- A significant demographic segment is the Post-2000s (Gen Z/Alpha) group, representing 50% of guests.
Recommendations for Hosts
- Target domestic marketing efforts towards travelers from São Paulo and Rio de Janeiro.
- Tailor amenities and listing descriptions to appeal to the dominant Post-2000s (Gen Z/Alpha) demographic (e.g., highlight fast WiFi, smart home features, local guides).
- Highlight unique local experiences or amenities relevant to the primary guest profile.
- Consider seasonal promotions aligned with peak travel times for key origin markets.
Nearby Short-Term Rental Market Comparison
How does the Sao Jose do Barreiro Airbnb market stack up against its neighbors? Compare key performance metrics like average monthly revenue, ADR, and occupancy rates in surrounding areas to understand the broader regional STR landscape.
| Market | Active Properties | Monthly Revenue | Daily Rate | Avg. Occupancy |
|---|---|---|---|---|
| Ilha Grande | 11 | $1,783 | $166.42 | 38% |
| Areal | 82 | $1,532 | $198.25 | 30% |
| Queluz | 17 | $1,291 | $152.05 | 30% |
| Brazópolis | 21 | $1,209 | $152.11 | 29% |
| Santa Branca | 53 | $1,138 | $195.49 | 25% |
| Jambeiro | 22 | $1,135 | $185.50 | 24% |
| São Sebastião | 6,175 | $1,114 | $188.11 | 28% |
| Rio de Janeiro | 27,660 | $1,085 | $106.45 | 43% |
| Angra dos Reis | 2,446 | $1,017 | $158.25 | 33% |
| Paraisópolis | 104 | $1,004 | $108.16 | 32% |