Santa Isabel Airbnb Market Analysis 2026: Short Term Rental Data & Vacation Rental Statistics in São Paulo, Brazil
Is Airbnb profitable in Santa Isabel in 2026? Explore comprehensive Airbnb analytics for Santa Isabel, São Paulo, Brazil to uncover income potential. This 2026 STR market report for Santa Isabel, based on AirROI data from February 2025 to January 2026, reveals key trends in the niche market of 145 active listings.
Whether you're considering an Airbnb investment in Santa Isabel, optimizing your existing vacation rental, or exploring rental arbitrage opportunities, understanding the Santa Isabel Airbnb data is crucial. Leveraging the low regulation environment is key to maximizing your short term rental income potential. Let's dive into the specifics.
Key Santa Isabel Airbnb Performance Metrics Overview
Monthly Airbnb Revenue Variations & Income Potential in Santa Isabel (2026)
Understanding the monthly revenue variations for Airbnb listings in Santa Isabel is key to maximizing your short term rental income potential. Seasonality significantly impacts earnings. Our analysis, based on data from the past 12 months, shows that the peak revenue month for STRs in Santa Isabel is typically December, while August often presents the lowest earnings, highlighting opportunities for strategic pricing adjustments during shoulder and low seasons. Explore the typical Airbnb income in Santa Isabel across different performance tiers:
- Best-in-class properties (Top 10%) achieve $3,423+ monthly, often utilizing dynamic pricing and superior guest experiences.
- Strong performing properties (Top 25%) earn $1,947 or more, indicating effective management and desirable locations/amenities.
- Typical properties (Median) generate around $924 per month, representing the average market performance.
- Entry-level properties (Bottom 25%) see earnings around $432, often with potential for optimization.
Average Monthly Airbnb Earnings Trend in Santa Isabel
Santa Isabel Airbnb Occupancy Rate Trends (2026)
Maximize your bookings by understanding the Santa Isabel STR occupancy trends. Seasonal demand shifts significantly influence how often properties are booked. Typically, Decembersees the highest demand (peak season occupancy), while August experiences the lowest (low season). Effective strategies, like adjusting minimum stays or offering promotions, can boost occupancy during slower periods. Here's how different property tiers perform in Santa Isabel:
- Best-in-class properties (Top 10%) achieve 53%+ occupancy, indicating high desirability and potentially optimized availability.
- Strong performing properties (Top 25%) maintain 36% or higher occupancy, suggesting good market fit and guest satisfaction.
- Typical properties (Median) have an occupancy rate around 19%.
- Entry-level properties (Bottom 25%) average 10% occupancy, potentially facing higher vacancy.
Average Monthly Occupancy Rate Trend in Santa Isabel
Average Daily Rate (ADR) Airbnb Trends in Santa Isabel (2026)
Effective short term rental pricing strategy in Santa Isabel involves understanding monthly ADR fluctuations. The Average Daily Rate (ADR) for Airbnb in Santa Isabel typically peaks in December and dips lowest during April. Leveraging Airbnb dynamic pricing tools or strategies based on this seasonality can significantly boost revenue. Here's a look at the typical nightly rates achieved:
- Best-in-class properties (Top 10%) command rates of $315+ per night, often due to premium features or locations.
- Strong performing properties (Top 25%) achieve nightly rates of $226 or more.
- Typical properties (Median) charge around $153 per night.
- Entry-level properties (Bottom 25%) earn around $115 per night.
Average Daily Rate (ADR) Trend by Month in Santa Isabel
Get Live Santa Isabel Market Intelligence 👇

Explore Real-time Analytics
Airbnb Seasonality Analysis & Trends in Santa Isabel (2026)
Peak Season (December, March, November)
- Revenue averages $1,801 per month
- Occupancy rates average 28.9%
- Daily rates average $194
Shoulder Season
- Revenue averages $1,404 per month
- Occupancy maintains around 25.0%
- Daily rates hold near $182
Low Season (May, August, September)
- Revenue drops to average $1,244 per month
- Occupancy decreases to average 21.0%
- Daily rates adjust to average $178
Seasonality Insights for Santa Isabel
- The Airbnb seasonality in Santa Isabel shows moderate seasonality with distinct peak and low periods. While the sections above show seasonal averages, it's also insightful to look at the extremes:
- During the high season, the absolute peak month showcases Santa Isabel's highest earning potential, with monthly revenues capable of climbing to $2,072, occupancy reaching a high of 30.2%, and ADRs peaking at $214.
- Conversely, the slowest single month of the year, typically falling within the low season, marks the market's lowest point. In this month, revenue might dip to $1,217, occupancy could drop to 19.5%, and ADRs may adjust down to $169.
- Understanding both the seasonal averages and these monthly peaks and troughs in revenue, occupancy, and ADR is crucial for maximizing your Airbnb profit potential in Santa Isabel.
Seasonal Strategies for Maximizing Profit
- Peak Season: Maximize revenue through premium pricing and potentially longer minimum stays. Ensure high availability.
- Low Season: Offer competitive pricing, special promotions (e.g., extended stay discounts), and flexible cancellation policies. Target off-season travelers like remote workers or budget-conscious guests.
- Shoulder Seasons: Implement dynamic pricing that balances peak and low rates. Target weekend travelers or specific events. Offer slightly more flexible terms than peak season.
- Regularly analyze your own performance against these Santa Isabel seasonality benchmarks and adjust your pricing and availability strategy accordingly.
Best Areas for Airbnb Investment in Santa Isabel (2026)
Exploring the top neighborhoods for short-term rentals in Santa Isabel? This section highlights key areas, outlining why they are attractive for hosts and guests, along with notable local attractions. Consider these locations based on your target guest profile and investment strategy.
| Neighborhood / Area | Why Host Here? (Target Guests & Appeal) | Key Attractions & Landmarks |
|---|---|---|
| Centro | The historic center of São Paulo, home to many cultural and architectural landmarks. It's a hub for business, tourism, and entertainment, making it ideal for short-term rentals. | Teatro Municipal, São Paulo Cathedral, Pátio do Colégio, Museu de Arte de São Paulo, Avenida Paulista |
| Vila Madalena | A bohemian neighborhood known for its vibrant street art, nightlife, and trendy bars. Popular among younger crowds and artists, making it a hot spot for travelers looking for local culture. | Beco do Batman, bars and restaurants, Casa de Cultura, art galleries, nightclubs |
| Jardins | An upscale residential neighborhood known for its luxury shops, fine dining, and proximity to cultural institutions. Attractive to affluent tourists and business travelers. | Avenida Paulista, Ibirapuera Park, Museu Afro Brasil, shopping centers, art galleries |
| pinheiros | A trendy district that blends residential charm with lively nightlife and dining options. Ideal for visitors wanting a local experience with modern amenities. | Villa Lobos Park, bars and restaurants, Mercadão, cinemas, art galleries |
| Ibirapuera | Home to one of Brazil's largest urban parks, it's a highly sought area for families and tourists looking for recreation and culture, with plenty of green space. | Ibirapuera Park, Museu de Arte Moderna, Oca, auditorium, cultural events |
| Brooklin | An up-and-coming neighborhood known for its modern architecture and business centers. It attracts business travelers and those seeking a suburban feel close to downtown. | Estaiada Bridge, shopping malls, restaurants, business district |
| Moema | A residential area known for its restaurants, shopping, and proximity to Ibirapuera Park. It's a popular choice for both long and short-term rentals. | Ibirapuera Park access, shopping streets, local markets, great dining options |
| Santa Cecília | A cultural melting pot with a rich history and vibrant arts scene. It's gaining popularity among tourists seeking an authentic São Paulo experience. | Teatro Abril, Cine Belas Artes, local street fairs, art galleries, bars |
Understanding Airbnb License Requirements & STR Laws in Santa Isabel (2026)
While Santa Isabel, São Paulo, Brazil currently shows low STR regulations, specific Airbnb license requirements might still exist or change. Always verify the latest short term rental regulations and Airbnb license requirements directly with local government authorities for Santa Isabel to ensure full compliance before hosting.
(Source: AirROI data, 2026, finding no licensed listings among those analyzed)
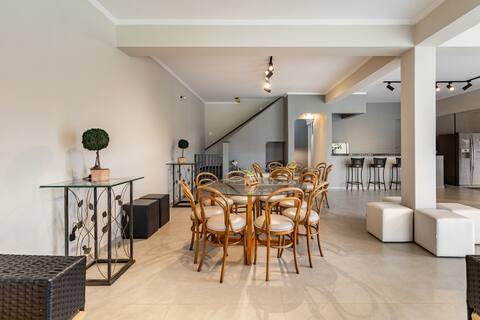
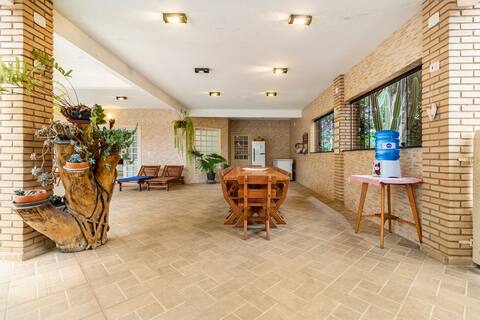
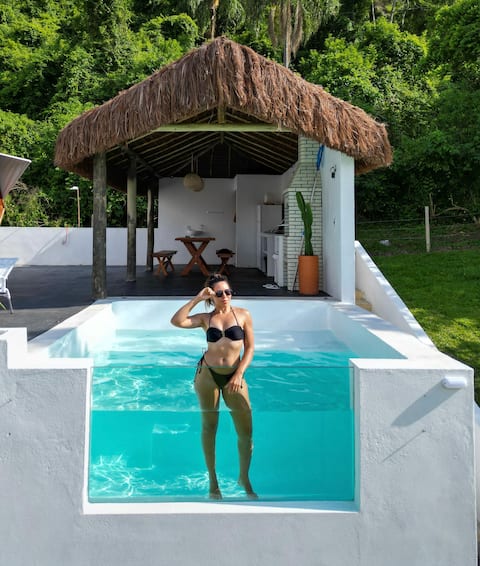
Top Performing Airbnb Properties in Santa Isabel (2026)
Benchmark your potential! Explore examples of top-performing Airbnb properties in Santa Isabelbased on Trailing Twelve Month (TTM) revenue. Analyze their characteristics, revenue, occupancy rate, and ADR to understand what drives success in this market.

Country house with swimming pool and barbecue area.
Entire Place • 6 bedrooms
Rental of a site for events of up to 70 people. Day Use
Entire Place • N/A
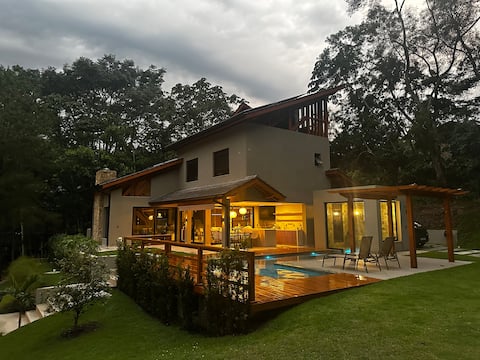
House with sauna and heated pool in a condominium
Entire Place • 4 bedrooms
RECANTO POR DO SOL RANCH
Entire Place • 8 bedrooms

Cozy retreat in the middle of the Atlantic Forest
Entire Place • 4 bedrooms
Cupulesantorini
Entire Place • 1 bedroom
Note: Performance varies based on location, size, amenities, seasonality, and management quality. Data reflects the past 12 months.
Top Performing Airbnb Hosts in Santa Isabel (2026)
Learn from the best! This table showcases top-performing Airbnb hosts in Santa Isabel based on the number of properties managed and estimated total revenue over the past year. Analyze their scale and performance metrics.
| Host Name | Properties | Grossing Revenue | Stay Reviews | Avg Rating |
|---|---|---|---|---|
| Cris | 2 | $120,070 | 58 | 5.00/5.0 |
| Gustavo | 3 | $94,893 | 274 | 4.89/5.0 |
| Andrezza | 1 | $78,752 | 18 | 4.94/5.0 |
| Gabriela | 2 | $63,393 | 6 | 5.00/5.0 |
| Eduardo | 1 | $51,822 | 22 | 5.00/5.0 |
| Nilson | 1 | $50,929 | 105 | 4.99/5.0 |
| Bruno | 1 | $47,912 | 127 | 4.99/5.0 |
| Elton | 3 | $45,263 | 191 | 4.91/5.0 |
| Jessica | 1 | $38,286 | 51 | 4.98/5.0 |
| Edson | 1 | $34,144 | 8 | 4.88/5.0 |
Analyzing the strategies of top hosts, such as their property selection, pricing, and guest communication, can offer valuable lessons for optimizing your own Airbnb operations in Santa Isabel.
Dive Deeper: Advanced Santa Isabel STR Market Data (2026)
Ready to unlock more insights? AirROI provides access to advanced metrics and comprehensive Airbnb data for Santa Isabel. Explore detailed analytics beyond this report to refine your investment strategy, optimize pricing, and maximize your vacation rental profits.
Explore Advanced MetricsSanta Isabel Short-Term Rental Market Composition (2026): Property & Room Types
Room Type Distribution
Property Type Distribution
Market Composition Insights for Santa Isabel
- The Santa Isabel Airbnb market composition is heavily skewed towards Entire Home/Apt listings, which make up 97.9% of the 145 active rentals. This indicates strong guest preference for privacy and space.
- Looking at the property type distribution in Santa Isabel, House properties are the most common (82.8%), reflecting the local real estate landscape.
- Houses represent a significant 82.8% portion, catering likely to families or larger groups.
- The presence of 7.6% Hotel/Boutique listings indicates integration with traditional hospitality.
- Smaller segments like others, unique stays (combined 2.8%) offer potential for unique stay experiences.
Santa Isabel Airbnb Room Capacity Analysis (2026): Bedroom Distribution
Distribution of Listings by Number of Bedrooms
Room Capacity Insights for Santa Isabel
- The dominant room capacity in Santa Isabel is 3 bedrooms listings, making up 31.7% of the market. This suggests a strong demand for properties suitable for families or small groups.
- Together, 3 bedrooms and 5+ bedrooms properties represent 55.8% of the active Airbnb listings in Santa Isabel, indicating a high concentration in these sizes.
- A significant 74.4% of listings offer 3+ bedrooms, catering to larger groups and families seeking more space in Santa Isabel.
Santa Isabel Vacation Rental Guest Capacity Trends (2026)
Distribution of Listings by Guest Capacity
Guest Capacity Insights for Santa Isabel
- The most common guest capacity trend in Santa Isabel vacation rentals is listings accommodating 8+ guests (83.4%). This suggests the primary traveler segment is likely larger groups.
- Properties designed for 8+ guests and 6 guests dominate the Santa Isabel STR market, accounting for 89.6% of listings.
- 90.3% of properties accommodate 6+ guests, serving the market segment for larger families or group travel in Santa Isabel.
- On average, properties in Santa Isabel are equipped to host 7.4 guests.
Santa Isabel Airbnb Booking Patterns (2026): Available vs. Booked Days
Available Days Distribution
Booked Days Distribution
Booking Pattern Insights for Santa Isabel
- The most common availability pattern in Santa Isabel falls within the 271-366 days range, representing 80% of listings. This suggests many properties have significant open periods on their calendars.
- Approximately 97.2% of listings show high availability (181+ days open annually), indicating potential for increased bookings or specific owner usage patterns.
- For booked days, the 31-90 days range is most frequent in Santa Isabel (39.3%), reflecting common guest stay durations or potential owner blocking patterns.
- A notable 2.8% of properties secure long booking periods (181+ days booked per year), highlighting successful long-term rental strategies or significant owner usage.
Santa Isabel Airbnb Minimum Stay Requirements Analysis
Distribution of Listings by Minimum Night Requirement
1 Night
53 listings
36.6% of total
2 Nights
57 listings
39.3% of total
4-6 Nights
1 listings
0.7% of total
30+ Nights
34 listings
23.4% of total
Key Insights
- The most prevalent minimum stay requirement in Santa Isabel is 2 Nights, adopted by 39.3% of listings. This highlights the market's preference for shorter, flexible bookings.
- A strong majority (75.9%) of the Santa Isabel Airbnb data shows acceptance of very short stays (1-2 nights), indicating a dynamic, high-turnover market.
- A significant segment (23.4%) caters to monthly stays (30+ nights) in Santa Isabel, pointing to opportunities in the extended-stay market.
Recommendations
- Align with the market by considering a 2 Nights minimum stay, as 39.3% of Santa Isabel hosts use this setting.
- Explore offering discounts for stays of 30+ nights to attract the 23.4% of the market seeking extended stays.
- Adjust minimum nights based on seasonality – potentially shorter during low season and longer during peak demand periods in Santa Isabel.
Santa Isabel Airbnb Cancellation Policy Trends Analysis (2026)
Limited
3 listings
2.1% of total
Flexible
23 listings
15.9% of total
Moderate
35 listings
24.1% of total
Firm
60 listings
41.4% of total
Strict
24 listings
16.6% of total
Cancellation Policy Insights for Santa Isabel
- The prevailing Airbnb cancellation policy trend in Santa Isabel is Firm, used by 41.4% of listings.
- A majority (58.0%) of hosts in Santa Isabel utilize Firm or Strict policies, indicating a market where hosts prioritize booking security.
Recommendations for Hosts
- Consider adopting a Firm policy to align with the 41.4% market standard in Santa Isabel.
- Regularly review your cancellation policy against competitors and market demand shifts in Santa Isabel.
Santa Isabel STR Booking Lead Time Analysis (2026)
Average Booking Lead Time by Month
Booking Lead Time Insights for Santa Isabel
- The overall average booking lead time for vacation rentals in Santa Isabel is 43 days.
- Guests book furthest in advance for stays during December (average 79 days), likely coinciding with peak travel demand or local events.
- The shortest booking windows occur for stays in June (average 23 days), indicating more last-minute travel plans during this time.
- Seasonally, Winter (51 days avg.) sees the longest lead times, while Summer (27 days avg.) has the shortest, reflecting typical travel planning cycles.
Recommendations for Hosts
- Use the overall average lead time (43 days) as a baseline for your pricing and availability strategy in Santa Isabel.
- For December stays, consider implementing length-of-stay discounts or slightly higher rates for bookings made less than 79 days out to capitalize on advance planning.
- Target marketing efforts for the Winter season well in advance (at least 51 days) to capture early planners.
- Monitor your own booking lead times against these Santa Isabel averages to identify opportunities for dynamic pricing adjustments.
Popular & Essential Airbnb Amenities in Santa Isabel (2026)
Amenity Prevalence
Amenity Insights for Santa Isabel
- Essential amenities in Santa Isabel that guests expect include: Kitchen, Free parking on premises, Pool, TV. Lacking these (any) could significantly impact bookings.
- Popular amenities like Wifi, BBQ grill, Pets allowed are common but not universal. Offering these can provide a competitive edge.
- Warning: Wifi is not universally provided but is considered essential globally. Ensure reliable Wifi is offered.
Recommendations for Hosts
- Ensure your listing includes all essential amenities for Santa Isabel: Kitchen, Free parking on premises, Pool, TV.
- Prioritize adding missing essentials: Kitchen, Free parking on premises, Pool, TV.
- Consider adding popular differentiators like Wifi or BBQ grill to increase appeal.
- Highlight unique or less common amenities you offer (e.g., hot tub, dedicated workspace, EV charger) in your listing description and photos.
- Regularly check competitor amenities in Santa Isabel to stay competitive.
Santa Isabel Airbnb Guest Demographics & Profile Analysis (2026)
Guest Profile Summary for Santa Isabel
- The typical guest profile for Airbnb in Santa Isabel consists of primarily domestic travelers (96%), often arriving from nearby São Paulo, typically belonging to the Post-2000s (Gen Z/Alpha) group (50%), primarily speaking Portuguese or English.
- Domestic travelers account for 96.4% of guests.
- Key international markets include Brazil (96.4%) and United States (1.4%).
- Top languages spoken are Portuguese (49%) followed by English (30.2%).
- A significant demographic segment is the Post-2000s (Gen Z/Alpha) group, representing 50% of guests.
Recommendations for Hosts
- Target domestic marketing efforts towards travelers from São Paulo and Guarulhos.
- Tailor amenities and listing descriptions to appeal to the dominant Post-2000s (Gen Z/Alpha) demographic (e.g., highlight fast WiFi, smart home features, local guides).
- Highlight unique local experiences or amenities relevant to the primary guest profile.
- Consider seasonal promotions aligned with peak travel times for key origin markets.
Nearby Short-Term Rental Market Comparison
How does the Santa Isabel Airbnb market stack up against its neighbors? Compare key performance metrics like average monthly revenue, ADR, and occupancy rates in surrounding areas to understand the broader regional STR landscape.
| Market | Active Properties | Monthly Revenue | Daily Rate | Avg. Occupancy |
|---|---|---|---|---|
| Riviera de São Lourenço | 10 | $2,868 | $213.78 | 46% |
| Tuiuti | 18 | $1,686 | $156.45 | 30% |
| Itupeva | 136 | $1,561 | $225.82 | 28% |
| Morungaba | 31 | $1,435 | $263.39 | 27% |
| Campo Limpo Paulista | 49 | $1,428 | $181.02 | 30% |
| Valinhos | 61 | $1,370 | $176.28 | 33% |
| Itatiba | 171 | $1,331 | $177.58 | 29% |
| Vargem | 48 | $1,319 | $190.42 | 28% |
| Elias Fausto | 13 | $1,296 | $143.78 | 30% |
| Porto Feliz | 69 | $1,279 | $260.86 | 27% |