Ribeirão Preto Airbnb Market Analysis 2026: Short Term Rental Data & Vacation Rental Statistics in São Paulo, Brazil
Is Airbnb profitable in Ribeirão Preto in 2026? Explore comprehensive Airbnb analytics for Ribeirão Preto, São Paulo, Brazil to uncover income potential. This 2026 STR market report for Ribeirão Preto, based on AirROI data from February 2025 to January 2026, reveals key trends in the bustling market of 1,432 active listings.
Whether you're considering an Airbnb investment in Ribeirão Preto, optimizing your existing vacation rental, or exploring rental arbitrage opportunities, understanding the Ribeirão Preto Airbnb data is crucial. Leveraging the low regulation environment is key to maximizing your short term rental income potential. Let's dive into the specifics.
Key Ribeirão Preto Airbnb Performance Metrics Overview
Monthly Airbnb Revenue Variations & Income Potential in Ribeirão Preto (2026)
Understanding the monthly revenue variations for Airbnb listings in Ribeirão Preto is key to maximizing your short term rental income potential. Seasonality significantly impacts earnings. Our analysis, based on data from the past 12 months, shows that the peak revenue month for STRs in Ribeirão Preto is typically April, while August often presents the lowest earnings, highlighting opportunities for strategic pricing adjustments during shoulder and low seasons. Explore the typical Airbnb income in Ribeirão Preto across different performance tiers:
- Best-in-class properties (Top 10%) achieve $1,304+ monthly, often utilizing dynamic pricing and superior guest experiences.
- Strong performing properties (Top 25%) earn $789 or more, indicating effective management and desirable locations/amenities.
- Typical properties (Median) generate around $460 per month, representing the average market performance.
- Entry-level properties (Bottom 25%) see earnings around $216, often with potential for optimization.
Average Monthly Airbnb Earnings Trend in Ribeirão Preto
Ribeirão Preto Airbnb Occupancy Rate Trends (2026)
Maximize your bookings by understanding the Ribeirão Preto STR occupancy trends. Seasonal demand shifts significantly influence how often properties are booked. Typically, Marchsees the highest demand (peak season occupancy), while May experiences the lowest (low season). Effective strategies, like adjusting minimum stays or offering promotions, can boost occupancy during slower periods. Here's how different property tiers perform in Ribeirão Preto:
- Best-in-class properties (Top 10%) achieve 78%+ occupancy, indicating high desirability and potentially optimized availability.
- Strong performing properties (Top 25%) maintain 58% or higher occupancy, suggesting good market fit and guest satisfaction.
- Typical properties (Median) have an occupancy rate around 34%.
- Entry-level properties (Bottom 25%) average 17% occupancy, potentially facing higher vacancy.
Average Monthly Occupancy Rate Trend in Ribeirão Preto
Average Daily Rate (ADR) Airbnb Trends in Ribeirão Preto (2026)
Effective short term rental pricing strategy in Ribeirão Preto involves understanding monthly ADR fluctuations. The Average Daily Rate (ADR) for Airbnb in Ribeirão Preto typically peaks in April and dips lowest during February. Leveraging Airbnb dynamic pricing tools or strategies based on this seasonality can significantly boost revenue. Here's a look at the typical nightly rates achieved:
- Best-in-class properties (Top 10%) command rates of $169+ per night, often due to premium features or locations.
- Strong performing properties (Top 25%) achieve nightly rates of $61 or more.
- Typical properties (Median) charge around $38 per night.
- Entry-level properties (Bottom 25%) earn around $27 per night.
Average Daily Rate (ADR) Trend by Month in Ribeirão Preto
Get Live Ribeirão Preto Market Intelligence 👇

Explore Real-time Analytics
Airbnb Seasonality Analysis & Trends in Ribeirão Preto (2026)
Peak Season (April, December, March)
- Revenue averages $897 per month
- Occupancy rates average 43.7%
- Daily rates average $73
Shoulder Season
- Revenue averages $605 per month
- Occupancy maintains around 37.9%
- Daily rates hold near $71
Low Season (June, August, September)
- Revenue drops to average $529 per month
- Occupancy decreases to average 35.6%
- Daily rates adjust to average $69
Seasonality Insights for Ribeirão Preto
- The Airbnb seasonality in Ribeirão Preto shows highly seasonal trends requiring careful strategy. While the sections above show seasonal averages, it's also insightful to look at the extremes:
- During the high season, the absolute peak month showcases Ribeirão Preto's highest earning potential, with monthly revenues capable of climbing to $1,183, occupancy reaching a high of 49.6%, and ADRs peaking at $83.
- Conversely, the slowest single month of the year, typically falling within the low season, marks the market's lowest point. In this month, revenue might dip to $505, occupancy could drop to 28.6%, and ADRs may adjust down to $60.
- Understanding both the seasonal averages and these monthly peaks and troughs in revenue, occupancy, and ADR is crucial for maximizing your Airbnb profit potential in Ribeirão Preto.
Seasonal Strategies for Maximizing Profit
- Peak Season: Maximize revenue through premium pricing and potentially longer minimum stays. Ensure high availability.
- Low Season: Offer competitive pricing, special promotions (e.g., extended stay discounts), and flexible cancellation policies. Target off-season travelers like remote workers or budget-conscious guests.
- Shoulder Seasons: Implement dynamic pricing that balances peak and low rates. Target weekend travelers or specific events. Offer slightly more flexible terms than peak season.
- Regularly analyze your own performance against these Ribeirão Preto seasonality benchmarks and adjust your pricing and availability strategy accordingly.
Best Areas for Airbnb Investment in Ribeirão Preto (2026)
Exploring the top neighborhoods for short-term rentals in Ribeirão Preto? This section highlights key areas, outlining why they are attractive for hosts and guests, along with notable local attractions. Consider these locations based on your target guest profile and investment strategy.
| Neighborhood / Area | Why Host Here? (Target Guests & Appeal) | Key Attractions & Landmarks |
|---|---|---|
| Jardim Goiás | A prominent neighborhood known for its green spaces and proximity to the city center. Ideal for families and business travelers due to its amenities and peaceful environment. | Jardim Botânico, Parque Maurílio Biagi, Shopping Iguatemi, Cultural Center, Grocery stores and local markets |
| Centro | The heart of Ribeirão Preto, rich in history and culture. Central business district with easy access to major attractions, making it ideal for tourists and short-term renters. | Teatro Pedro II, Museu de Arte de Ribeirão Preto, Praça XV de Novembro, Shopping Santa Úrsula, Restaurants and cafes |
| Jardim São Luiz | Quiet residential neighborhood with family-friendly amenities. Offers a more home-like stay for visitors looking for longer-term rentals or family vacations. | Parque Prefeito Luiz Roberto Jabuti, Local restaurants and schools, Nearby shopping zones, Cultural events and fairs, Community spirit |
| Ribeirânia | An upscale area known for high-end housing and proximity to nature. Popular among executives and affluent tourists looking for serene environments. | Shopping Ribeirão, Couto de Magalhães Park, High-end dining options, Art galleries, Exclusive fitness centers |
| Vila do Golf | A newer development that attracts young professionals and golf enthusiasts. Known for its modern amenities and friendly environment. | Golf courses, Parks, Youth-oriented social venues, Close to main highways, Various restaurants |
| Nova Ribeirânia | Emerging neighborhood with a mix of residential and commercial properties. Great potential for growth and attracts renters looking for new experiences. | New shopping centers, Local parks, Cafés and informal dining, Community activities, Scenic streets |
| Pq. dos Eucaliptos | A highly sought-after area due to its beautiful scenery and family-friendly atmosphere. Ideal for vacation rentals targeting families and nature lovers. | Eucalyptus parks, Nature trails, Kid-friendly facilities, Nearby shopping areas, Cultural attractions |
| Ribeirão Preto Golf Club | A prestigious area focused on leisure and luxury. Attracts tourists interested in golf and high-class amenities, perfect for upscale Airbnb offerings. | Exclusive golf club, Luxury accommodation options, Nearby spas, Fine dining, Beautiful landscapes |
Understanding Airbnb License Requirements & STR Laws in Ribeirão Preto (2026)
While Ribeirão Preto, São Paulo, Brazil currently shows low STR regulations, specific Airbnb license requirements might still exist or change. Always verify the latest short term rental regulations and Airbnb license requirements directly with local government authorities for Ribeirão Preto to ensure full compliance before hosting.
(Source: AirROI data, 2026, based on 0% licensed listings)
Top Performing Airbnb Properties in Ribeirão Preto (2026)
Benchmark your potential! Explore examples of top-performing Airbnb properties in Ribeirão Pretobased on Trailing Twelve Month (TTM) revenue. Analyze their characteristics, revenue, occupancy rate, and ADR to understand what drives success in this market.

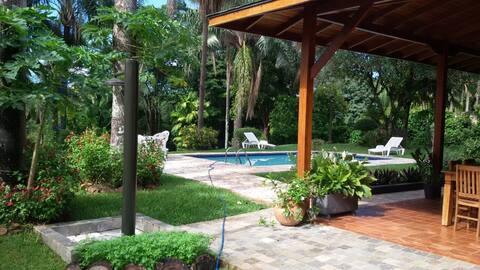
Linda Chácara of 5,000 m2 in Closed Condominium
Entire Place • 4 bedrooms
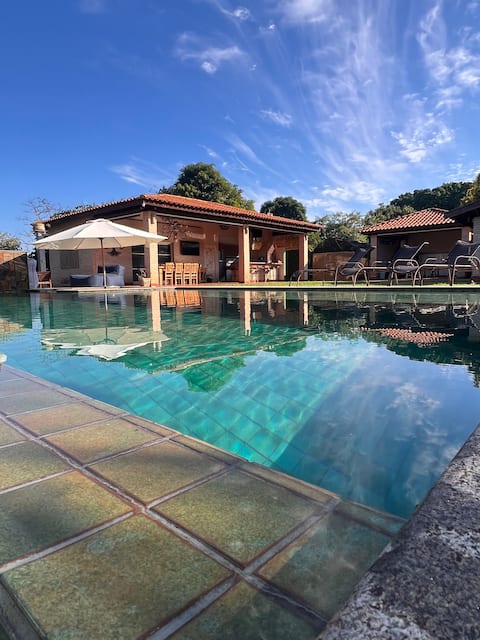
Farm in a gated community 4 bedrooms 4 bathrooms
Entire Place • 4 bedrooms
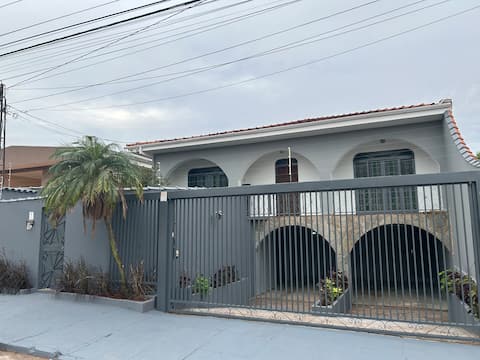
Casa Recreio. Stunning, reserved and exclusive.
Entire Place • 4 bedrooms

CASA ESPETACULAR EM RIBEIRÃO PRETO - ZONA SUL
Entire Place • 4 bedrooms
House with Leisure Area next to the Mall
Entire Place • 5 bedrooms

Beautiful Farm, Complete Leisure, Altinópolis-SP
Entire Place • 12 bedrooms
Note: Performance varies based on location, size, amenities, seasonality, and management quality. Data reflects the past 12 months.
Top Performing Airbnb Hosts in Ribeirão Preto (2026)
Learn from the best! This table showcases top-performing Airbnb hosts in Ribeirão Preto based on the number of properties managed and estimated total revenue over the past year. Analyze their scale and performance metrics.
| Host Name | Properties | Grossing Revenue | Stay Reviews | Avg Rating |
|---|---|---|---|---|
| Casa016 | 109 | $768,529 | 5221 | 4.78/5.0 |
| Gfb | 65 | $267,576 | 1463 | 4.56/5.0 |
| La Home | 15 | $193,386 | 334 | 4.85/5.0 |
| Thiago | 22 | $184,996 | 1230 | 4.87/5.0 |
| Tatiani | 42 | $171,907 | 1188 | 4.91/5.0 |
| Renato | 41 | $166,890 | 2095 | 4.71/5.0 |
| Andrea | 34 | $149,895 | 1292 | 4.92/5.0 |
| Gustavo | 18 | $141,029 | 545 | 4.90/5.0 |
| Beta Barros | 19 | $114,685 | 467 | 4.86/5.0 |
| Marcelo | 20 | $103,523 | 1777 | 4.80/5.0 |
Analyzing the strategies of top hosts, such as their property selection, pricing, and guest communication, can offer valuable lessons for optimizing your own Airbnb operations in Ribeirão Preto.
Dive Deeper: Advanced Ribeirão Preto STR Market Data (2026)
Ready to unlock more insights? AirROI provides access to advanced metrics and comprehensive Airbnb data for Ribeirão Preto. Explore detailed analytics beyond this report to refine your investment strategy, optimize pricing, and maximize your vacation rental profits.
Explore Advanced MetricsRibeirão Preto Short-Term Rental Market Composition (2026): Property & Room Types
Room Type Distribution
Property Type Distribution
Market Composition Insights for Ribeirão Preto
- The Ribeirão Preto Airbnb market composition is heavily skewed towards Entire Home/Apt listings, which make up 88.3% of the 1,432 active rentals. This indicates strong guest preference for privacy and space.
- Looking at the property type distribution in Ribeirão Preto, Apartment/Condo properties are the most common (71.4%), reflecting the local real estate landscape.
- Houses represent a significant 25.1% portion, catering likely to families or larger groups.
- Smaller segments like hotel/boutique, others, outdoor/unique (combined 3.5%) offer potential for unique stay experiences.
Ribeirão Preto Airbnb Room Capacity Analysis (2026): Bedroom Distribution
Distribution of Listings by Number of Bedrooms
Room Capacity Insights for Ribeirão Preto
- The dominant room capacity in Ribeirão Preto is 1 bedroom listings, making up 55.7% of the market. This suggests a strong demand for properties suitable for couples or solo travelers.
- Together, 1 bedroom and 2 bedrooms properties represent 75.5% of the active Airbnb listings in Ribeirão Preto, indicating a high concentration in these sizes.
- With over half the market (55.7%) consisting of studios or 1-bedroom units, Ribeirão Preto is particularly well-suited for individuals or couples.
Ribeirão Preto Vacation Rental Guest Capacity Trends (2026)
Distribution of Listings by Guest Capacity
Guest Capacity Insights for Ribeirão Preto
- The most common guest capacity trend in Ribeirão Preto vacation rentals is listings accommodating 2 guests (29.1%). This suggests the primary traveler segment is likely couples or solo travelers.
- Properties designed for 2 guests and 4 guests dominate the Ribeirão Preto STR market, accounting for 52.1% of listings.
- 20.6% of properties accommodate 6+ guests, serving the market segment for larger families or group travel in Ribeirão Preto.
- On average, properties in Ribeirão Preto are equipped to host 3.6 guests.
Ribeirão Preto Airbnb Booking Patterns (2026): Available vs. Booked Days
Available Days Distribution
Booked Days Distribution
Booking Pattern Insights for Ribeirão Preto
- The most common availability pattern in Ribeirão Preto falls within the 271-366 days range, representing 54.9% of listings. This suggests many properties have significant open periods on their calendars.
- Approximately 84.6% of listings show high availability (181+ days open annually), indicating potential for increased bookings or specific owner usage patterns.
- For booked days, the 91-180 days range is most frequent in Ribeirão Preto (29.9%), reflecting common guest stay durations or potential owner blocking patterns.
- A notable 16.9% of properties secure long booking periods (181+ days booked per year), highlighting successful long-term rental strategies or significant owner usage.
Ribeirão Preto Airbnb Minimum Stay Requirements Analysis
Distribution of Listings by Minimum Night Requirement
1 Night
658 listings
45.9% of total
2 Nights
241 listings
16.8% of total
3 Nights
47 listings
3.3% of total
4-6 Nights
47 listings
3.3% of total
7-29 Nights
31 listings
2.2% of total
30+ Nights
408 listings
28.5% of total
Key Insights
- The most prevalent minimum stay requirement in Ribeirão Preto is 1 Night, adopted by 45.9% of listings. This highlights the market's preference for shorter, flexible bookings.
- A strong majority (62.7%) of the Ribeirão Preto Airbnb data shows acceptance of very short stays (1-2 nights), indicating a dynamic, high-turnover market.
- A significant segment (28.5%) caters to monthly stays (30+ nights) in Ribeirão Preto, pointing to opportunities in the extended-stay market.
Recommendations
- Align with the market by considering a 1 Night minimum stay, as 45.9% of Ribeirão Preto hosts use this setting.
- Explore offering discounts for stays of 30+ nights to attract the 28.5% of the market seeking extended stays.
- Adjust minimum nights based on seasonality – potentially shorter during low season and longer during peak demand periods in Ribeirão Preto.
Ribeirão Preto Airbnb Cancellation Policy Trends Analysis (2026)
Limited
10 listings
0.7% of total
Flexible
411 listings
28.9% of total
Moderate
520 listings
36.5% of total
Firm
341 listings
23.9% of total
Strict
142 listings
10% of total
Cancellation Policy Insights for Ribeirão Preto
- The prevailing Airbnb cancellation policy trend in Ribeirão Preto is Moderate, used by 36.5% of listings.
- There's a relatively balanced mix between guest-friendly (65.4%) and stricter (33.9%) policies, offering choices for different guest needs.
Recommendations for Hosts
- Consider adopting a Moderate policy to align with the 36.5% market standard in Ribeirão Preto.
- Using a Strict policy might deter some guests, as only 10% of listings use it. Evaluate if potential revenue protection outweighs possible lower booking rates.
- Regularly review your cancellation policy against competitors and market demand shifts in Ribeirão Preto.
Ribeirão Preto STR Booking Lead Time Analysis (2026)
Average Booking Lead Time by Month
Booking Lead Time Insights for Ribeirão Preto
- The overall average booking lead time for vacation rentals in Ribeirão Preto is 28 days.
- Guests book furthest in advance for stays during April (average 47 days), likely coinciding with peak travel demand or local events.
- The shortest booking windows occur for stays in March (average 15 days), indicating more last-minute travel plans during this time.
- Seasonally, Spring (29 days avg.) sees the longest lead times, while Fall (19 days avg.) has the shortest, reflecting typical travel planning cycles.
Recommendations for Hosts
- Use the overall average lead time (28 days) as a baseline for your pricing and availability strategy in Ribeirão Preto.
- For April stays, consider implementing length-of-stay discounts or slightly higher rates for bookings made less than 47 days out to capitalize on advance planning.
- Target marketing efforts for the Spring season well in advance (at least 29 days) to capture early planners.
- Monitor your own booking lead times against these Ribeirão Preto averages to identify opportunities for dynamic pricing adjustments.
Popular & Essential Airbnb Amenities in Ribeirão Preto (2026)
Amenity Prevalence
Amenity Insights for Ribeirão Preto
- Essential amenities in Ribeirão Preto that guests expect include: Wifi, Kitchen. Lacking these (any) could significantly impact bookings.
- Popular amenities like TV, Free parking on premises, Air conditioning are common but not universal. Offering these can provide a competitive edge.
Recommendations for Hosts
- Ensure your listing includes all essential amenities for Ribeirão Preto: Wifi, Kitchen.
- Prioritize adding missing essentials: Wifi, Kitchen.
- Consider adding popular differentiators like TV or Free parking on premises to increase appeal.
- Highlight unique or less common amenities you offer (e.g., hot tub, dedicated workspace, EV charger) in your listing description and photos.
- Regularly check competitor amenities in Ribeirão Preto to stay competitive.
Ribeirão Preto Airbnb Guest Demographics & Profile Analysis (2026)
Guest Profile Summary for Ribeirão Preto
- The typical guest profile for Airbnb in Ribeirão Preto consists of primarily domestic travelers (96%), often arriving from nearby São Paulo, typically belonging to the Post-2000s (Gen Z/Alpha) group (50%), primarily speaking Portuguese or English.
- Domestic travelers account for 96.2% of guests.
- Key international markets include Brazil (96.2%) and United States (0.9%).
- Top languages spoken are Portuguese (49.7%) followed by English (29.3%).
- A significant demographic segment is the Post-2000s (Gen Z/Alpha) group, representing 50% of guests.
Recommendations for Hosts
- Target domestic marketing efforts towards travelers from São Paulo and Ribeirão Preto.
- Tailor amenities and listing descriptions to appeal to the dominant Post-2000s (Gen Z/Alpha) demographic (e.g., highlight fast WiFi, smart home features, local guides).
- Highlight unique local experiences or amenities relevant to the primary guest profile.
- Consider seasonal promotions aligned with peak travel times for key origin markets.
Nearby Short-Term Rental Market Comparison
How does the Ribeirão Preto Airbnb market stack up against its neighbors? Compare key performance metrics like average monthly revenue, ADR, and occupancy rates in surrounding areas to understand the broader regional STR landscape.
| Market | Active Properties | Monthly Revenue | Daily Rate | Avg. Occupancy |
|---|---|---|---|---|
| Tuiuti | 18 | $1,686 | $156.45 | 30% |
| Morungaba | 31 | $1,435 | $263.39 | 27% |
| Valinhos | 61 | $1,370 | $176.28 | 33% |
| Itatiba | 171 | $1,331 | $177.58 | 29% |
| Vargem | 48 | $1,319 | $190.42 | 28% |
| Cássia | 28 | $1,293 | $132.97 | 34% |
| Pedra Bela | 27 | $1,225 | $135.48 | 32% |
| Cosmópolis | 16 | $1,036 | $115.33 | 31% |
| Nova Odessa | 17 | $1,025 | $106.30 | 38% |
| Jaguariúna | 58 | $923 | $112.17 | 34% |