Quadra Airbnb Market Analysis 2026: Short Term Rental Data & Vacation Rental Statistics in São Paulo, Brazil
Is Airbnb profitable in Quadra in 2026? Explore comprehensive Airbnb analytics for Quadra, São Paulo, Brazil to uncover income potential. This 2026 STR market report for Quadra, based on AirROI data from February 2025 to January 2026, reveals key trends in the niche market of 56 active listings.
Whether you're considering an Airbnb investment in Quadra, optimizing your existing vacation rental, or exploring rental arbitrage opportunities, understanding the Quadra Airbnb data is crucial. Leveraging the low regulation environment is key to maximizing your short term rental income potential. Let's dive into the specifics.
Key Quadra Airbnb Performance Metrics Overview
Monthly Airbnb Revenue Variations & Income Potential in Quadra (2026)
Understanding the monthly revenue variations for Airbnb listings in Quadra is key to maximizing your short term rental income potential. Seasonality significantly impacts earnings. Our analysis, based on data from the past 12 months, shows that the peak revenue month for STRs in Quadra is typically May, while September often presents the lowest earnings, highlighting opportunities for strategic pricing adjustments during shoulder and low seasons. Explore the typical Airbnb income in Quadra across different performance tiers:
- Best-in-class properties (Top 10%) achieve $2,671+ monthly, often utilizing dynamic pricing and superior guest experiences.
- Strong performing properties (Top 25%) earn $1,673 or more, indicating effective management and desirable locations/amenities.
- Typical properties (Median) generate around $812 per month, representing the average market performance.
- Entry-level properties (Bottom 25%) see earnings around $428, often with potential for optimization.
Average Monthly Airbnb Earnings Trend in Quadra
Quadra Airbnb Occupancy Rate Trends (2026)
Maximize your bookings by understanding the Quadra STR occupancy trends. Seasonal demand shifts significantly influence how often properties are booked. Typically, Marchsees the highest demand (peak season occupancy), while June experiences the lowest (low season). Effective strategies, like adjusting minimum stays or offering promotions, can boost occupancy during slower periods. Here's how different property tiers perform in Quadra:
- Best-in-class properties (Top 10%) achieve 55%+ occupancy, indicating high desirability and potentially optimized availability.
- Strong performing properties (Top 25%) maintain 36% or higher occupancy, suggesting good market fit and guest satisfaction.
- Typical properties (Median) have an occupancy rate around 21%.
- Entry-level properties (Bottom 25%) average 11% occupancy, potentially facing higher vacancy.
Average Monthly Occupancy Rate Trend in Quadra
Average Daily Rate (ADR) Airbnb Trends in Quadra (2026)
Effective short term rental pricing strategy in Quadra involves understanding monthly ADR fluctuations. The Average Daily Rate (ADR) for Airbnb in Quadra typically peaks in December and dips lowest during March. Leveraging Airbnb dynamic pricing tools or strategies based on this seasonality can significantly boost revenue. Here's a look at the typical nightly rates achieved:
- Best-in-class properties (Top 10%) command rates of $296+ per night, often due to premium features or locations.
- Strong performing properties (Top 25%) achieve nightly rates of $174 or more.
- Typical properties (Median) charge around $130 per night.
- Entry-level properties (Bottom 25%) earn around $105 per night.
Average Daily Rate (ADR) Trend by Month in Quadra
Get Live Quadra Market Intelligence 👇

Explore Real-time Analytics
Airbnb Seasonality Analysis & Trends in Quadra (2026)
Peak Season (May, December, March)
- Revenue averages $1,650 per month
- Occupancy rates average 29.5%
- Daily rates average $159
Shoulder Season
- Revenue averages $1,299 per month
- Occupancy maintains around 26.3%
- Daily rates hold near $157
Low Season (August, September, October)
- Revenue drops to average $943 per month
- Occupancy decreases to average 21.0%
- Daily rates adjust to average $158
Seasonality Insights for Quadra
- The Airbnb seasonality in Quadra shows moderate seasonality with distinct peak and low periods. While the sections above show seasonal averages, it's also insightful to look at the extremes:
- During the high season, the absolute peak month showcases Quadra's highest earning potential, with monthly revenues capable of climbing to $1,733, occupancy reaching a high of 32.0%, and ADRs peaking at $189.
- Conversely, the slowest single month of the year, typically falling within the low season, marks the market's lowest point. In this month, revenue might dip to $854, occupancy could drop to 19.3%, and ADRs may adjust down to $143.
- Understanding both the seasonal averages and these monthly peaks and troughs in revenue, occupancy, and ADR is crucial for maximizing your Airbnb profit potential in Quadra.
Seasonal Strategies for Maximizing Profit
- Peak Season: Maximize revenue through premium pricing and potentially longer minimum stays. Ensure high availability.
- Low Season: Offer competitive pricing, special promotions (e.g., extended stay discounts), and flexible cancellation policies. Target off-season travelers like remote workers or budget-conscious guests.
- Shoulder Seasons: Implement dynamic pricing that balances peak and low rates. Target weekend travelers or specific events. Offer slightly more flexible terms than peak season.
- Regularly analyze your own performance against these Quadra seasonality benchmarks and adjust your pricing and availability strategy accordingly.
Best Areas for Airbnb Investment in Quadra (2026)
Exploring the top neighborhoods for short-term rentals in Quadra? This section highlights key areas, outlining why they are attractive for hosts and guests, along with notable local attractions. Consider these locations based on your target guest profile and investment strategy.
| Neighborhood / Area | Why Host Here? (Target Guests & Appeal) | Key Attractions & Landmarks |
|---|---|---|
| Mooca | A vibrant neighborhood with a rich Italian heritage, known for its local markets and cultural diversity. It attracts families and young professionals looking for a lively but community-oriented environment. | Mooca Plaza Shopping, Parque da Mooca, Museu da Imigração, Casa do Pão de Queijo, Lavradio Street Fair |
| Vila Madalena | A bohemian neighborhood renowned for its artsy vibe, street art, and lively nightlife. It's a favorite among young travelers seeking culture, trendy bars, and artistic experiences. | Beco do Batman, Vila Madalena's street art, Bar Astor, Praca do Pôr do Sol, Pâtisserie Douce France |
| Jardins | An upscale neighborhood known for its luxury shopping, fine dining, and proximity to several cultural landmarks. Popular with affluent travelers and those seeking a premium experience. | Avenida Paulista, Ibirapuera Park, Museu de Arte de São Paulo (MASP), Shopping Cidade Jardim, Parque Trianon |
| Pinheiros | A trendy, up-and-coming area with a mix of local shops, restaurants, and cultural venues. Perfect for younger tourists or those looking to explore local cuisine and nightlife. | Praça Benedito Calopsita, Rua dos Pinheiros, Instituto Tomie Ohtake, Beco do Batman, Carnaval de Pinheiros |
| Liberdade | The Japanese district of São Paulo, offering a unique cultural experience with its shops, restaurants, and festivals. Attracts both local and international travelers interested in exploring diverse cultures. | Liberdade Market, Buddhist temples, Japanese festivals, Kiyohara sweets shop, Asian restaurants |
| Santana | A family-friendly area with abundant parks and a relaxed atmosphere, making it a good choice for those traveling with children or seeking a quieter stay in the city. | Parque da Juventude, Shopping Center Norte, Metrô Santana, Feira de Artesanato de Santana, São Paulo North Shopping |
| Centro | The historical center of São Paulo, bustling with business, culture, and history. It appeals to travelers interested in the rich heritage and vibrant street life of the city. | Theatro Municipal, Pinacoteca do Estado, Mercadão Municipal, Viaduto do Chá, Praça da Sé |
| Bela Vista | A culturally diverse area, home to a vibrant restaurant scene and cultural institutions. Attractive to foodies and those looking for immersive culinary experiences. | Rua Augusta, Sesc Consolação, Casa das Rosas, Beco do Batman, Cultural Center Banco do Brasil |
Understanding Airbnb License Requirements & STR Laws in Quadra (2026)
While Quadra, São Paulo, Brazil currently shows low STR regulations, specific Airbnb license requirements might still exist or change. Always verify the latest short term rental regulations and Airbnb license requirements directly with local government authorities for Quadra to ensure full compliance before hosting.
(Source: AirROI data, 2026, finding no licensed listings among those analyzed)
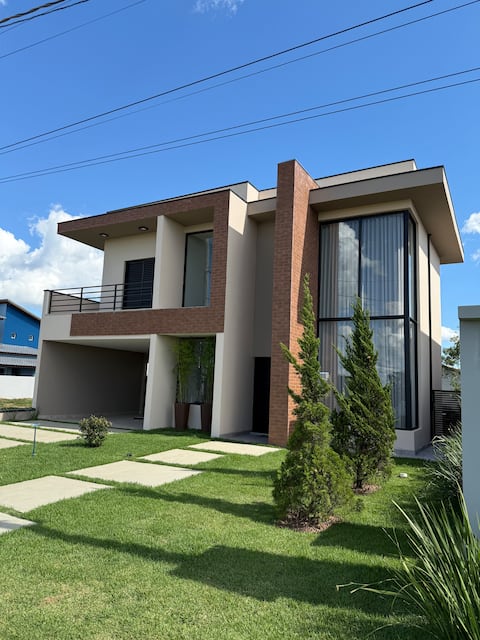
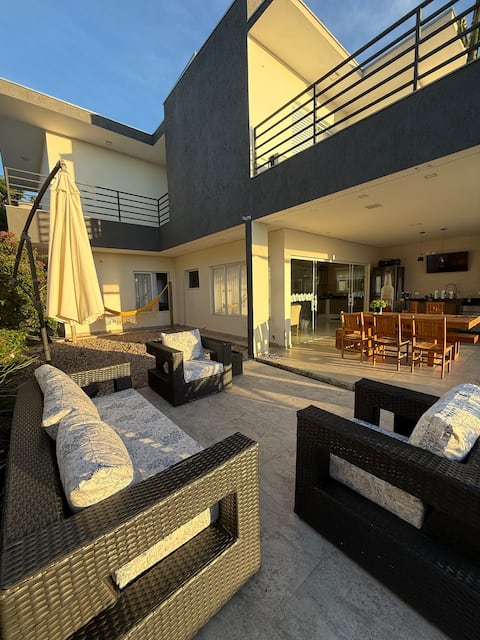
Top Performing Airbnb Properties in Quadra (2026)
Benchmark your potential! Explore examples of top-performing Airbnb properties in Quadrabased on Trailing Twelve Month (TTM) revenue. Analyze their characteristics, revenue, occupancy rate, and ADR to understand what drives success in this market.

Cinematográfico, Encantador e Paradisíaco!
Entire Place • 13 bedrooms

Dream house, relax Ninho Verde 1 with Pool
Entire Place • 3 bedrooms
Country Mansion with Heated Pool
Entire Place • 4 bedrooms
Country Mansion with Heated Pool
Entire Place • 3 bedrooms

Ninho Verde I - Heated Pool and Playground
Entire Place • 3 bedrooms

Cozy Farmhouse with Pool and Wi-Fi
Entire Place • 4 bedrooms
Note: Performance varies based on location, size, amenities, seasonality, and management quality. Data reflects the past 12 months.
Top Performing Airbnb Hosts in Quadra (2026)
Learn from the best! This table showcases top-performing Airbnb hosts in Quadra based on the number of properties managed and estimated total revenue over the past year. Analyze their scale and performance metrics.
| Host Name | Properties | Grossing Revenue | Stay Reviews | Avg Rating |
|---|---|---|---|---|
| Charles | 4 | $127,622 | 55 | 5.00/5.0 |
| Franciele | 2 | $58,764 | 157 | 4.92/5.0 |
| Danilo | 1 | $32,612 | 89 | 4.99/5.0 |
| Emanuela | 1 | $25,284 | 30 | 4.93/5.0 |
| José | 1 | $19,375 | 81 | 4.85/5.0 |
| Priscila | 1 | $18,184 | 3 | 5.00/5.0 |
| Michel | 1 | $17,567 | 129 | 4.98/5.0 |
| Natalia | 1 | $17,406 | 19 | 5.00/5.0 |
| Flavio | 1 | $16,393 | 38 | 4.97/5.0 |
| Marcelo | 1 | $12,138 | 8 | 5.00/5.0 |
Analyzing the strategies of top hosts, such as their property selection, pricing, and guest communication, can offer valuable lessons for optimizing your own Airbnb operations in Quadra.
Dive Deeper: Advanced Quadra STR Market Data (2026)
Ready to unlock more insights? AirROI provides access to advanced metrics and comprehensive Airbnb data for Quadra. Explore detailed analytics beyond this report to refine your investment strategy, optimize pricing, and maximize your vacation rental profits.
Explore Advanced MetricsQuadra Short-Term Rental Market Composition (2026): Property & Room Types
Room Type Distribution
Property Type Distribution
Market Composition Insights for Quadra
- The Quadra Airbnb market composition is heavily skewed towards Entire Home/Apt listings, which make up 100% of the 56 active rentals. This indicates strong guest preference for privacy and space.
- Looking at the property type distribution in Quadra, House properties are the most common (98.2%), reflecting the local real estate landscape.
- Houses represent a significant 98.2% portion, catering likely to families or larger groups.
- Smaller segments like outdoor/unique (combined 1.8%) offer potential for unique stay experiences.
Quadra Airbnb Room Capacity Analysis (2026): Bedroom Distribution
Distribution of Listings by Number of Bedrooms
Room Capacity Insights for Quadra
- The dominant room capacity in Quadra is 3 bedrooms listings, making up 76.8% of the market. This suggests a strong demand for properties suitable for families or small groups.
- Together, 3 bedrooms and 4 bedrooms properties represent 87.5% of the active Airbnb listings in Quadra, indicating a high concentration in these sizes.
- A significant 94.6% of listings offer 3+ bedrooms, catering to larger groups and families seeking more space in Quadra.
Quadra Vacation Rental Guest Capacity Trends (2026)
Distribution of Listings by Guest Capacity
Guest Capacity Insights for Quadra
- The most common guest capacity trend in Quadra vacation rentals is listings accommodating 8+ guests (96.4%). This suggests the primary traveler segment is likely larger groups.
- Properties designed for 8+ guests and 6 guests dominate the Quadra STR market, accounting for 100.0% of listings.
- 100.0% of properties accommodate 6+ guests, serving the market segment for larger families or group travel in Quadra.
- On average, properties in Quadra are equipped to host 7.9 guests.
Quadra Airbnb Booking Patterns (2026): Available vs. Booked Days
Available Days Distribution
Booked Days Distribution
Booking Pattern Insights for Quadra
- The most common availability pattern in Quadra falls within the 271-366 days range, representing 73.2% of listings. This suggests many properties have significant open periods on their calendars.
- Approximately 98.2% of listings show high availability (181+ days open annually), indicating potential for increased bookings or specific owner usage patterns.
- For booked days, the 1-30 days range is most frequent in Quadra (48.2%), reflecting common guest stay durations or potential owner blocking patterns.
- A notable 1.8% of properties secure long booking periods (181+ days booked per year), highlighting successful long-term rental strategies or significant owner usage.
Quadra Airbnb Minimum Stay Requirements Analysis
Distribution of Listings by Minimum Night Requirement
1 Night
6 listings
10.7% of total
2 Nights
34 listings
60.7% of total
3 Nights
1 listings
1.8% of total
4-6 Nights
1 listings
1.8% of total
7-29 Nights
1 listings
1.8% of total
30+ Nights
13 listings
23.2% of total
Key Insights
- The most prevalent minimum stay requirement in Quadra is 2 Nights, adopted by 60.7% of listings. This highlights the market's preference for shorter, flexible bookings.
- A strong majority (71.4%) of the Quadra Airbnb data shows acceptance of very short stays (1-2 nights), indicating a dynamic, high-turnover market.
- A significant segment (23.2%) caters to monthly stays (30+ nights) in Quadra, pointing to opportunities in the extended-stay market.
Recommendations
- Align with the market by considering a 2 Nights minimum stay, as 60.7% of Quadra hosts use this setting.
- If feasible, allowing 1-night stays, especially midweek or during low season, could capture last-minute bookings, as only 10.7% currently do.
- A 2-night minimum appears standard (60.7%). Consider this for weekends or peak periods.
- Explore offering discounts for stays of 30+ nights to attract the 23.2% of the market seeking extended stays.
- Adjust minimum nights based on seasonality – potentially shorter during low season and longer during peak demand periods in Quadra.
Quadra Airbnb Cancellation Policy Trends Analysis (2026)
Super Strict 30 Days
1 listings
1.8% of total
Flexible
10 listings
17.9% of total
Moderate
17 listings
30.4% of total
Firm
21 listings
37.5% of total
Strict
7 listings
12.5% of total
Cancellation Policy Insights for Quadra
- The prevailing Airbnb cancellation policy trend in Quadra is Firm, used by 37.5% of listings.
- There's a relatively balanced mix between guest-friendly (48.3%) and stricter (50.0%) policies, offering choices for different guest needs.
Recommendations for Hosts
- Consider adopting a Firm policy to align with the 37.5% market standard in Quadra.
- Using a Strict policy might deter some guests, as only 12.5% of listings use it. Evaluate if potential revenue protection outweighs possible lower booking rates.
- Regularly review your cancellation policy against competitors and market demand shifts in Quadra.
Quadra STR Booking Lead Time Analysis (2026)
Average Booking Lead Time by Month
Booking Lead Time Insights for Quadra
- The overall average booking lead time for vacation rentals in Quadra is 44 days.
- Guests book furthest in advance for stays during December (average 92 days), likely coinciding with peak travel demand or local events.
- The shortest booking windows occur for stays in July (average 11 days), indicating more last-minute travel plans during this time.
- Seasonally, Winter (51 days avg.) sees the longest lead times, while Summer (16 days avg.) has the shortest, reflecting typical travel planning cycles.
Recommendations for Hosts
- Use the overall average lead time (44 days) as a baseline for your pricing and availability strategy in Quadra.
- For December stays, consider implementing length-of-stay discounts or slightly higher rates for bookings made less than 92 days out to capitalize on advance planning.
- During July, focus on last-minute booking availability and promotions, as guests book with very short notice (11 days avg.).
- Target marketing efforts for the Winter season well in advance (at least 51 days) to capture early planners.
- Monitor your own booking lead times against these Quadra averages to identify opportunities for dynamic pricing adjustments.
Popular & Essential Airbnb Amenities in Quadra (2026)
Amenity Prevalence
Amenity Insights for Quadra
- Essential amenities in Quadra that guests expect include: Kitchen, TV, Wifi, Pool, Free parking on premises, BBQ grill. Lacking these (any) could significantly impact bookings.
- Popular amenities like Dishes and silverware, Refrigerator, Cooking basics are common but not universal. Offering these can provide a competitive edge.
Recommendations for Hosts
- Ensure your listing includes all essential amenities for Quadra: Kitchen, TV, Wifi, Pool, Free parking on premises, BBQ grill.
- Prioritize adding missing essentials: Pool, Free parking on premises, BBQ grill.
- Consider adding popular differentiators like Dishes and silverware or Refrigerator to increase appeal.
- Highlight unique or less common amenities you offer (e.g., hot tub, dedicated workspace, EV charger) in your listing description and photos.
- Regularly check competitor amenities in Quadra to stay competitive.
Quadra Airbnb Guest Demographics & Profile Analysis (2026)
Guest Profile Summary for Quadra
- The typical guest profile for Airbnb in Quadra consists of primarily domestic travelers (96%), often arriving from nearby São Paulo, typically belonging to the Post-2000s (Gen Z/Alpha) group (50%), primarily speaking Portuguese or English.
- Domestic travelers account for 95.8% of guests.
- Key international markets include Brazil (95.8%) and United States (0.8%).
- Top languages spoken are Portuguese (53.2%) followed by English (31.2%).
- A significant demographic segment is the Post-2000s (Gen Z/Alpha) group, representing 50% of guests.
Recommendations for Hosts
- Target domestic marketing efforts towards travelers from São Paulo and Santo André.
- Tailor amenities and listing descriptions to appeal to the dominant Post-2000s (Gen Z/Alpha) demographic (e.g., highlight fast WiFi, smart home features, local guides).
- Highlight unique local experiences or amenities relevant to the primary guest profile.
- Consider seasonal promotions aligned with peak travel times for key origin markets.
Nearby Short-Term Rental Market Comparison
How does the Quadra Airbnb market stack up against its neighbors? Compare key performance metrics like average monthly revenue, ADR, and occupancy rates in surrounding areas to understand the broader regional STR landscape.
| Market | Active Properties | Monthly Revenue | Daily Rate | Avg. Occupancy |
|---|---|---|---|---|
| Arandu | 36 | $1,896 | $275.63 | 25% |
| Itupeva | 136 | $1,561 | $225.82 | 28% |
| Itaí | 88 | $1,300 | $248.75 | 21% |
| Elias Fausto | 13 | $1,296 | $143.78 | 30% |
| Porto Feliz | 69 | $1,279 | $260.86 | 27% |
| Tietê | 14 | $1,245 | $237.69 | 25% |
| Mairinque | 347 | $1,200 | $177.68 | 27% |
| Itu | 272 | $1,169 | $198.29 | 26% |
| Paranapanema | 169 | $1,088 | $188.08 | 25% |
| Vargem Grande Paulista | 44 | $1,072 | $168.35 | 32% |