Pedro de Toledo Airbnb Market Analysis 2026: Short Term Rental Data & Vacation Rental Statistics in São Paulo, Brazil
Is Airbnb profitable in Pedro de Toledo in 2026? Explore comprehensive Airbnb analytics for Pedro de Toledo, São Paulo, Brazil to uncover income potential. This 2026 STR market report for Pedro de Toledo, based on AirROI data from February 2025 to January 2026, reveals key trends in the niche market of 22 active listings.
Whether you're considering an Airbnb investment in Pedro de Toledo, optimizing your existing vacation rental, or exploring rental arbitrage opportunities, understanding the Pedro de Toledo Airbnb data is crucial. Leveraging the low regulation environment is key to maximizing your short term rental income potential. Let's dive into the specifics.
Key Pedro de Toledo Airbnb Performance Metrics Overview
Monthly Airbnb Revenue Variations & Income Potential in Pedro de Toledo (2026)
Understanding the monthly revenue variations for Airbnb listings in Pedro de Toledo is key to maximizing your short term rental income potential. Seasonality significantly impacts earnings. Our analysis, based on data from the past 12 months, shows that the peak revenue month for STRs in Pedro de Toledo is typically December, while August often presents the lowest earnings, highlighting opportunities for strategic pricing adjustments during shoulder and low seasons. Explore the typical Airbnb income in Pedro de Toledo across different performance tiers:
- Best-in-class properties (Top 10%) achieve $1,489+ monthly, often utilizing dynamic pricing and superior guest experiences.
- Strong performing properties (Top 25%) earn $953 or more, indicating effective management and desirable locations/amenities.
- Typical properties (Median) generate around $342 per month, representing the average market performance.
- Entry-level properties (Bottom 25%) see earnings around $152, often with potential for optimization.
Average Monthly Airbnb Earnings Trend in Pedro de Toledo
Pedro de Toledo Airbnb Occupancy Rate Trends (2026)
Maximize your bookings by understanding the Pedro de Toledo STR occupancy trends. Seasonal demand shifts significantly influence how often properties are booked. Typically, Aprilsees the highest demand (peak season occupancy), while August experiences the lowest (low season). Effective strategies, like adjusting minimum stays or offering promotions, can boost occupancy during slower periods. Here's how different property tiers perform in Pedro de Toledo:
- Best-in-class properties (Top 10%) achieve 38%+ occupancy, indicating high desirability and potentially optimized availability.
- Strong performing properties (Top 25%) maintain 26% or higher occupancy, suggesting good market fit and guest satisfaction.
- Typical properties (Median) have an occupancy rate around 13%.
- Entry-level properties (Bottom 25%) average 7% occupancy, potentially facing higher vacancy.
Average Monthly Occupancy Rate Trend in Pedro de Toledo
Average Daily Rate (ADR) Airbnb Trends in Pedro de Toledo (2026)
Effective short term rental pricing strategy in Pedro de Toledo involves understanding monthly ADR fluctuations. The Average Daily Rate (ADR) for Airbnb in Pedro de Toledo typically peaks in December and dips lowest during February. Leveraging Airbnb dynamic pricing tools or strategies based on this seasonality can significantly boost revenue. Here's a look at the typical nightly rates achieved:
- Best-in-class properties (Top 10%) command rates of $202+ per night, often due to premium features or locations.
- Strong performing properties (Top 25%) achieve nightly rates of $163 or more.
- Typical properties (Median) charge around $107 per night.
- Entry-level properties (Bottom 25%) earn around $62 per night.
Average Daily Rate (ADR) Trend by Month in Pedro de Toledo
Get Live Pedro de Toledo Market Intelligence 👇

Explore Real-time Analytics
Airbnb Seasonality Analysis & Trends in Pedro de Toledo (2026)
Peak Season (December, April, March)
- Revenue averages $980 per month
- Occupancy rates average 27.6%
- Daily rates average $120
Shoulder Season
- Revenue averages $595 per month
- Occupancy maintains around 15.6%
- Daily rates hold near $120
Low Season (February, July, August)
- Revenue drops to average $338 per month
- Occupancy decreases to average 14.3%
- Daily rates adjust to average $114
Seasonality Insights for Pedro de Toledo
- The Airbnb seasonality in Pedro de Toledo shows highly seasonal trends requiring careful strategy. While the sections above show seasonal averages, it's also insightful to look at the extremes:
- During the high season, the absolute peak month showcases Pedro de Toledo's highest earning potential, with monthly revenues capable of climbing to $1,042, occupancy reaching a high of 31.7%, and ADRs peaking at $130.
- Conversely, the slowest single month of the year, typically falling within the low season, marks the market's lowest point. In this month, revenue might dip to $242, occupancy could drop to 9.1%, and ADRs may adjust down to $113.
- Understanding both the seasonal averages and these monthly peaks and troughs in revenue, occupancy, and ADR is crucial for maximizing your Airbnb profit potential in Pedro de Toledo.
Seasonal Strategies for Maximizing Profit
- Peak Season: Maximize revenue through premium pricing and potentially longer minimum stays. Ensure high availability.
- Low Season: Offer competitive pricing, special promotions (e.g., extended stay discounts), and flexible cancellation policies. Target off-season travelers like remote workers or budget-conscious guests.
- Shoulder Seasons: Implement dynamic pricing that balances peak and low rates. Target weekend travelers or specific events. Offer slightly more flexible terms than peak season.
- Regularly analyze your own performance against these Pedro de Toledo seasonality benchmarks and adjust your pricing and availability strategy accordingly.
Best Areas for Airbnb Investment in Pedro de Toledo (2026)
Exploring the top neighborhoods for short-term rentals in Pedro de Toledo? This section highlights key areas, outlining why they are attractive for hosts and guests, along with notable local attractions. Consider these locations based on your target guest profile and investment strategy.
| Neighborhood / Area | Why Host Here? (Target Guests & Appeal) | Key Attractions & Landmarks |
|---|---|---|
| Centro | The historic center of Pedro de Toledo, offering a mix of culture and history. Attracts visitors interested in local architecture and traditional events. | Pedro de Toledo Square, Local cultural festivals, Historical buildings |
| Horto Florestal | A green area ideal for nature lovers, offering outdoor activities and a peaceful atmosphere. Popular among families and tourists seeking relaxation. | Horto Florestal Park, Walking trails, Picnic areas |
| Praia de São Julião | A beautiful beach area known for its tranquility and natural beauty. Great for tourists who want a relaxing beach getaway. | São Julião Beach, Beachfront restaurants, Watersport activities |
| Jardim Primavera | A family-friendly neighborhood with parks and schools, making it a great spot for longer stays and family visits. | Local parks, Community events, Family-friendly restaurants |
| Bairro Vila Ema | A residential neighborhood that offers local dining and shopping experiences, ideal for travelers looking for an authentic local experience. | Local markets, Restaurants, Cafes with local cuisine |
| Lagoa do Cão | A scenic lake area that offers boating and fishing opportunities, appealing to outdoor enthusiasts and those looking for a peaceful retreat. | Lagoa do Cão, Fishing spots, Nature trails |
| Morro do Serrote | Known for its hiking trails and panoramic views of the region, it's ideal for adventure seekers and nature lovers. | Hiking trails, Viewpoints, Nature observation |
| Bela Vista | A neighborhood known for its vibrant community and local culture, popular for guests wishing to explore local art and cuisine. | Art galleries, Cultural events, Local festivals |
Understanding Airbnb License Requirements & STR Laws in Pedro de Toledo (2026)
While Pedro de Toledo, São Paulo, Brazil currently shows low STR regulations, specific Airbnb license requirements might still exist or change. Always verify the latest short term rental regulations and Airbnb license requirements directly with local government authorities for Pedro de Toledo to ensure full compliance before hosting.
(Source: AirROI data, 2026, based on 5% licensed listings)
Top Performing Airbnb Properties in Pedro de Toledo (2026)
Benchmark your potential! Explore examples of top-performing Airbnb properties in Pedro de Toledobased on Trailing Twelve Month (TTM) revenue. Analyze their characteristics, revenue, occupancy rate, and ADR to understand what drives success in this market.
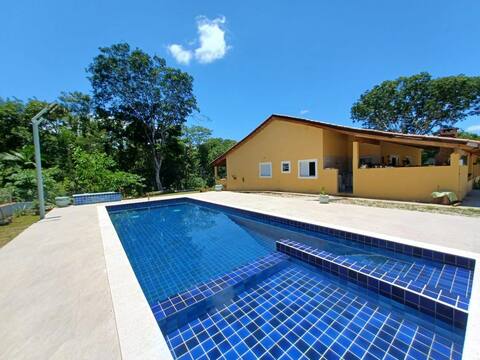
Farm with pool in Pedro de Toledo/SP
Entire Place • N/A
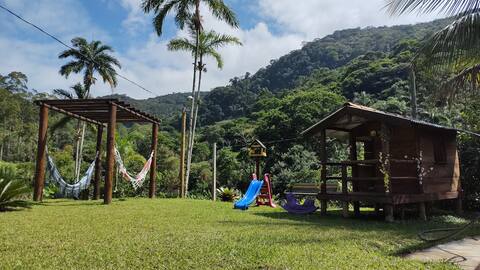
Sitio Serra Nova
Private Room • 4 bedrooms

Quiet farm with swimming pool, hydro and lots of greenery
Entire Place • 5 bedrooms

High-end house in Pedro de Toledo
Entire Place • 4 bedrooms

Chácara dos Santana. Disconnect from SP and relax!
Entire Place • 4 bedrooms

Grange
Entire Place • 6 bedrooms
Note: Performance varies based on location, size, amenities, seasonality, and management quality. Data reflects the past 12 months.
Top Performing Airbnb Hosts in Pedro de Toledo (2026)
Learn from the best! This table showcases top-performing Airbnb hosts in Pedro de Toledo based on the number of properties managed and estimated total revenue over the past year. Analyze their scale and performance metrics.
| Host Name | Properties | Grossing Revenue | Stay Reviews | Avg Rating |
|---|---|---|---|---|
| Natalia | 1 | $16,196 | 3 | 5.00/5.0 |
| Edi | 1 | $13,354 | 11 | 5.00/5.0 |
| Andre Fernando | 1 | $9,678 | 15 | 4.73/5.0 |
| Elaine Cristina | 1 | $6,876 | 6 | 4.67/5.0 |
| Lucas | 1 | $6,583 | 77 | 4.73/5.0 |
| Diego | 1 | $6,401 | 9 | 5.00/5.0 |
| Sônia Aparecida Domingos | 1 | $4,613 | 3 | 5.00/5.0 |
| Marcio | 1 | $4,227 | 1 | Not Rated |
| David Andrade | 1 | $3,592 | 48 | 4.79/5.0 |
| Suzete | 2 | $3,381 | 9 | 4.92/5.0 |
Analyzing the strategies of top hosts, such as their property selection, pricing, and guest communication, can offer valuable lessons for optimizing your own Airbnb operations in Pedro de Toledo.
Dive Deeper: Advanced Pedro de Toledo STR Market Data (2026)
Ready to unlock more insights? AirROI provides access to advanced metrics and comprehensive Airbnb data for Pedro de Toledo. Explore detailed analytics beyond this report to refine your investment strategy, optimize pricing, and maximize your vacation rental profits.
Explore Advanced MetricsPedro de Toledo Short-Term Rental Market Composition (2026): Property & Room Types
Room Type Distribution
Property Type Distribution
Market Composition Insights for Pedro de Toledo
- The Pedro de Toledo Airbnb market composition is heavily skewed towards Entire Home/Apt listings, which make up 95.5% of the 22 active rentals. This indicates strong guest preference for privacy and space.
- Looking at the property type distribution in Pedro de Toledo, House properties are the most common (72.7%), reflecting the local real estate landscape.
- Houses represent a significant 72.7% portion, catering likely to families or larger groups.
- The presence of 13.6% Hotel/Boutique listings indicates integration with traditional hospitality.
- Smaller segments like apartment/condo (combined 4.5%) offer potential for unique stay experiences.
Pedro de Toledo Airbnb Room Capacity Analysis (2026): Bedroom Distribution
Distribution of Listings by Number of Bedrooms
Room Capacity Insights for Pedro de Toledo
- The dominant room capacity in Pedro de Toledo is 4 bedrooms listings, making up 31.8% of the market. This suggests a strong demand for properties suitable for families or small groups.
- Together, 4 bedrooms and 2 bedrooms properties represent 54.5% of the active Airbnb listings in Pedro de Toledo, indicating a high concentration in these sizes.
- A significant 63.6% of listings offer 3+ bedrooms, catering to larger groups and families seeking more space in Pedro de Toledo.
Pedro de Toledo Vacation Rental Guest Capacity Trends (2026)
Distribution of Listings by Guest Capacity
Guest Capacity Insights for Pedro de Toledo
- The most common guest capacity trend in Pedro de Toledo vacation rentals is listings accommodating 8+ guests (86.4%). This suggests the primary traveler segment is likely larger groups.
- Properties designed for 8+ guests and 5 guests dominate the Pedro de Toledo STR market, accounting for 95.5% of listings.
- 86.4% of properties accommodate 6+ guests, serving the market segment for larger families or group travel in Pedro de Toledo.
- On average, properties in Pedro de Toledo are equipped to host 7.5 guests.
Pedro de Toledo Airbnb Booking Patterns (2026): Available vs. Booked Days
Available Days Distribution
Booked Days Distribution
Booking Pattern Insights for Pedro de Toledo
- The most common availability pattern in Pedro de Toledo falls within the 271-366 days range, representing 95.5% of listings. This suggests many properties have significant open periods on their calendars.
- Approximately 100.0% of listings show high availability (181+ days open annually), indicating potential for increased bookings or specific owner usage patterns.
- For booked days, the 1-30 days range is most frequent in Pedro de Toledo (50%), reflecting common guest stay durations or potential owner blocking patterns.
Pedro de Toledo Airbnb Minimum Stay Requirements Analysis
Distribution of Listings by Minimum Night Requirement
1 Night
10 listings
45.5% of total
2 Nights
6 listings
27.3% of total
3 Nights
3 listings
13.6% of total
30+ Nights
3 listings
13.6% of total
Key Insights
- The most prevalent minimum stay requirement in Pedro de Toledo is 1 Night, adopted by 45.5% of listings. This highlights the market's preference for shorter, flexible bookings.
- A strong majority (72.8%) of the Pedro de Toledo Airbnb data shows acceptance of very short stays (1-2 nights), indicating a dynamic, high-turnover market.
- A significant segment (13.6%) caters to monthly stays (30+ nights) in Pedro de Toledo, pointing to opportunities in the extended-stay market.
Recommendations
- Align with the market by considering a 1 Night minimum stay, as 45.5% of Pedro de Toledo hosts use this setting.
- Explore offering discounts for stays of 30+ nights to attract the 13.6% of the market seeking extended stays.
- Adjust minimum nights based on seasonality – potentially shorter during low season and longer during peak demand periods in Pedro de Toledo.
Pedro de Toledo Airbnb Cancellation Policy Trends Analysis (2026)
Limited
1 listings
4.5% of total
Flexible
5 listings
22.7% of total
Moderate
8 listings
36.4% of total
Firm
3 listings
13.6% of total
Strict
5 listings
22.7% of total
Cancellation Policy Insights for Pedro de Toledo
- The prevailing Airbnb cancellation policy trend in Pedro de Toledo is Moderate, used by 36.4% of listings.
- There's a relatively balanced mix between guest-friendly (59.1%) and stricter (36.3%) policies, offering choices for different guest needs.
Recommendations for Hosts
- Consider adopting a Moderate policy to align with the 36.4% market standard in Pedro de Toledo.
- Regularly review your cancellation policy against competitors and market demand shifts in Pedro de Toledo.
Pedro de Toledo STR Booking Lead Time Analysis (2026)
Average Booking Lead Time by Month
Booking Lead Time Insights for Pedro de Toledo
- The overall average booking lead time for vacation rentals in Pedro de Toledo is 42 days.
- Guests book furthest in advance for stays during December (average 76 days), likely coinciding with peak travel demand or local events.
- The shortest booking windows occur for stays in October (average 10 days), indicating more last-minute travel plans during this time.
- Seasonally, Winter (43 days avg.) sees the longest lead times, while Fall (15 days avg.) has the shortest, reflecting typical travel planning cycles.
Recommendations for Hosts
- Use the overall average lead time (42 days) as a baseline for your pricing and availability strategy in Pedro de Toledo.
- For December stays, consider implementing length-of-stay discounts or slightly higher rates for bookings made less than 76 days out to capitalize on advance planning.
- During October, focus on last-minute booking availability and promotions, as guests book with very short notice (10 days avg.).
- Target marketing efforts for the Winter season well in advance (at least 43 days) to capture early planners.
- Monitor your own booking lead times against these Pedro de Toledo averages to identify opportunities for dynamic pricing adjustments.
Popular & Essential Airbnb Amenities in Pedro de Toledo (2026)
Amenity Prevalence
Amenity Insights for Pedro de Toledo
- Essential amenities in Pedro de Toledo that guests expect include: Kitchen, Free parking on premises. Lacking these (any) could significantly impact bookings.
- Popular amenities like TV, Pool, Wifi are common but not universal. Offering these can provide a competitive edge.
- A pool is a highly desired but not standard amenity, making it a key feature for attracting guests seeking leisure in Pedro de Toledo.
- Warning: Wifi is not universally provided but is considered essential globally. Ensure reliable Wifi is offered.
Recommendations for Hosts
- Ensure your listing includes all essential amenities for Pedro de Toledo: Kitchen, Free parking on premises.
- Prioritize adding missing essentials: Free parking on premises.
- Consider adding popular differentiators like TV or Pool to increase appeal.
- Highlight unique or less common amenities you offer (e.g., hot tub, dedicated workspace, EV charger) in your listing description and photos.
- Regularly check competitor amenities in Pedro de Toledo to stay competitive.
Pedro de Toledo Airbnb Guest Demographics & Profile Analysis (2026)
Guest Profile Summary for Pedro de Toledo
- The typical guest profile for Airbnb in Pedro de Toledo consists of primarily domestic travelers (89%), often arriving from nearby São Paulo, typically belonging to the Post-2000s (Gen Z/Alpha) group (50%), primarily speaking Portuguese or English.
- Domestic travelers account for 88.9% of guests.
- Key international markets include Brazil (88.9%) and United States (11.1%).
- Top languages spoken are Portuguese (60%) followed by English (30%).
- A significant demographic segment is the Post-2000s (Gen Z/Alpha) group, representing 50% of guests.
Recommendations for Hosts
- Target domestic marketing efforts towards travelers from São Paulo and Osasco.
- Tailor amenities and listing descriptions to appeal to the dominant Post-2000s (Gen Z/Alpha) demographic (e.g., highlight fast WiFi, smart home features, local guides).
- Highlight unique local experiences or amenities relevant to the primary guest profile.
- Consider seasonal promotions aligned with peak travel times for key origin markets.
Nearby Short-Term Rental Market Comparison
How does the Pedro de Toledo Airbnb market stack up against its neighbors? Compare key performance metrics like average monthly revenue, ADR, and occupancy rates in surrounding areas to understand the broader regional STR landscape.
| Market | Active Properties | Monthly Revenue | Daily Rate | Avg. Occupancy |
|---|---|---|---|---|
| Riviera de São Lourenço | 10 | $2,868 | $213.78 | 46% |
| Itupeva | 136 | $1,561 | $225.82 | 28% |
| Campo Limpo Paulista | 49 | $1,428 | $181.02 | 30% |
| Elias Fausto | 13 | $1,296 | $143.78 | 30% |
| Porto Feliz | 69 | $1,279 | $260.86 | 27% |
| Tietê | 14 | $1,245 | $237.69 | 25% |
| Bom Jesus dos Perdões | 83 | $1,236 | $167.74 | 28% |
| Mairinque | 347 | $1,200 | $177.68 | 27% |
| Bertioga | 4,456 | $1,191 | $190.53 | 29% |
| Itu | 272 | $1,169 | $198.29 | 26% |